

Gold Analysis 2026/04/16
0
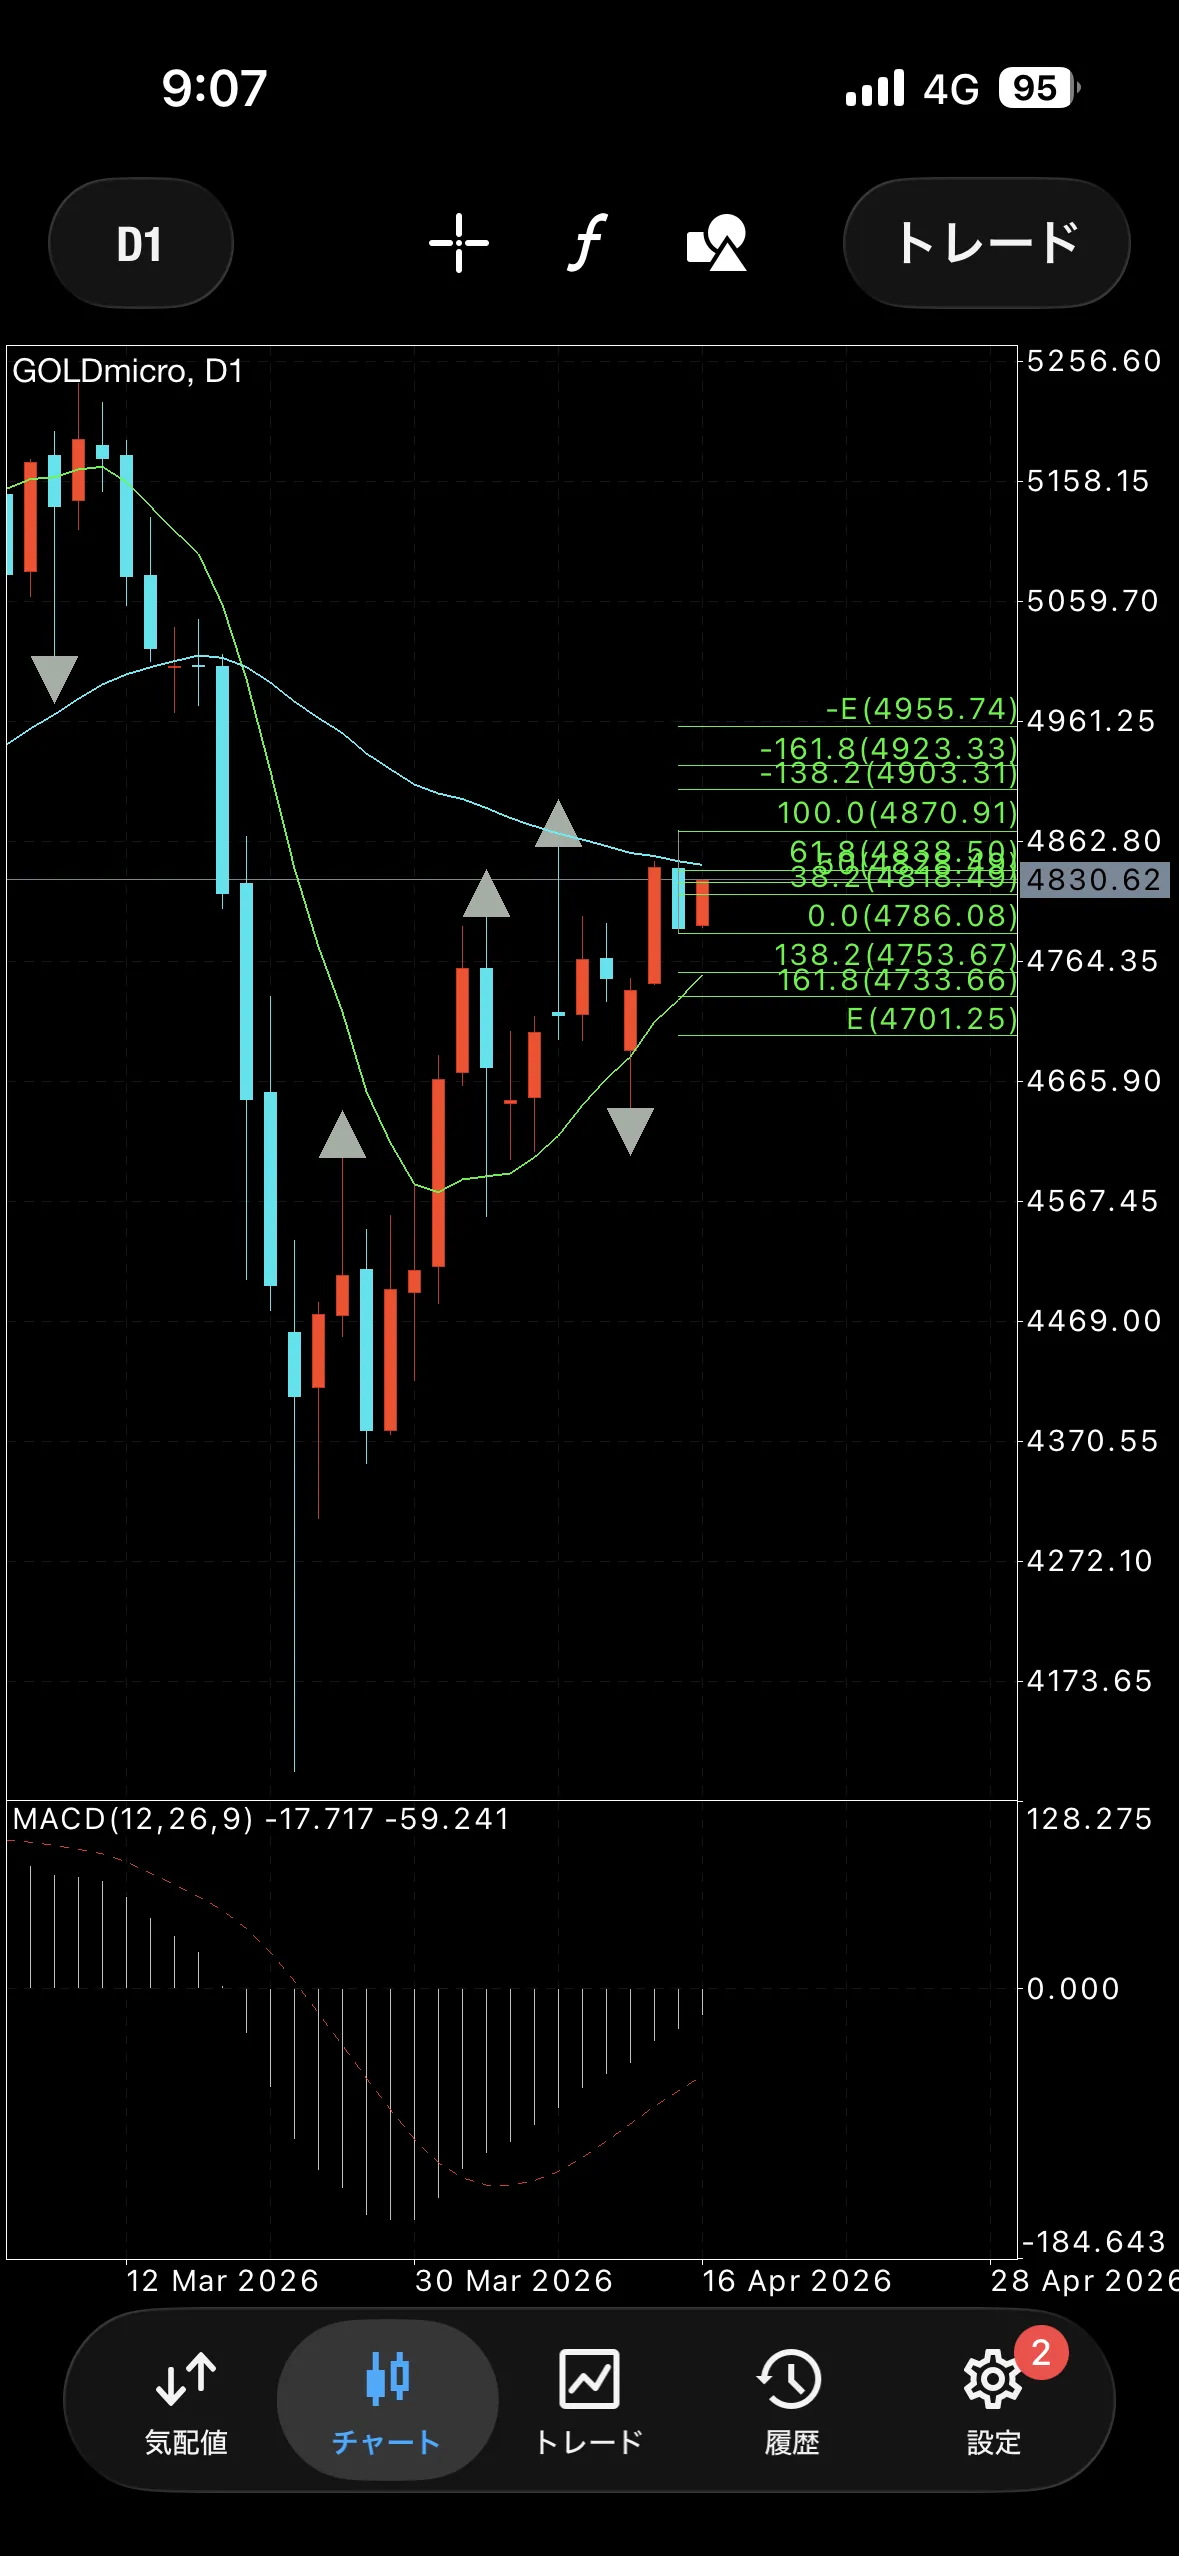
Yesterday's daily chart was bearish
Since it touched the medium-term moving average with a bearish candle, a short-term decline is in view.
【4-hour chart】
Because the second outside bar has appeared, it gives a strong impression of selling pressure.
MACD is near the DC, so if the next candle is bearish, it may move a bit further downward.
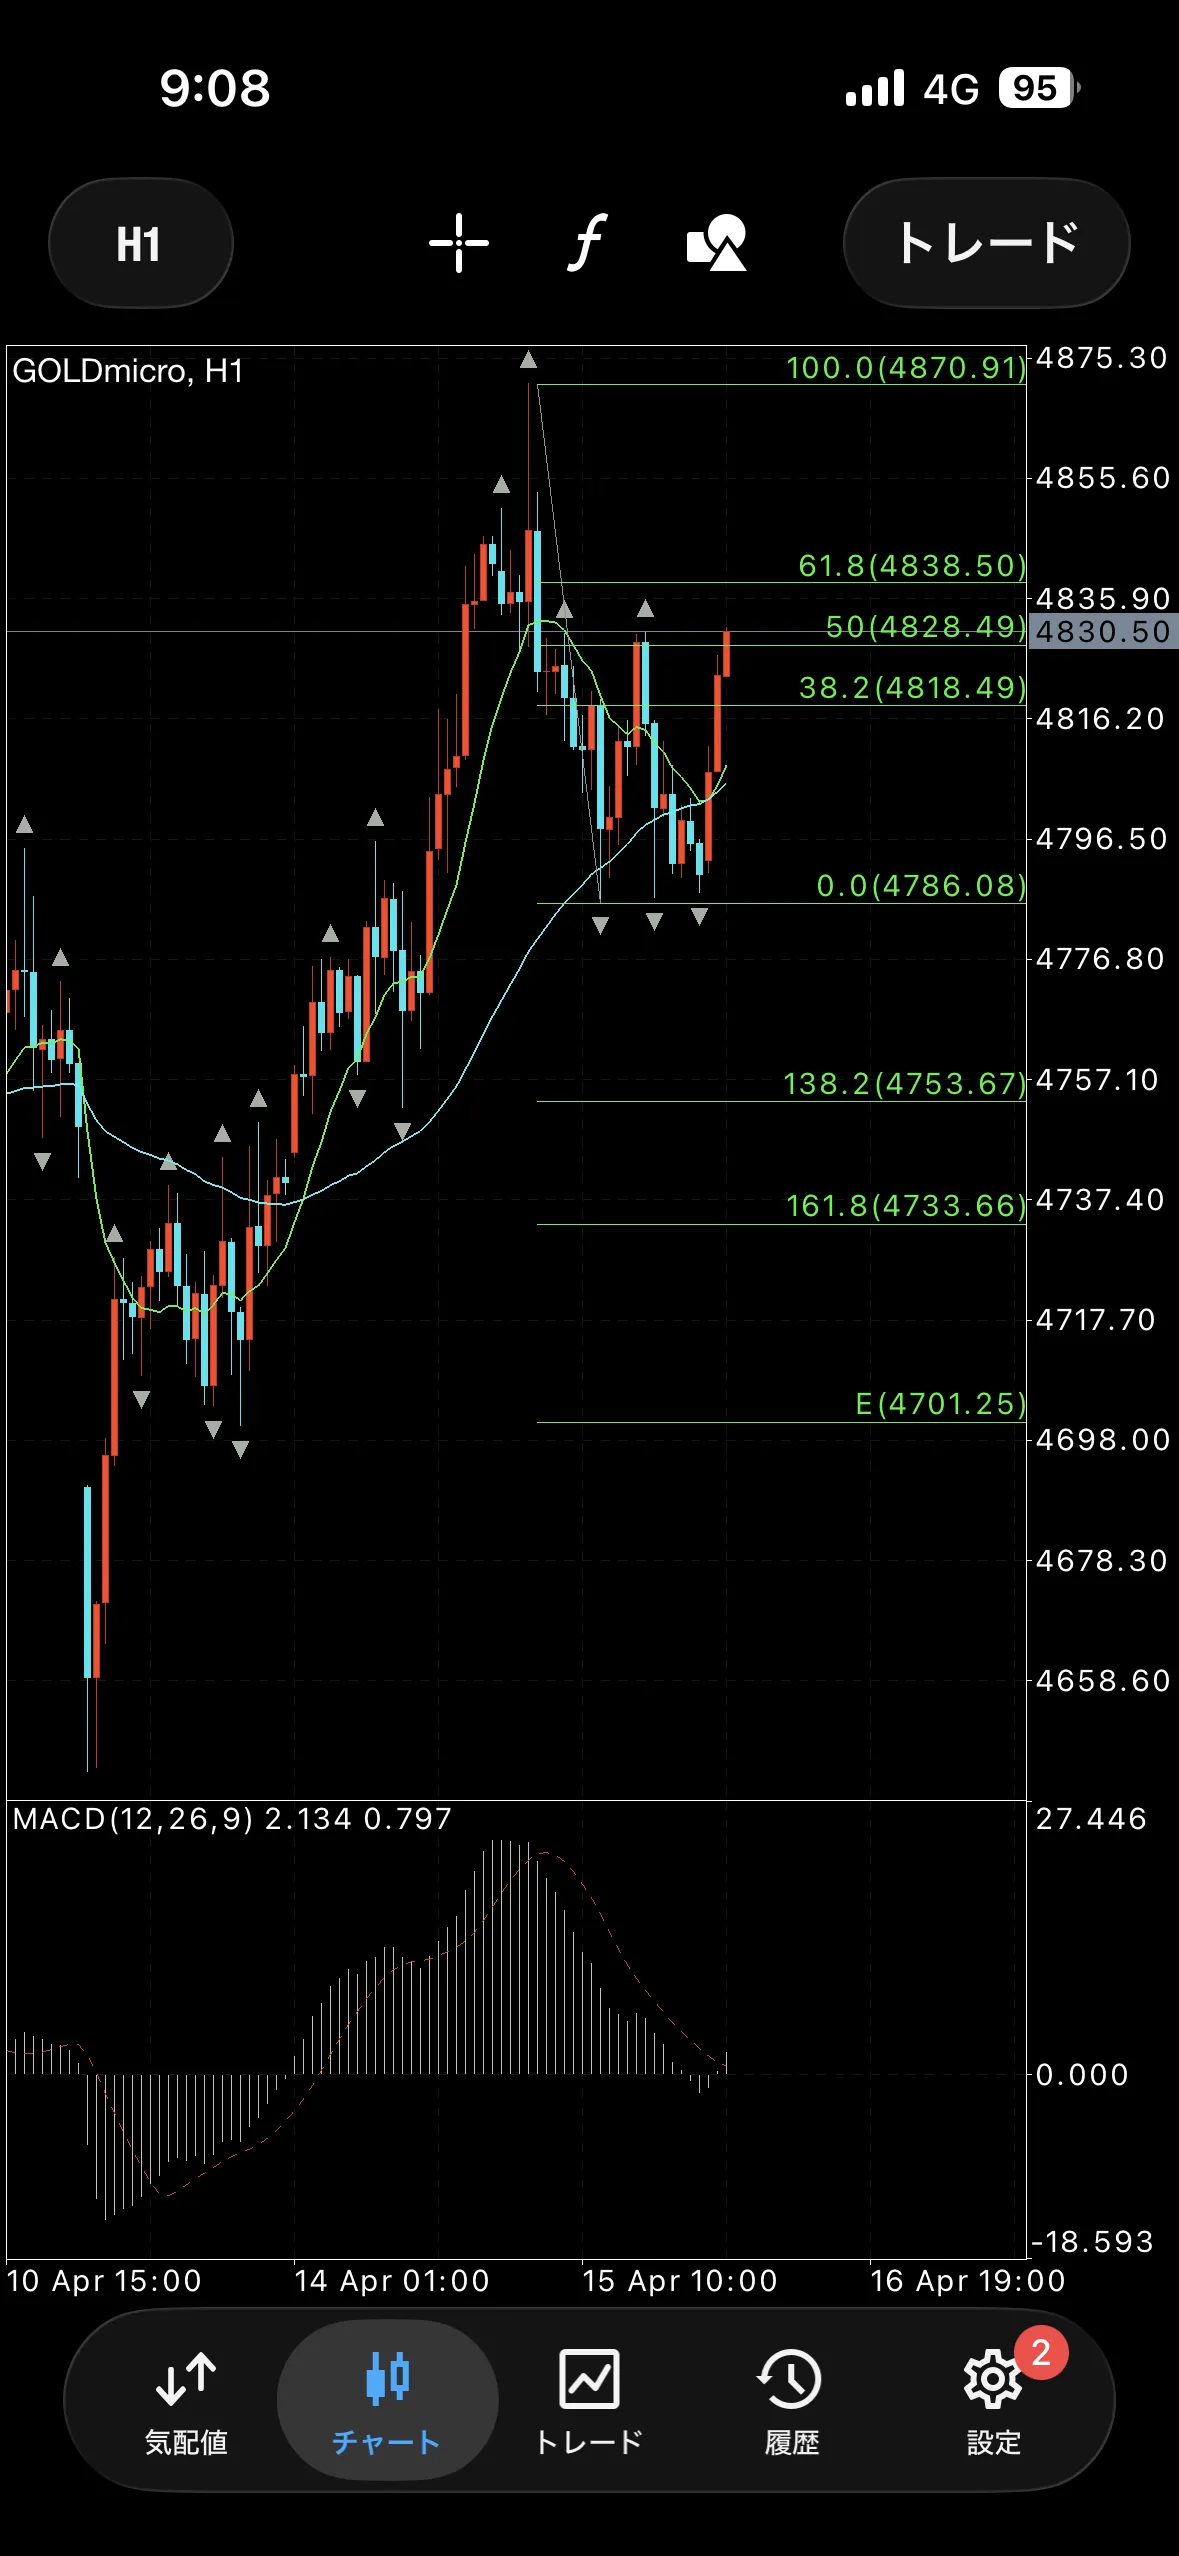
【1-hour chart】
At present, it is on a horizontal line that could be a WB neckline candidate, so the battle here is something to watch closely.
With five bearish candles having dropped the price, three bullish candles are bringing it back up, so buying may strengthen in the morning.
【Sell defense line】
4870
4848
4828
【Buy defense line】
4798〜86
Near 4750
Near 4733〜23
× ![]()