
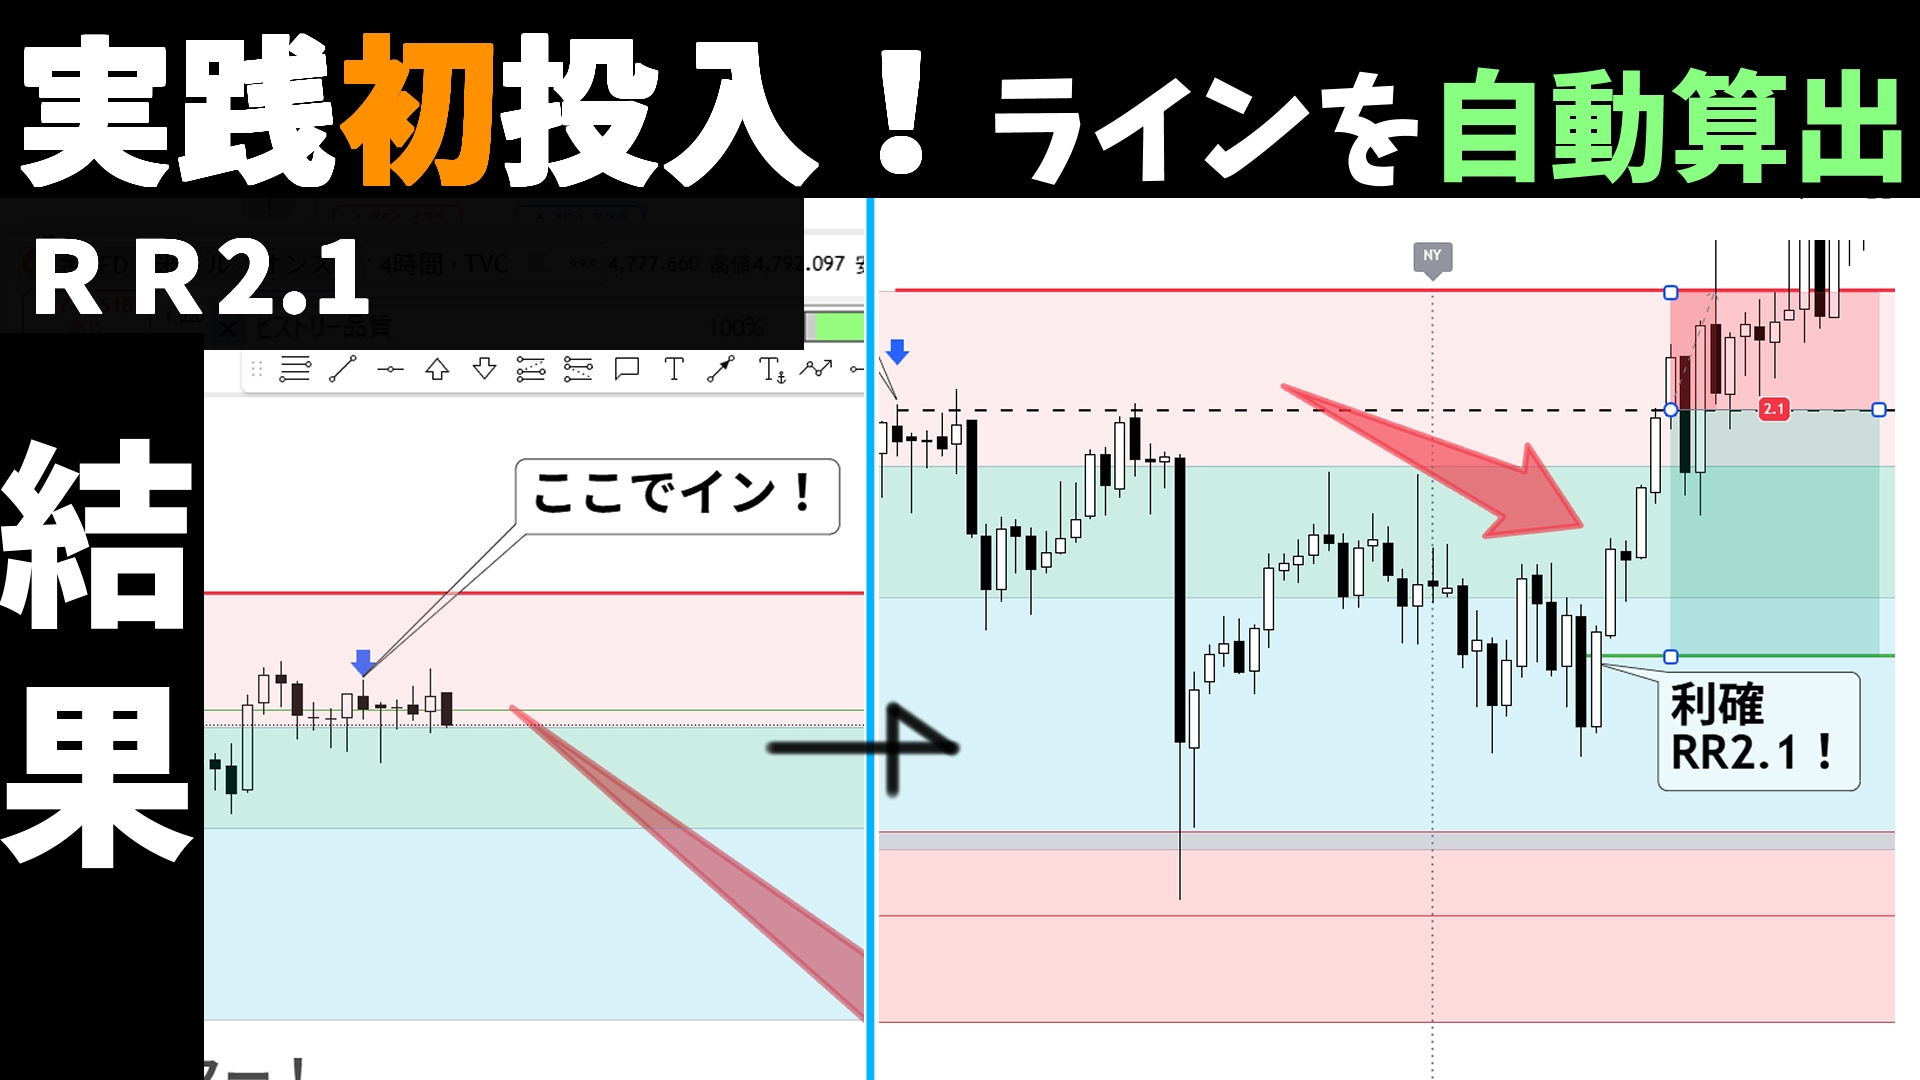
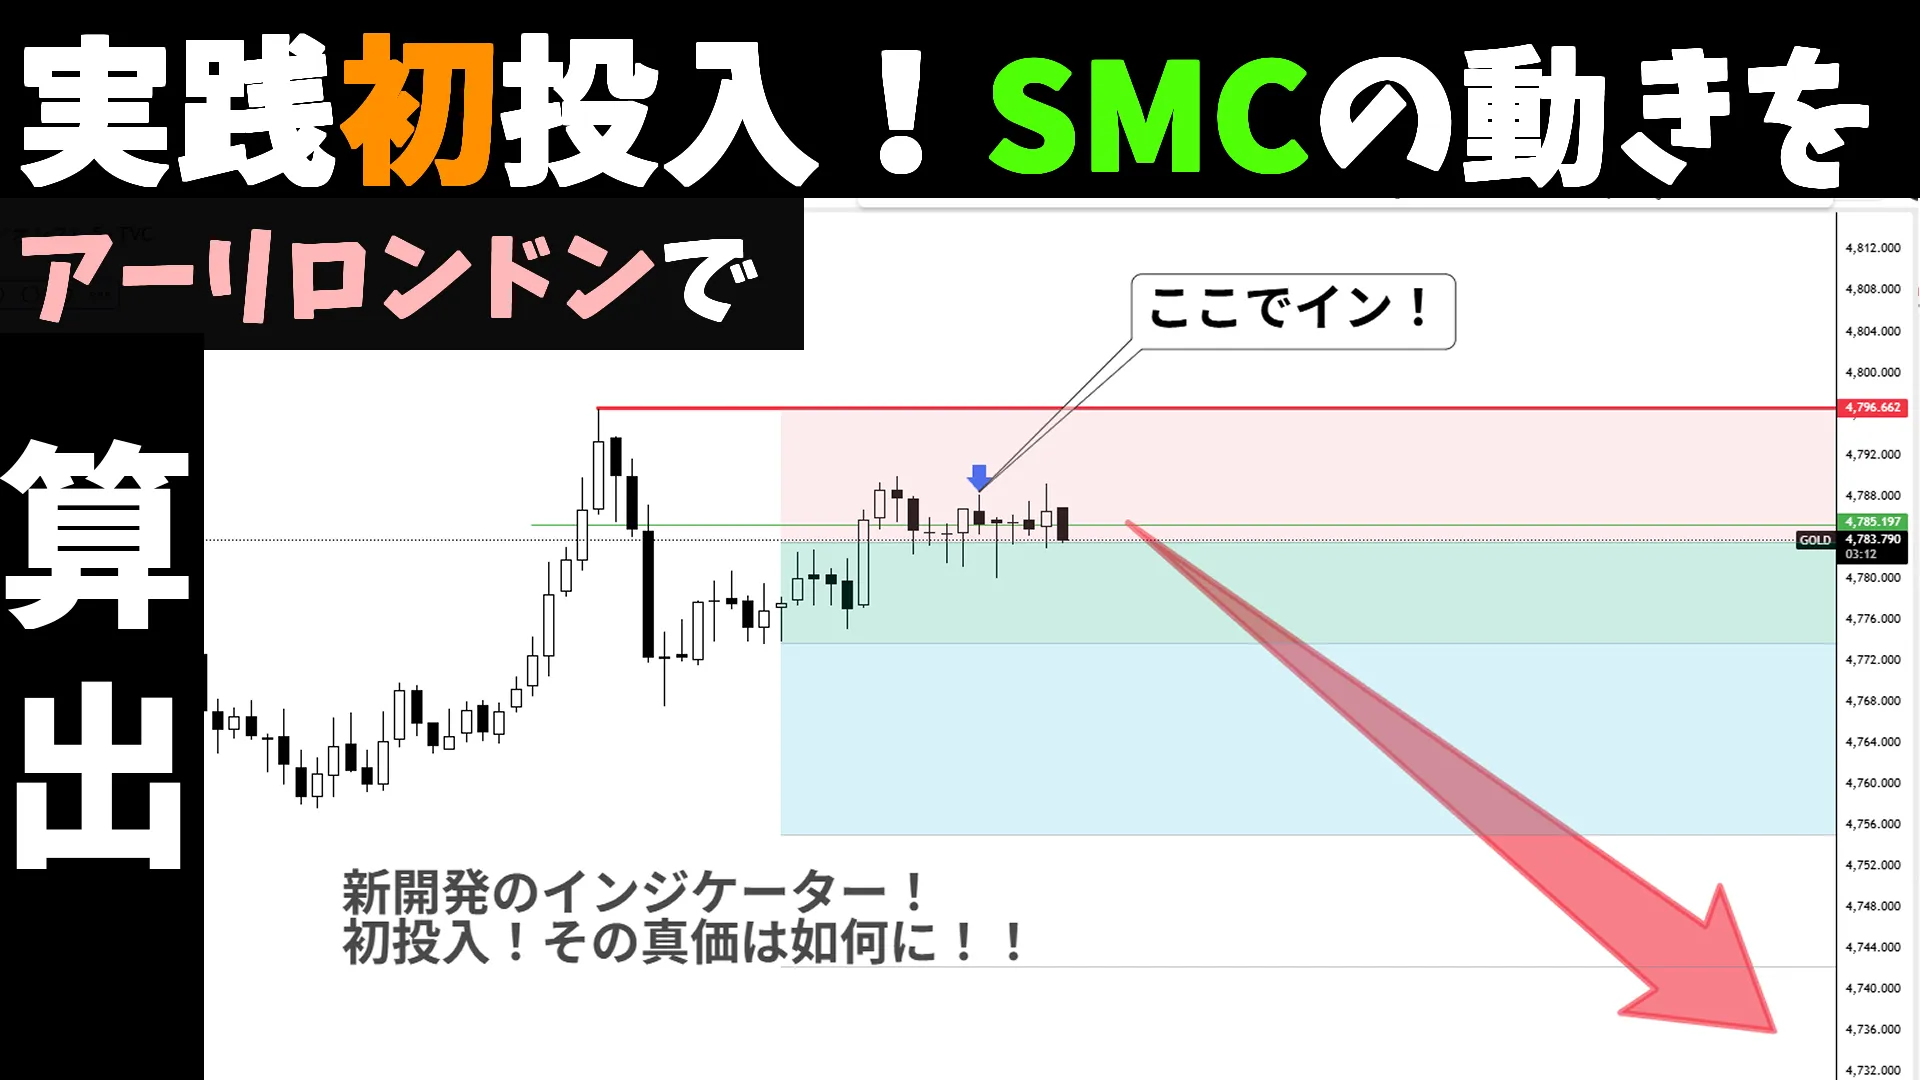
Initial投入 line calculation indicator! Result is RR2.1! Also, in another indicator...
Previous post image below

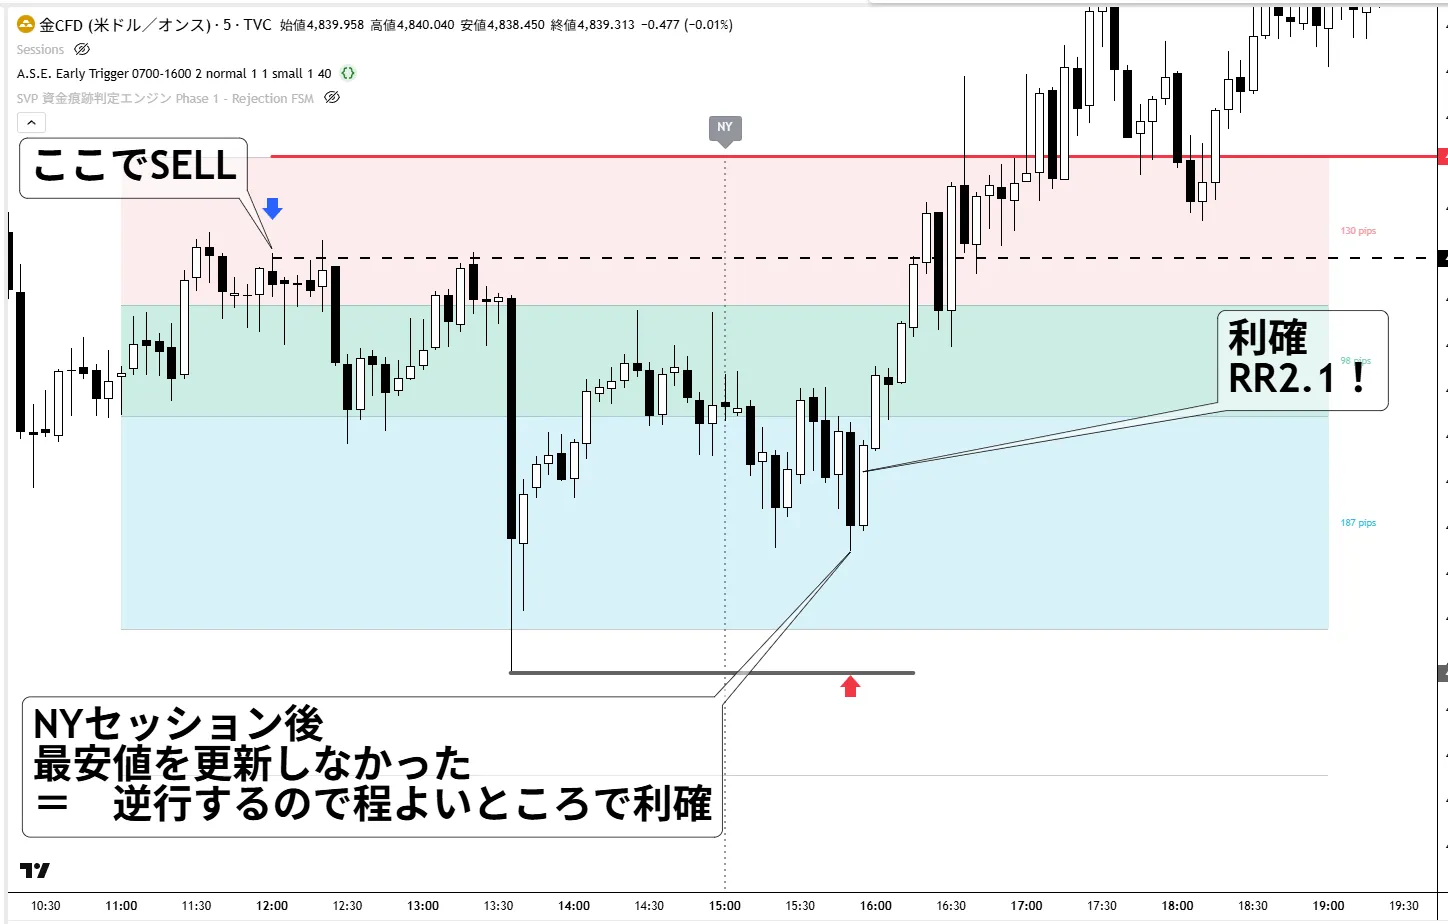
After SELL, it dropped significantly. It reacted firmly at each boundary along the way
which is reassuring to see,
though nerve-wracking, I’m happy.
It firmly rebounded after crossing the blue boundary (as expected)
I watched the movement after the NY session.
If it reverses again and breaks the recent low, I will continue to monitor for a downtrend.
If it does not exceed, take profit
・Did not exceed
→ Take profit
RR is 2.1.
In backtesting, the same behavior occurs, and now the question is whether it can be reliably used in real trading, but since it goes as expected, I will commercialize it.
A.S.E Early Trigger
A one-day gauge that draws lines using only primary data, without oscillators—an extremely fresh indicator for that day.
■ Actually....
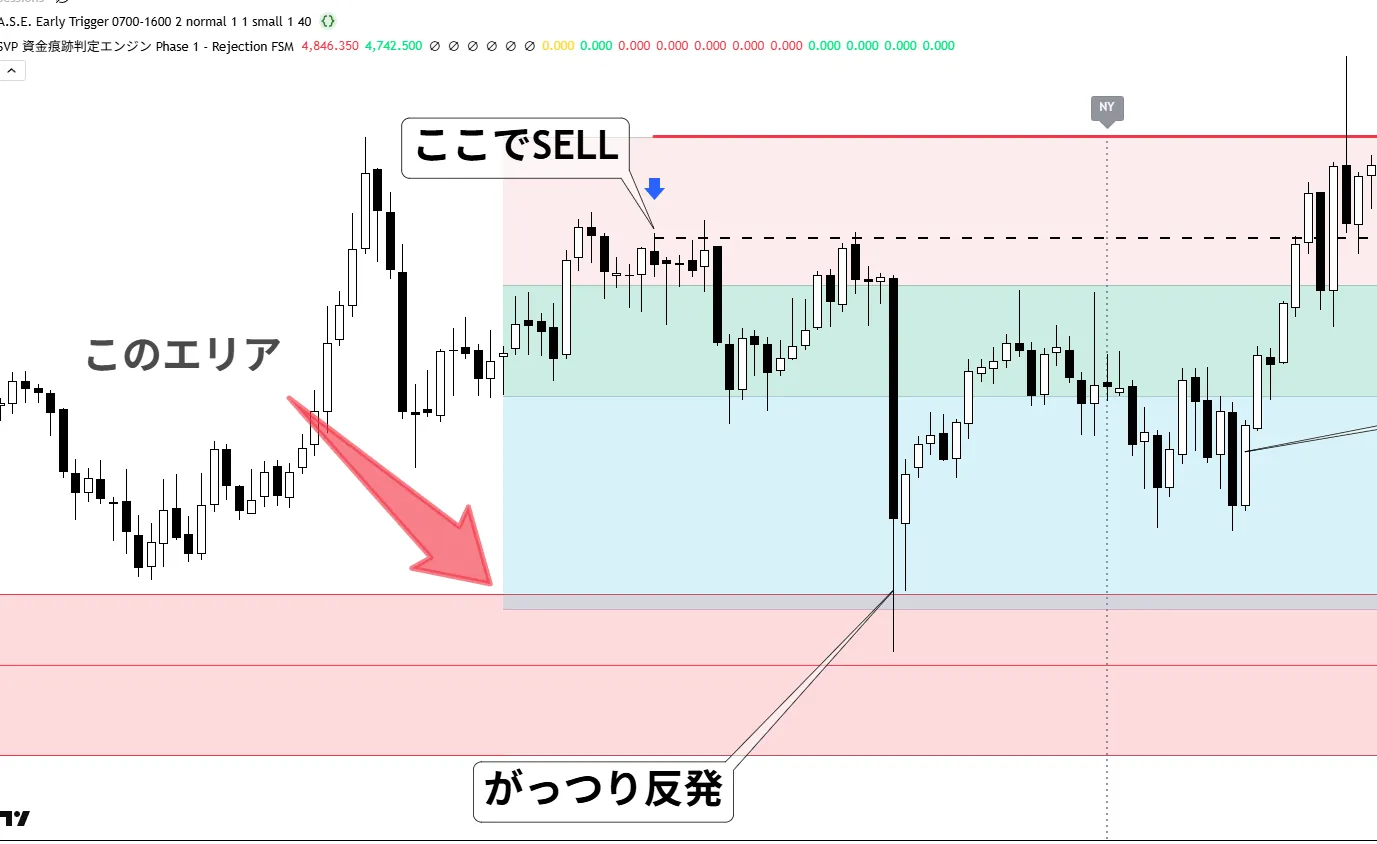
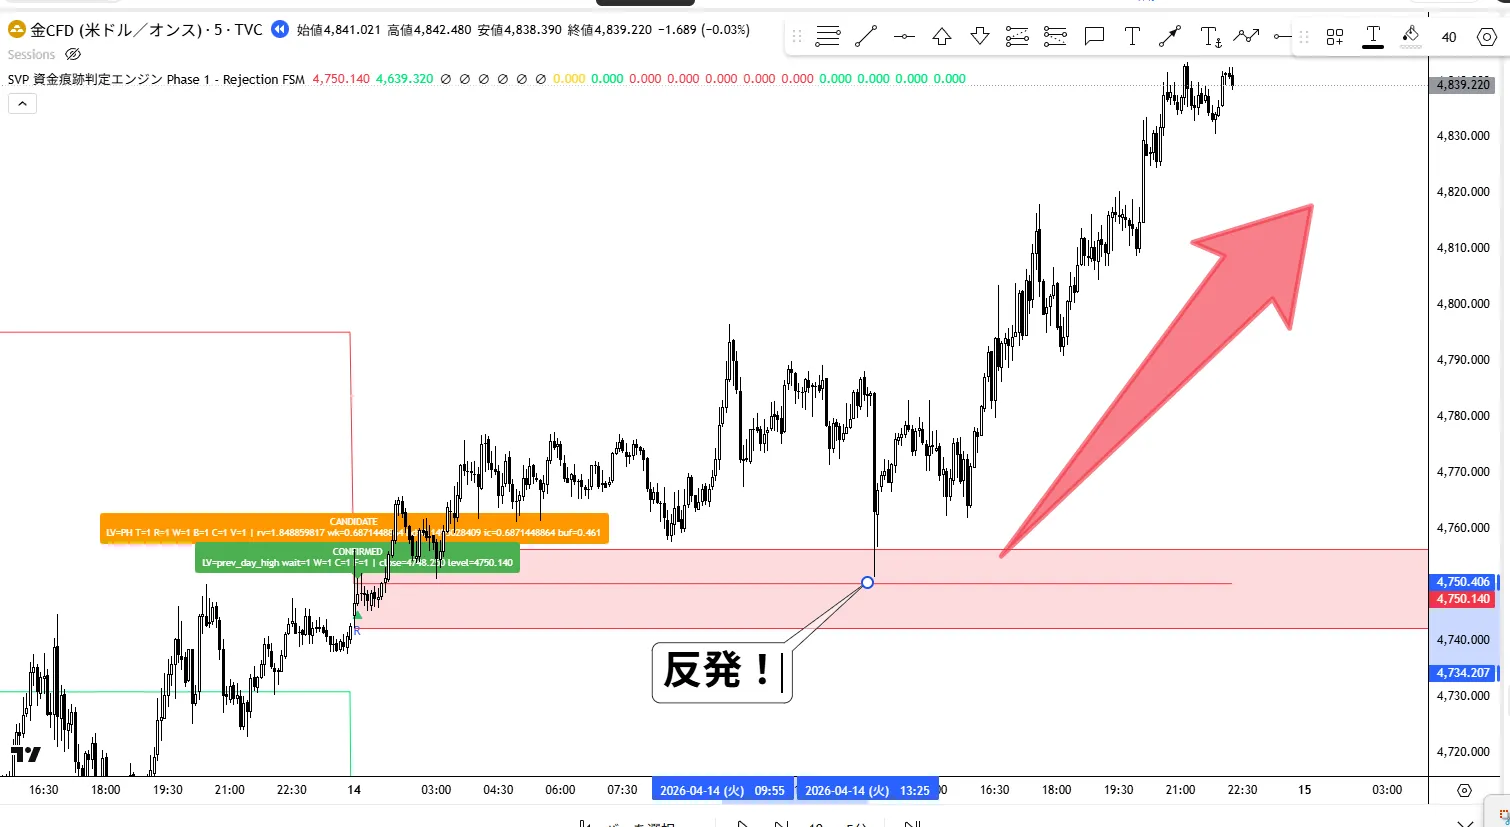
In the previous chart, at the bottom where a large decline occurred,
it is still under development
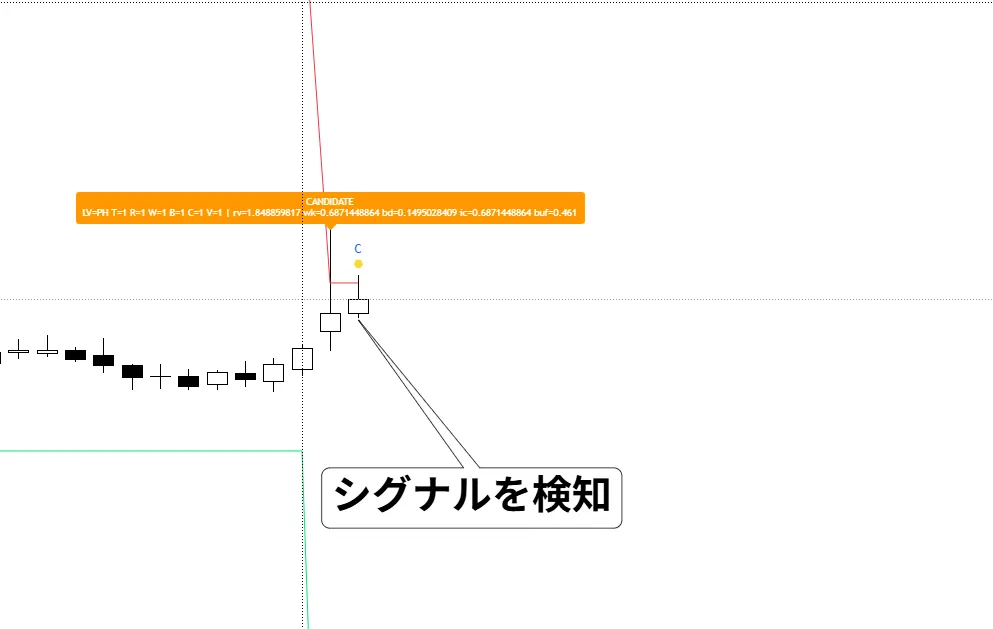
“Detecting traces of institutional investor intervention”
It showed a solid rebound within the area drawn by the indicator.
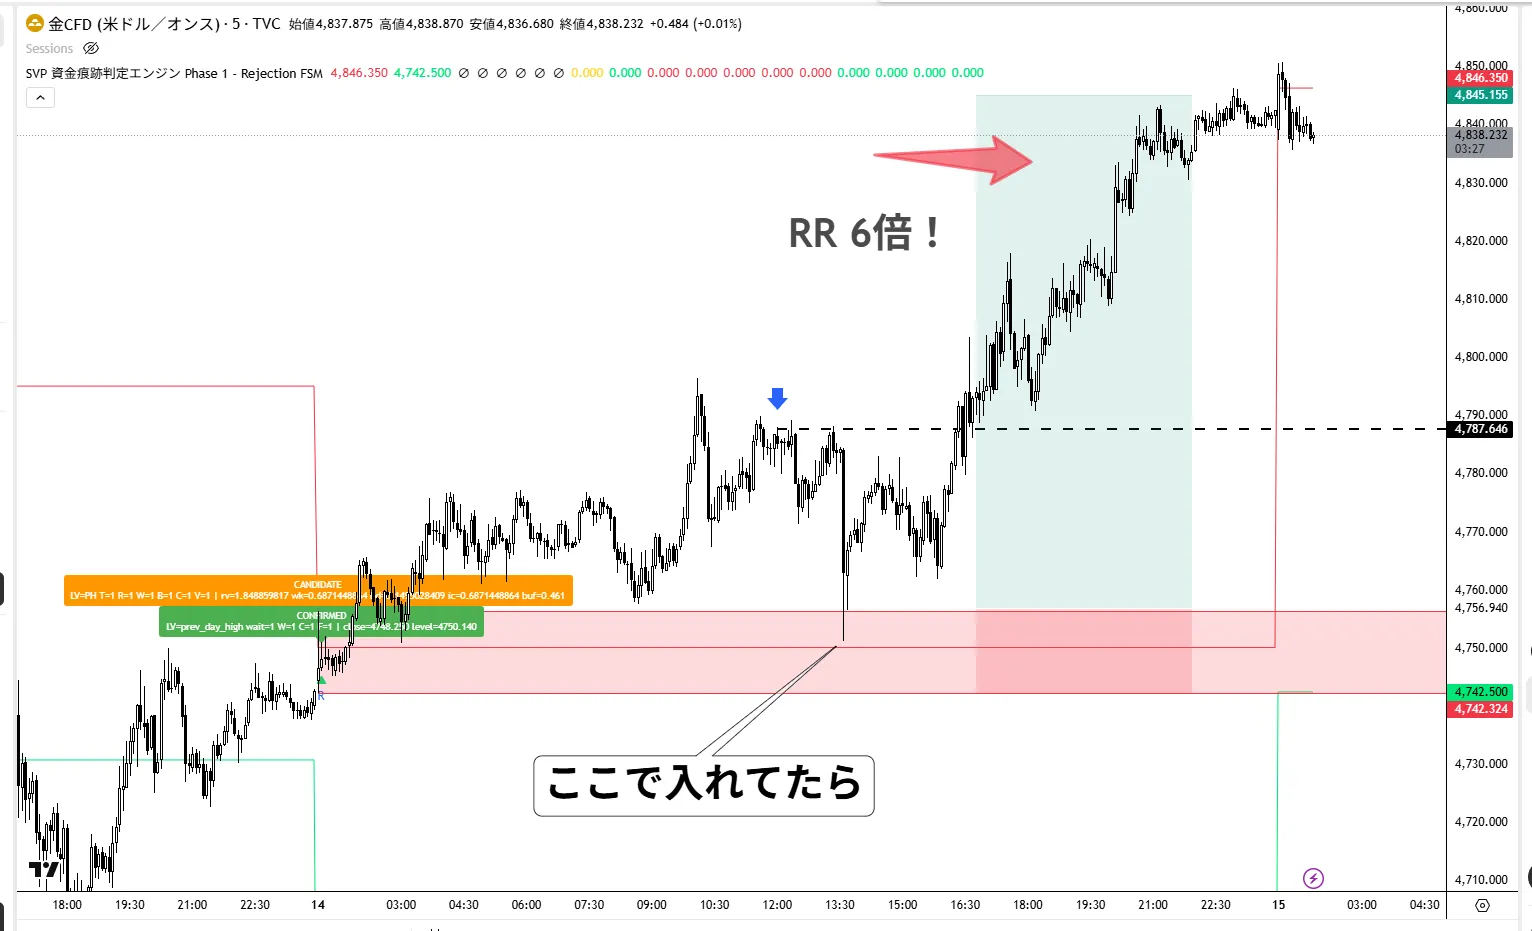
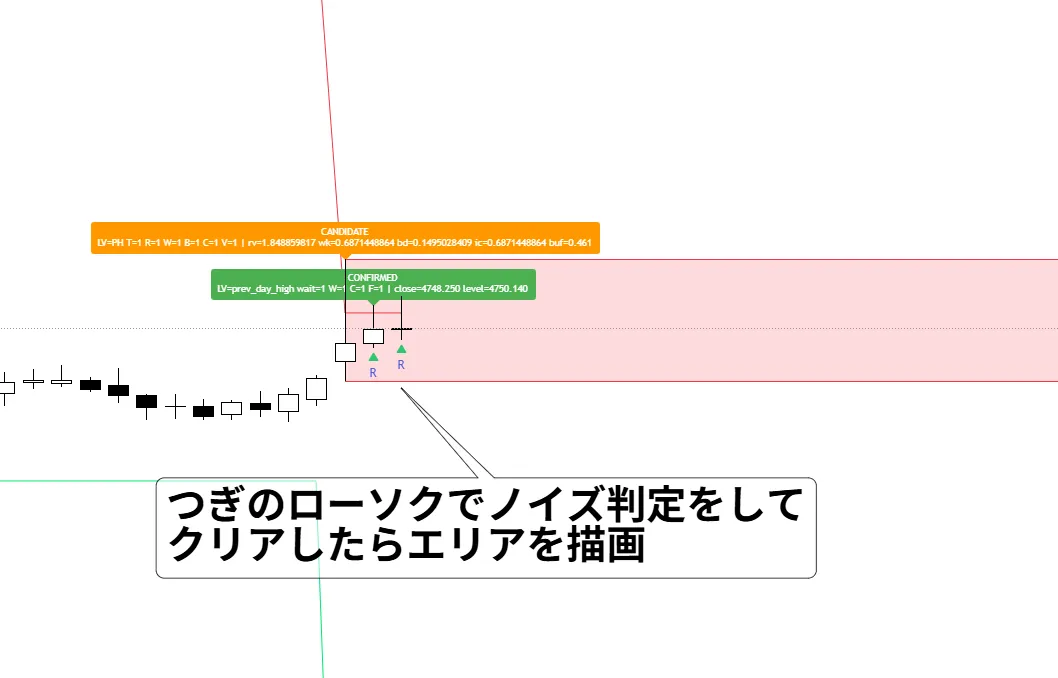
We plan to have three detection features; currently, the first one, the "rejection" pattern, is in experimental stage, but
SVP trace detection engine (provisional) is performing very well. On the same day, it even produced RR up to 6.
In SMC basics and also my research subject, Wyckoff theory's
rejection, absorption, and propulsion
The first detection, “rejection,” is being tested; its groundwork behavior is excellent.
I’m looking forward to the fate of this kid as well.
TradingView is nice; there is little trouble with scripts, and pure verification is possible. I wish I had known about it sooner.