

Gold Analysis on 2026/04/14
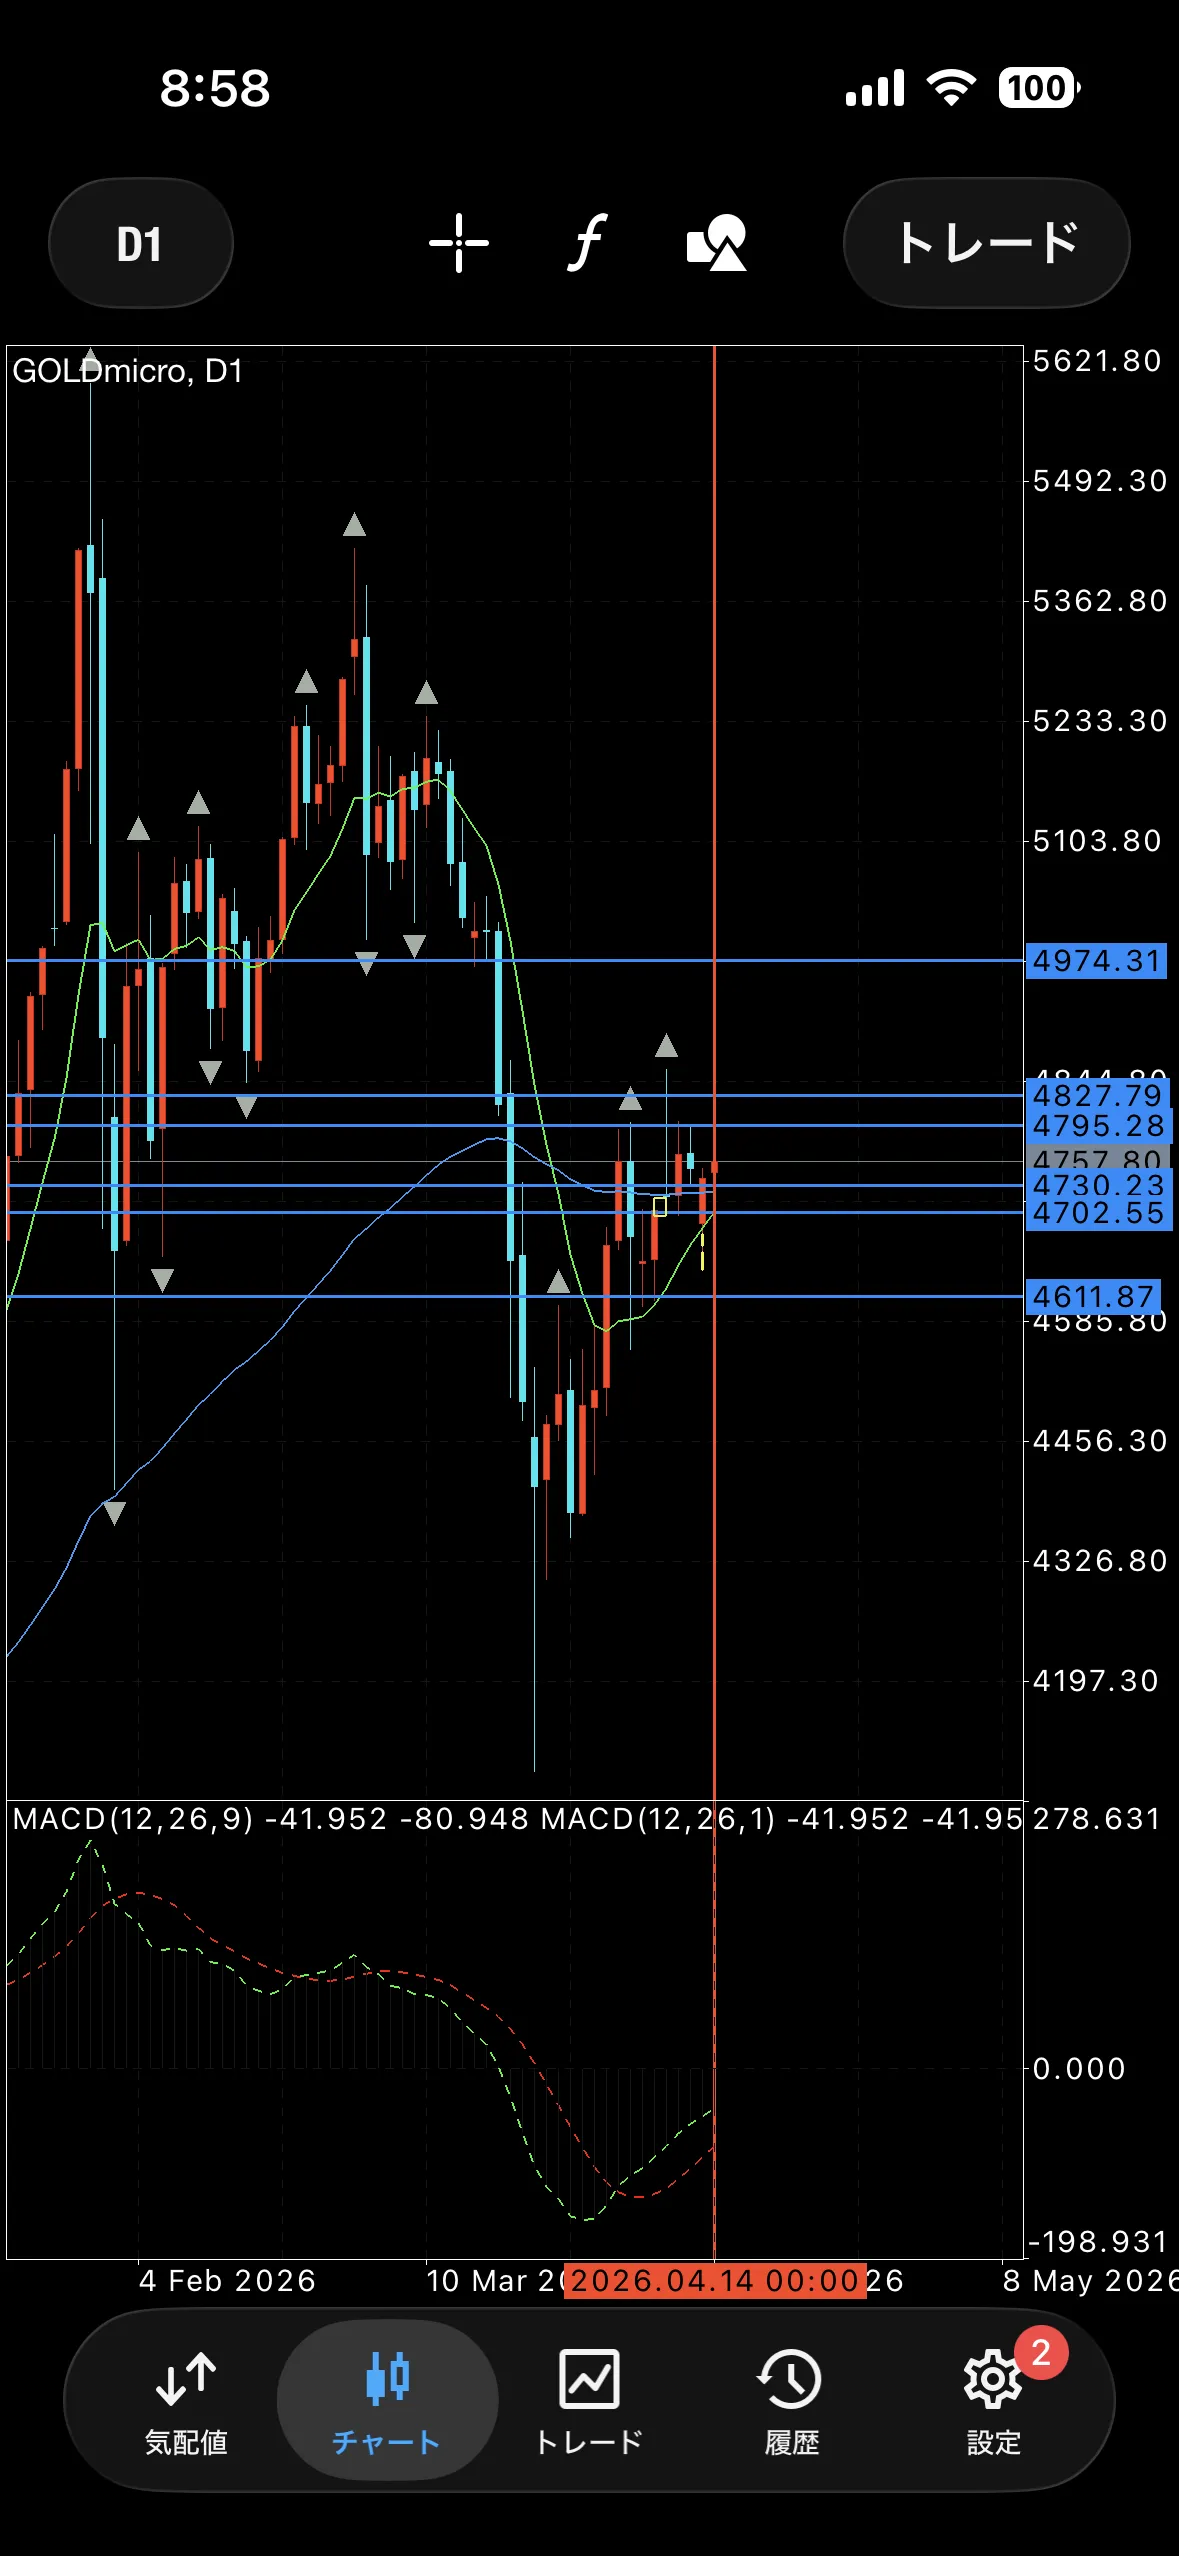
The daily chart was a bullish candlestick.
We remain bullish until it clearly falls below around 4700, which was the starting point of the rally.
Regarding gaps, they are tricky to handle, but since this is a bullish candlestick after a V-shaped rally, buying pressure feels strong.
【Outlook】
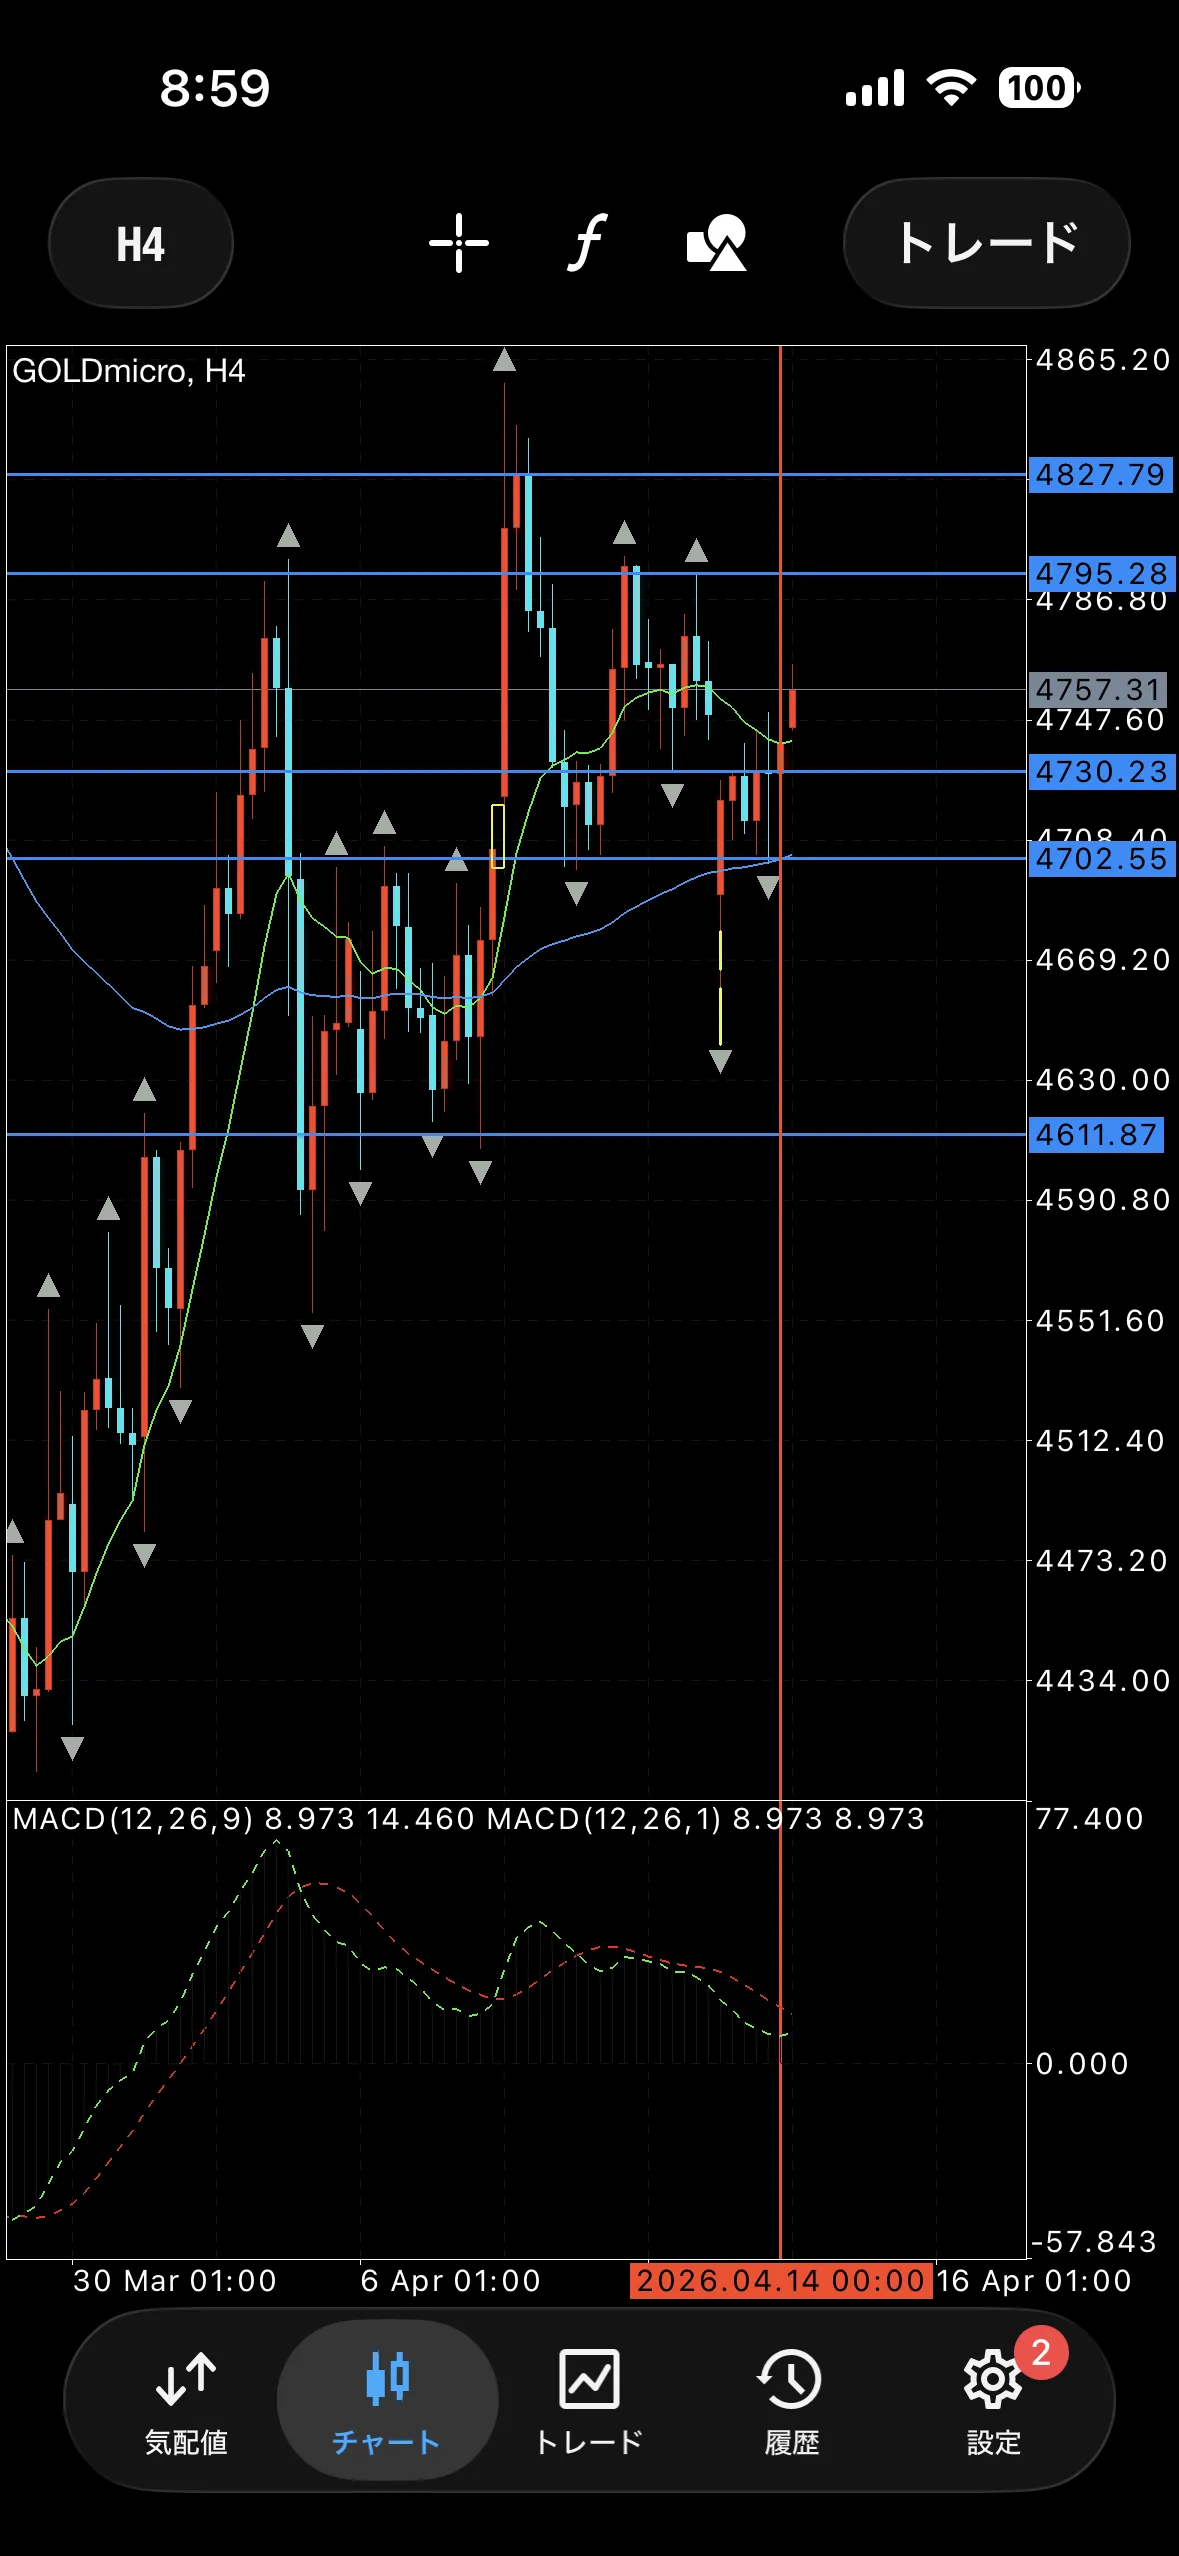
・4-hour
There is a long lower shadow near 75 MA with an upward move, but in the short term it looks like selling could occur.
It may be forming a rising three inside, so after the right shoulder is completed, we need to watch for a false breakout rally or a true three-in-one formation.
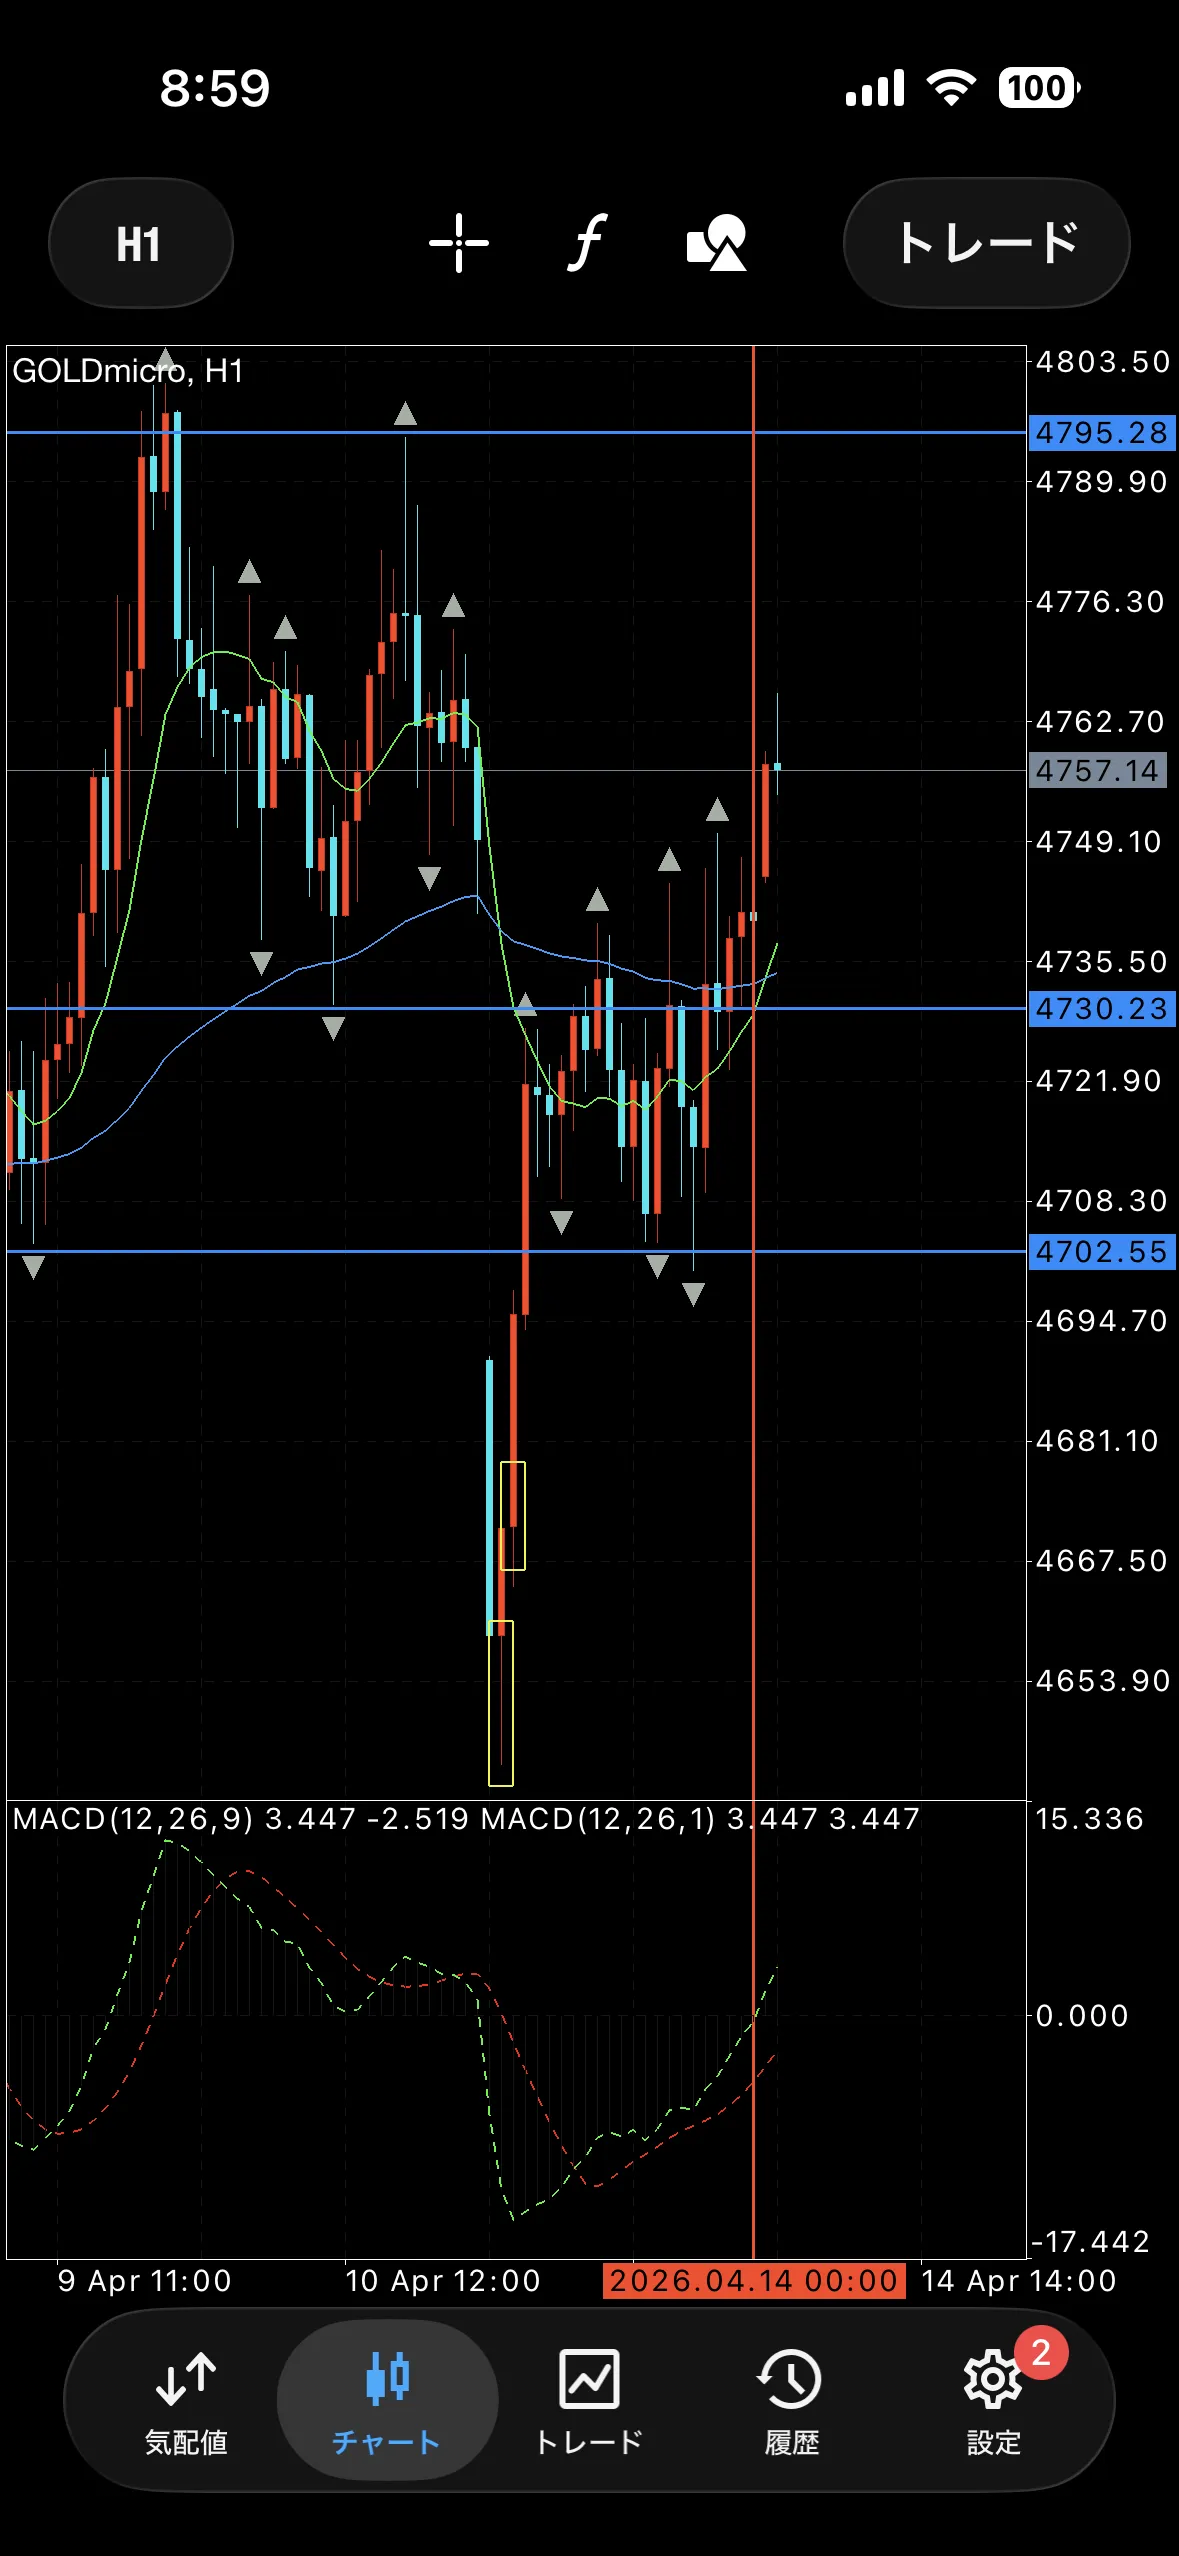
・1-hour
It has broken the neck line of WT and MACD is also turning upward, but the rally stalls near the right shoulder.
Observe whether it pulls back after a brief correction or continues to rise.
【Defensive lines for selling】
4795
4765
【Defensive lines for buying】
4730
4702