Dollar-Yen Forecast April 4
■ USD/JPY Daily Chart Prediction Today
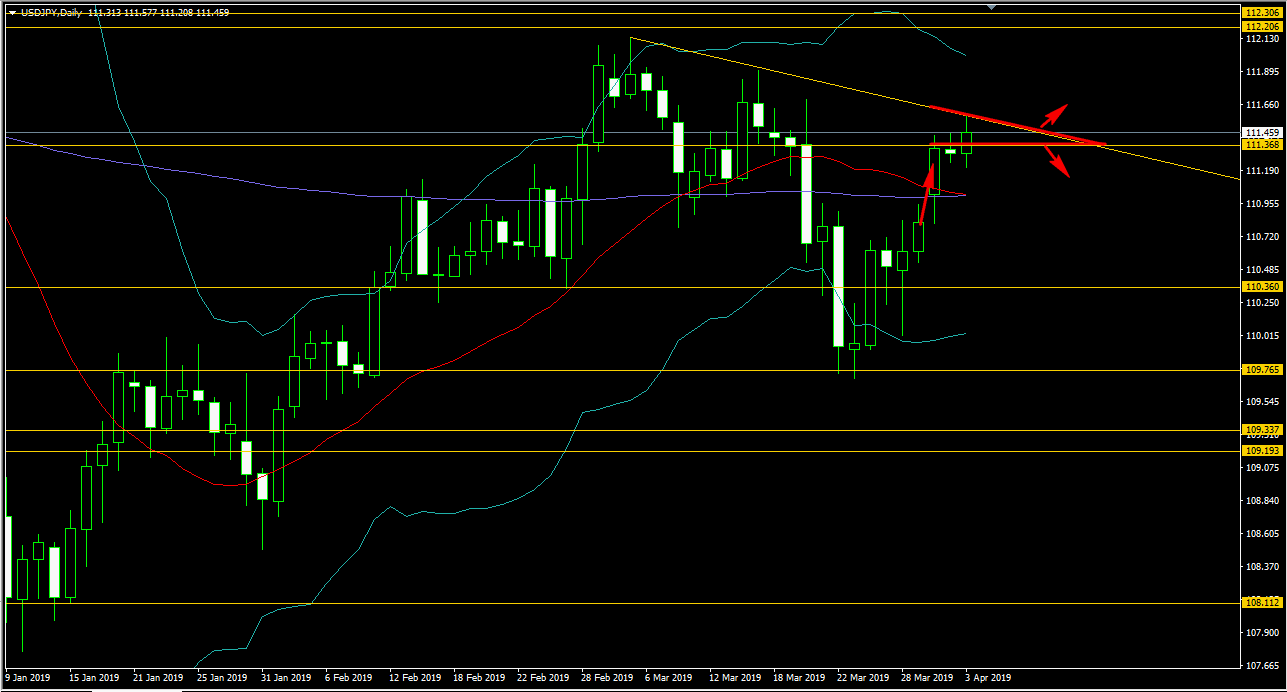
From the USD/JPY daily chart, looking at it, on the daily chart the pair briefly broke above a double wall consisting of the purple 200 MA, which is considered a strong resistance level that only large institutional players watch, and the red line 20 MA, the middle band of the Bollinger Bands. However, it immediately ran into the resistance of the higher-timeframe trendline, and was held down. Currently, it is sandwiched between the resistance part of the higher-timeframe trendline and what appears to be a strong level around USD/JPY 111.368, and the market is at a juncture where it remains unclear whether it will move higher or be pushed back lower, so upside momentum is expected to remain heavy.
What are the predictions and analysis for the 4-hour and 1-hour charts? Ultimately, can we enter? Read more here