

Utilization of "Visualization Indicators" (Part 246)
「Visibility Indicator」 utilization(that246)
1. Evolution of the “28 Currency Pairs List Indicator” into an even more advanced indicator
“8CP Visualisation Indicator” for GBPUSD charting
The “8CP Visualisation Indicator” comes in Oceania version, London version, New York version, and AnyCP version. This time, we used the London version.
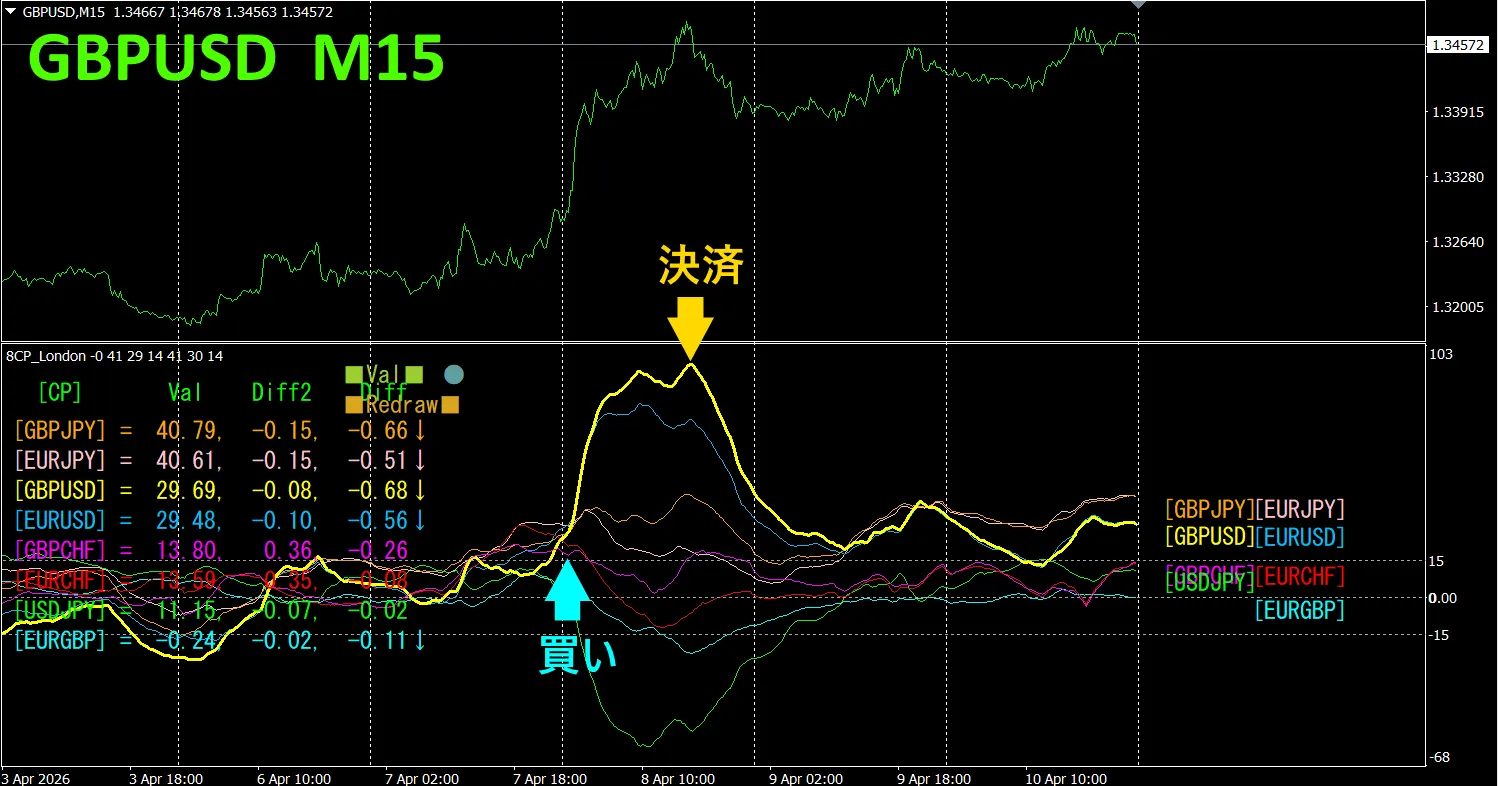
The top half is the GBPUSD 15-minute chart. The bottom half shows the “8CP Visualisation Indicator” results, where the yellow graph corresponds to GBPUSD.
On Wednesday, GBPUSD’s chart broke above the other charts’ group, so we buy. We close at the day’s high, profits were about 170 pips. The correct approach is to take only what you can, and not trade the rest.
Currency Strength/Weakness Graph
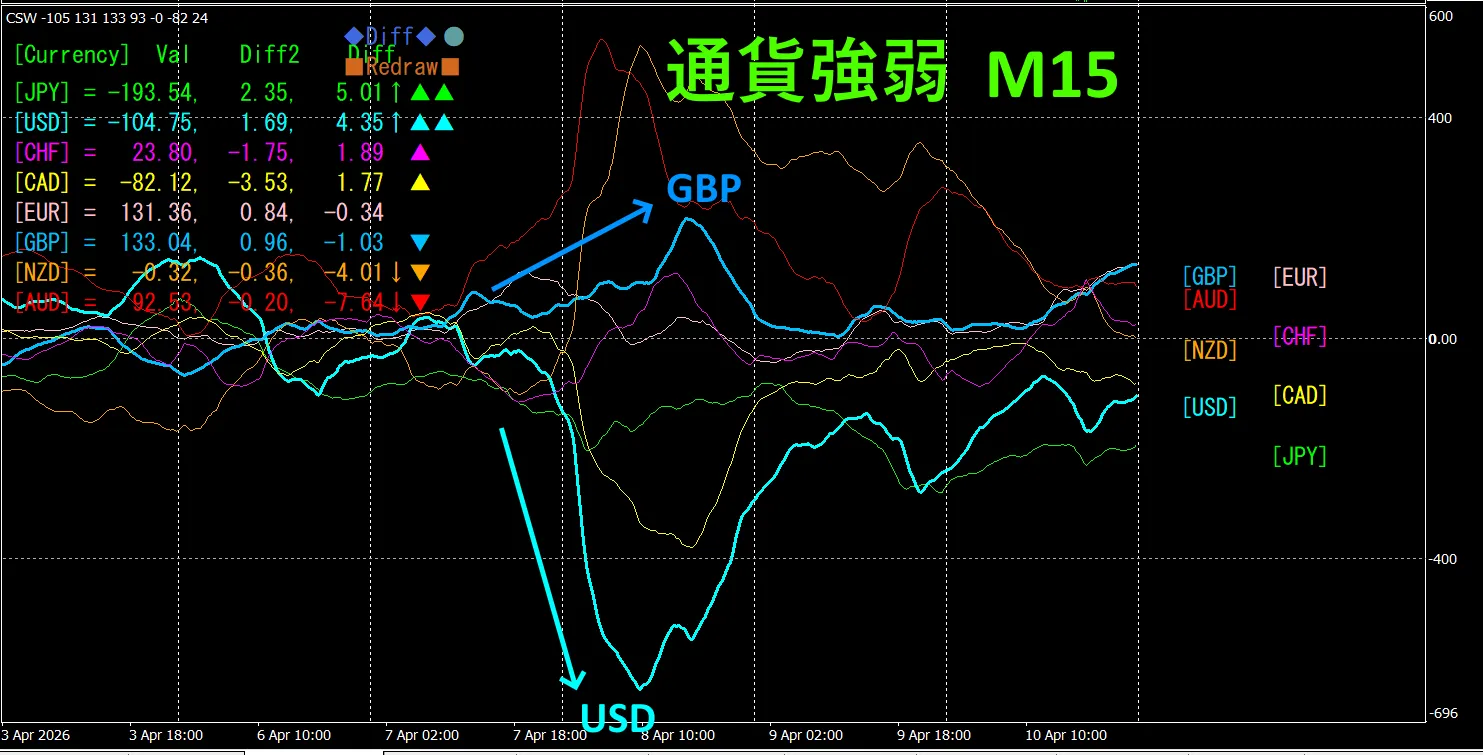
Looking at the 15-minute currency strength graph, GBP Trade only in the areas where GBP and USD are diverging. When they diverge, buy GBPUSD.
2. Try Best Select
The below image is a screenshot taken on()
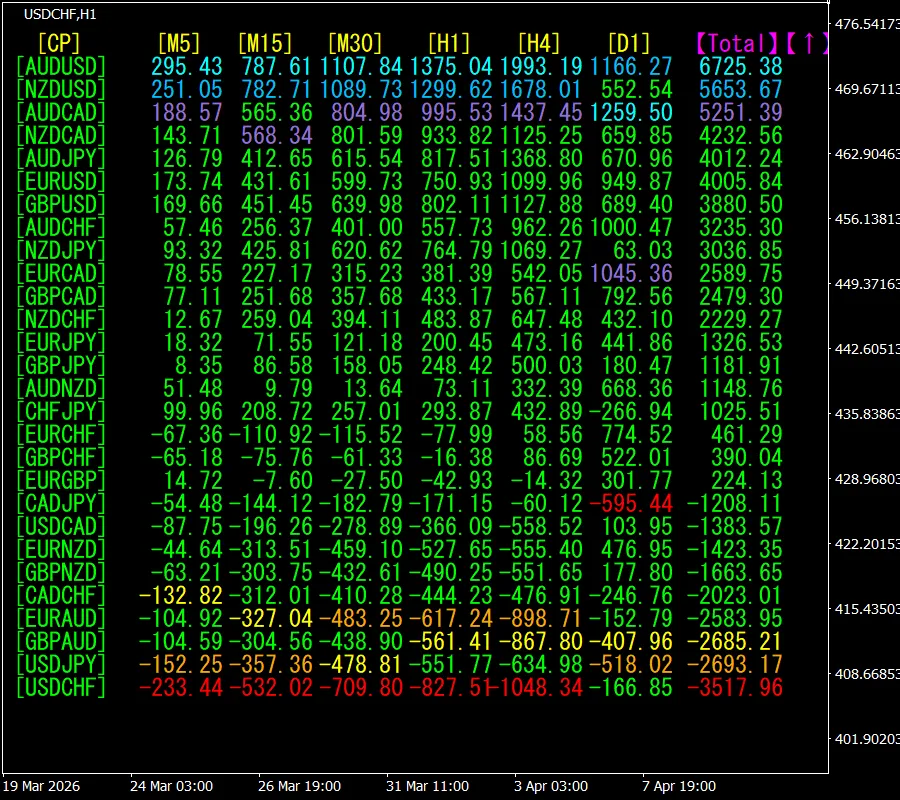
Total

3. Since May 2021 we’ve been tracking?
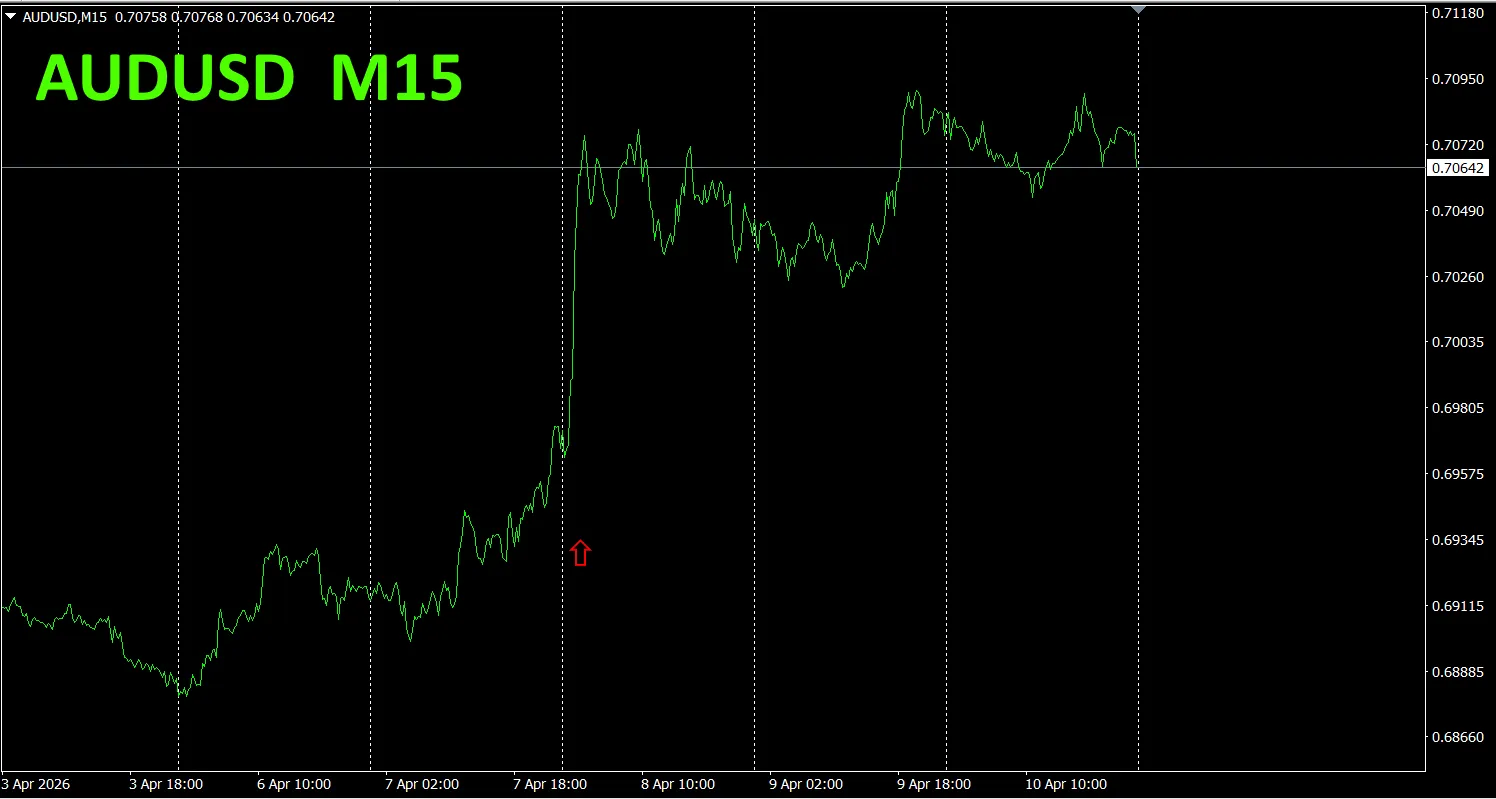
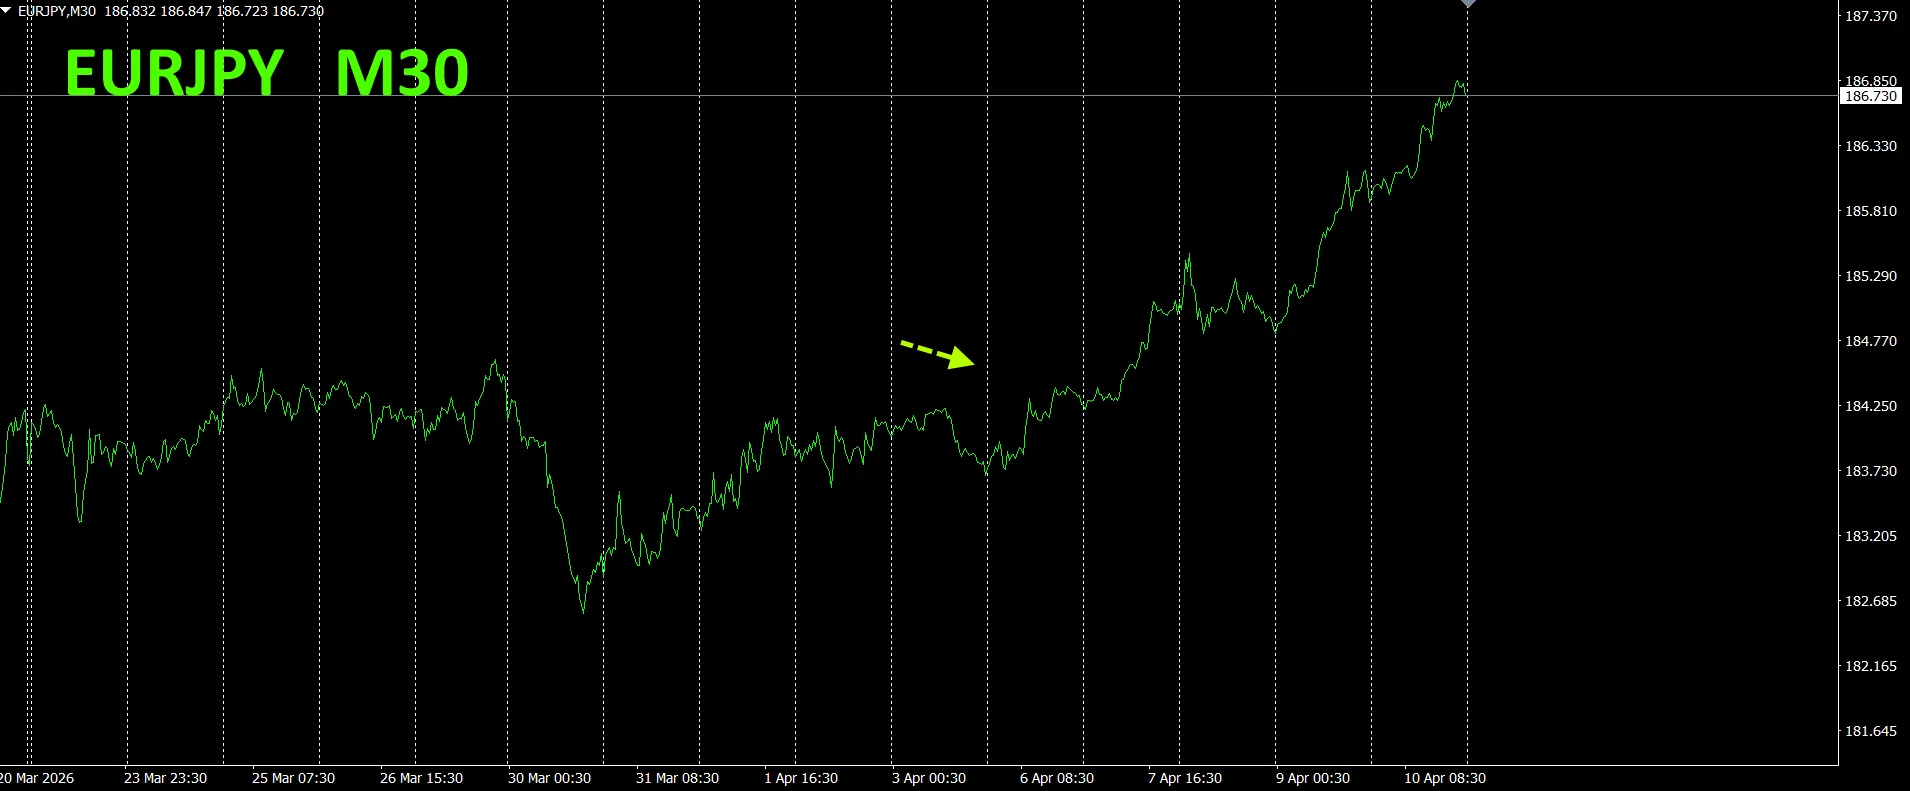
We began tracking EURJPY movement in May 2021.
To view the overall trend, we’ve drawn about the last three weeks on a 30-minute chart.
Previously we wrote as follows:
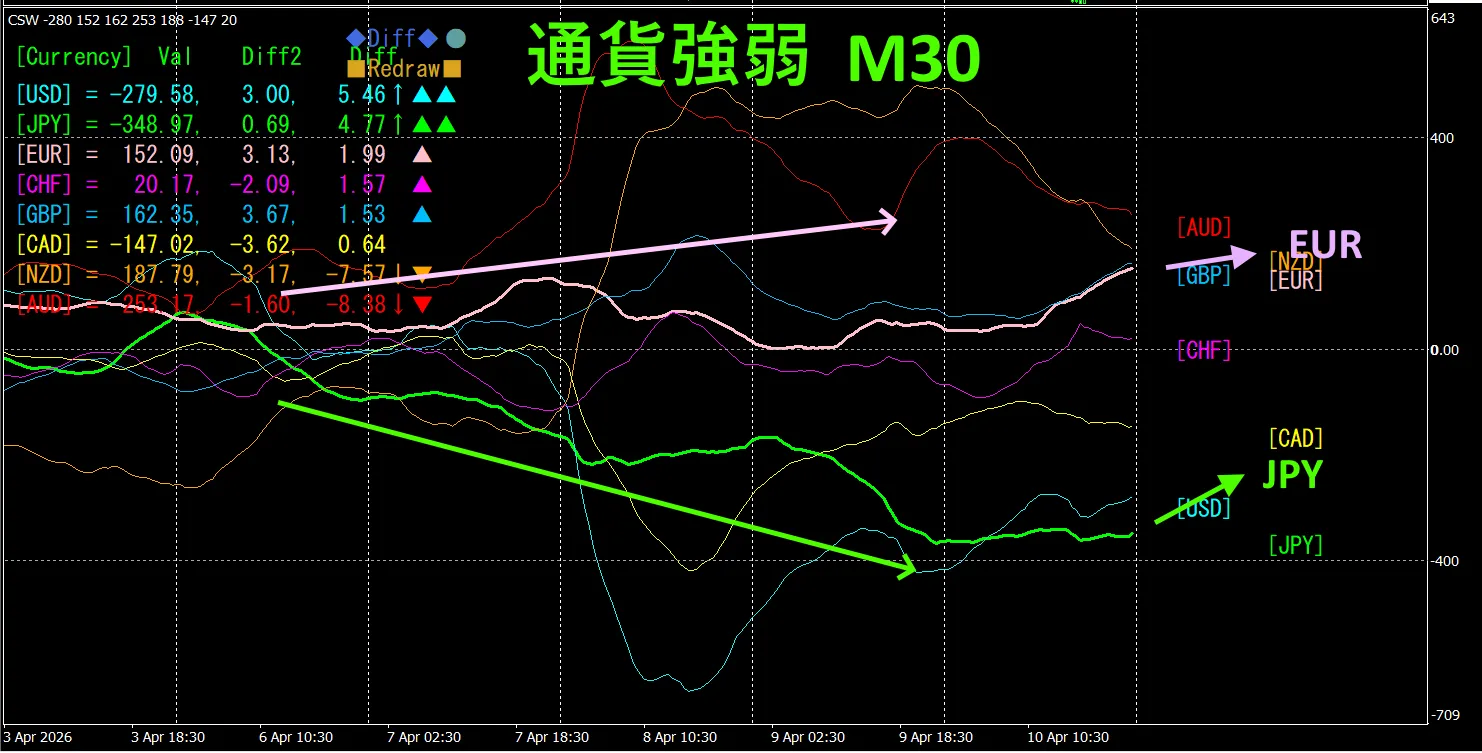
Pink is EUR, green is JPY. EUR
This time, it rose contrary to expectations. EUR was strong and JPY weak, leading to the rise.
A 30-minute currency strength chart shows that
New indicator “Dual_MACD_Trend_Indicator” is available at below.
MT4https://www.gogojungle.co.jp/tools/indicators/62199
MT5https://www.gogojungle.co.jp/tools/indicators/62202
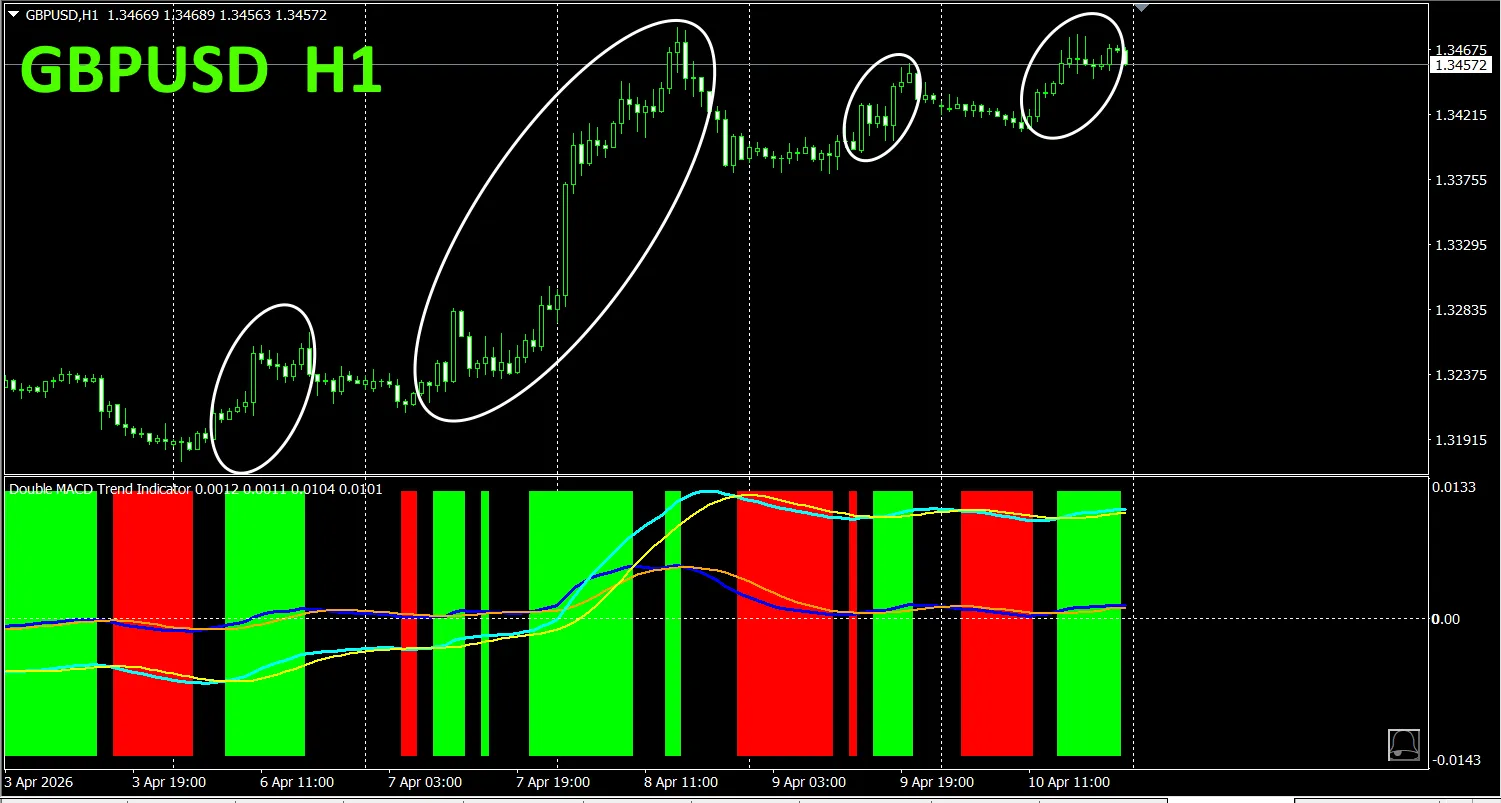
An indicator that clearly shows trend direction with color. If color bars are Lime, it’s a buy; Red, it’s a sell. Simple for beginners to use. Green bars indicate uptrend; Red bars downtrend; no color indicates no trend. The color display lets you grasp trend at a glance..
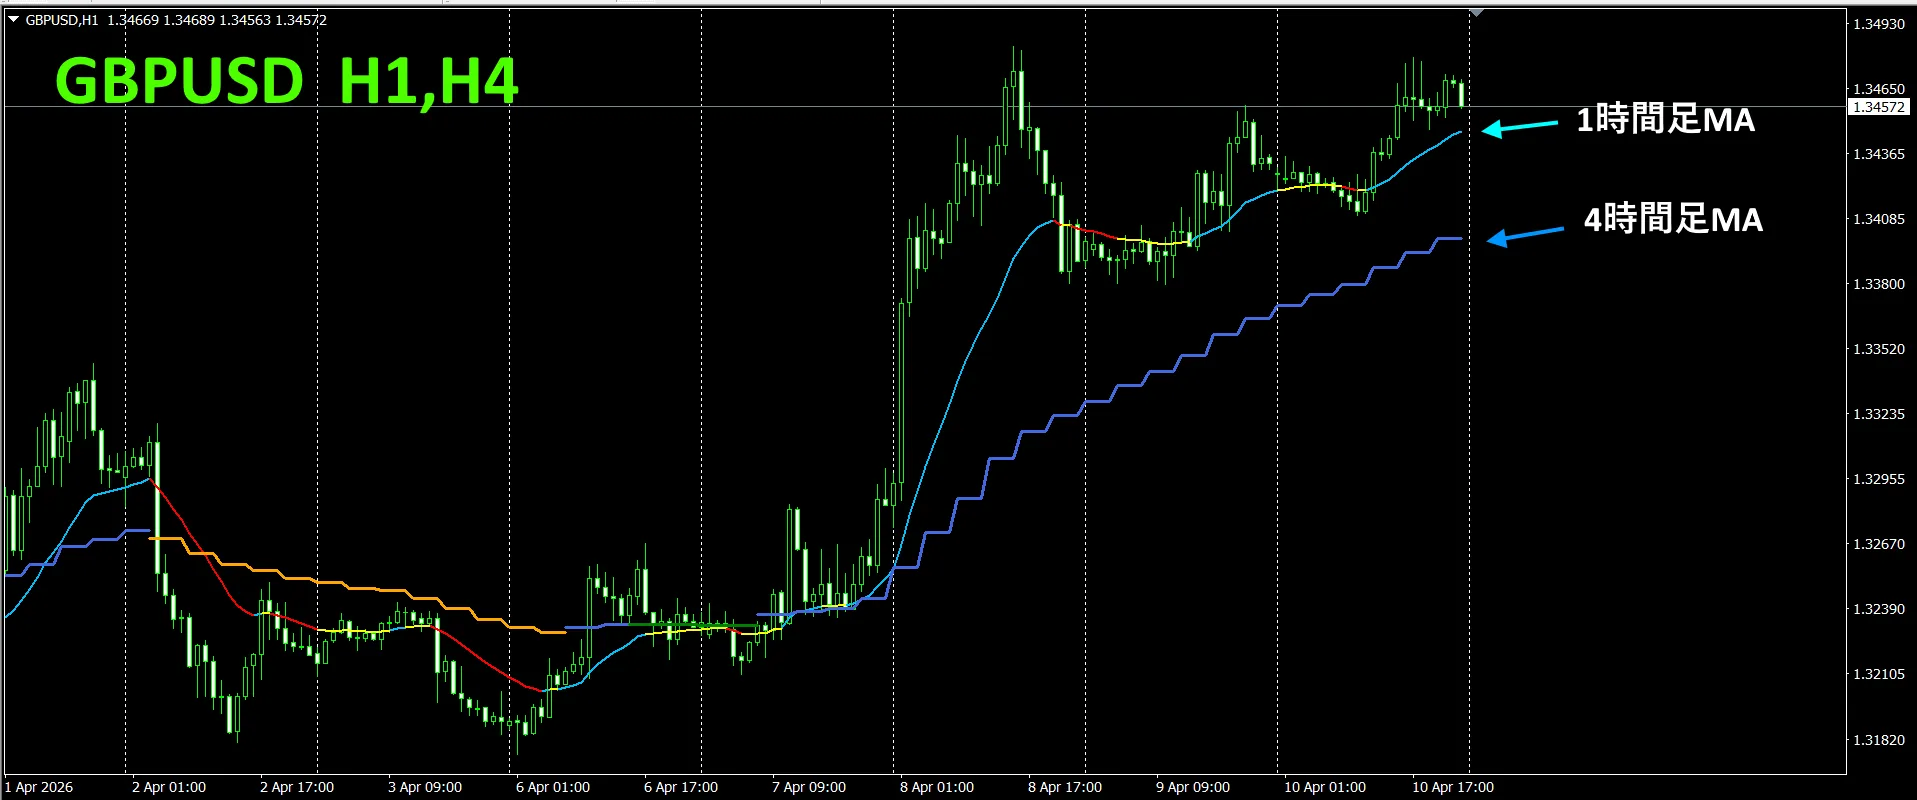
We applied this indicator to GBPUSD on the 1-hour chart.
Red indicates sell zone and green buy zone are clearly separated, making trading easy at a glance. Focus only on the white-oval area; indicator color is green, so trade only buys.
With “Dual_MACD_Trend_Indicator”,
From the sales page, “Trend_Color_MA_Dual_MTF” was developed to transform your trading. This tool is not just a moving average.
It visualizes trend direction with color and notifies you with sound and alerts when a trading opportunity arrives, becoming your personal assistant.
As an example, on GBPUSD 1-hour chart we displayed 4-hour moving averages simultaneously. The 4-hour MA forms a stair-step pattern. The 1-hour MA and the 4-hour MA are colored in blue when rising and red when falling, so you can discern the current chart trend direction and the higher-timeframe trend at a glance. If the colors of the higher and current timeframes match, trade in the color’s direction (red = sell, blue = buy).
When the 1-hour MA is red and falling, and the 4-hour MA is orange and falling, and the candles break below two moving averages, sell. When the 1-hour MA is blue and rising, and the 4-hour MA is blue and rising, and candles break above two moving averages, buy.
This is a trading strategy you can use.
For details, please see the following link..
https://www.gogojungle.co.jp/tools/indicators/75985
“8CFD Visualisation Indicator Any Version””
https://www.gogojungle.co.jp/tools/indicators/32288
“Toreto Indicator”
“TrendLine-EX”

https://www.gogojungle.co.jp/tools/indicators/42257
“8 Currency Strength Visualisation Indicator”
MT4 https://www.gogojungle.co.jp/tools/indicators/39150

MT5 https://www.gogojungle.co.jp/tools/indicators/39159
【


