

Bitcoin (BTC/USD) Market Analysis (Thursday, April 9, 2026)
0
Key Points
- The daily chart has clearly broken above the descending trendline, signaling a strong return to an uptrend structure.
- Currently in a short-term pullback phase: after the sharp rally, lower timeframes (1H / 4H) are showing a temporary correction due to overextension.
- Key support level: Around 65,187, acting as a crucial mid-to-long-term support.
- Range dynamics: Price is currently trading around $70,000, with strong resistance near $72,000.
Market Environment
From a mid-to-long-term perspective, the bias is slightly bearish.
However, after breaking the trendline, the market is forming a pullback.
Within the current range, the structure is trending upward.
If the lower timeframe selling pressure subsides, long positions become favorable.
Daily Chart Analysis
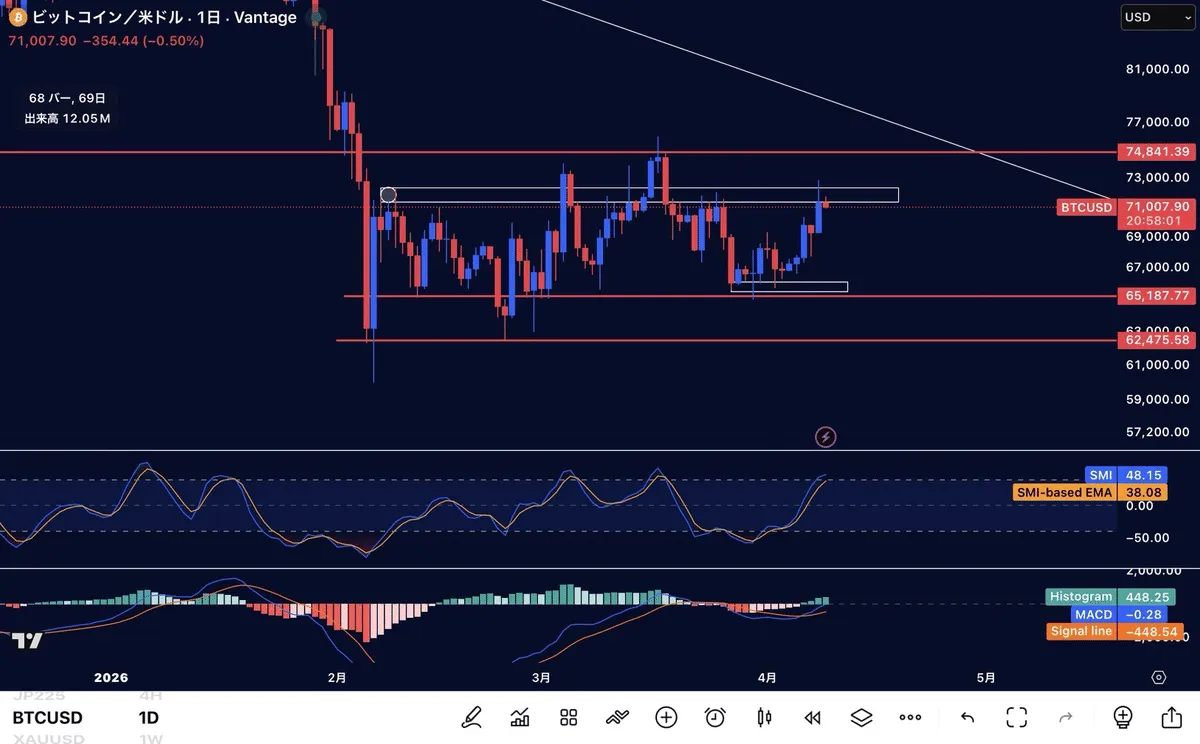
① Trend
- Breakout of the descending trendline confirms a shift to an uptrend.
- Resistance at 74,841, support at 65,187.
- Currently testing the upper boundary of the range.
② Indicators
- MACD: Expanding in positive territory, indicating bullish momentum.
- SMI: Holding above EMA, suggesting continued upward momentum.
4H Chart Analysis
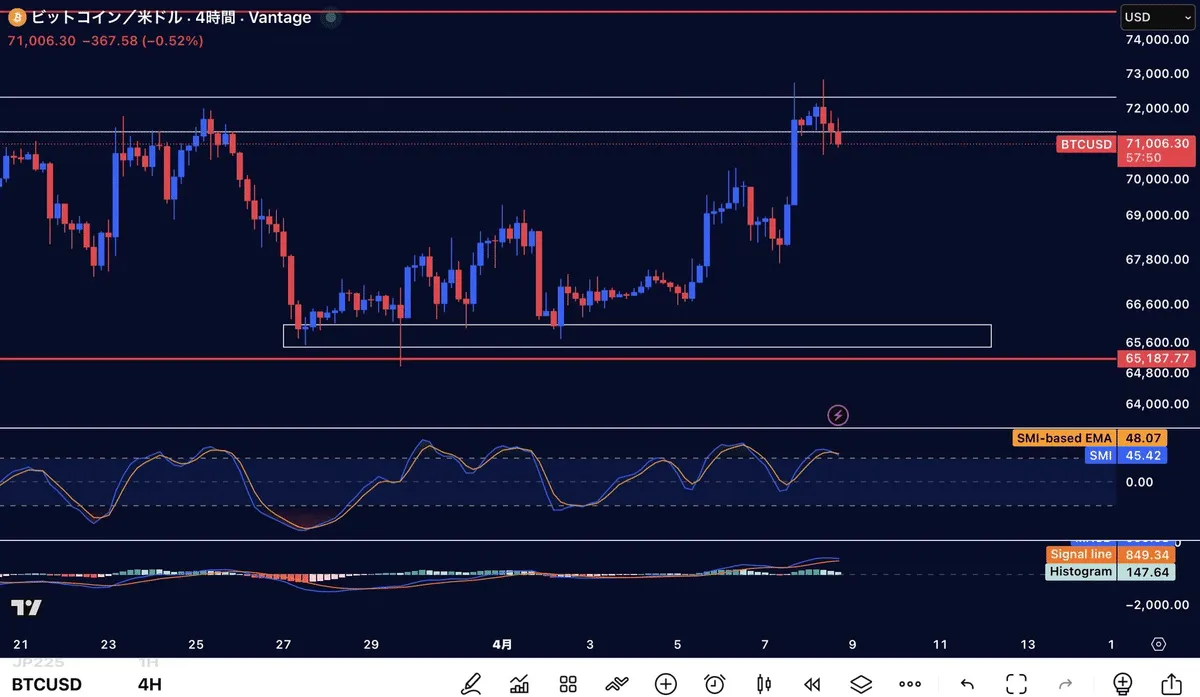
① Trend
- Price is capped around 72,000, forming a range near the highs.
- Currently in a pullback phase, waiting to identify the support zone.
② Indicators
- MACD: Still in positive territory but contracting, indicating weakening momentum.
- SMI: Showing a bearish crossover, suggesting ongoing correction.
1H Chart Analysis
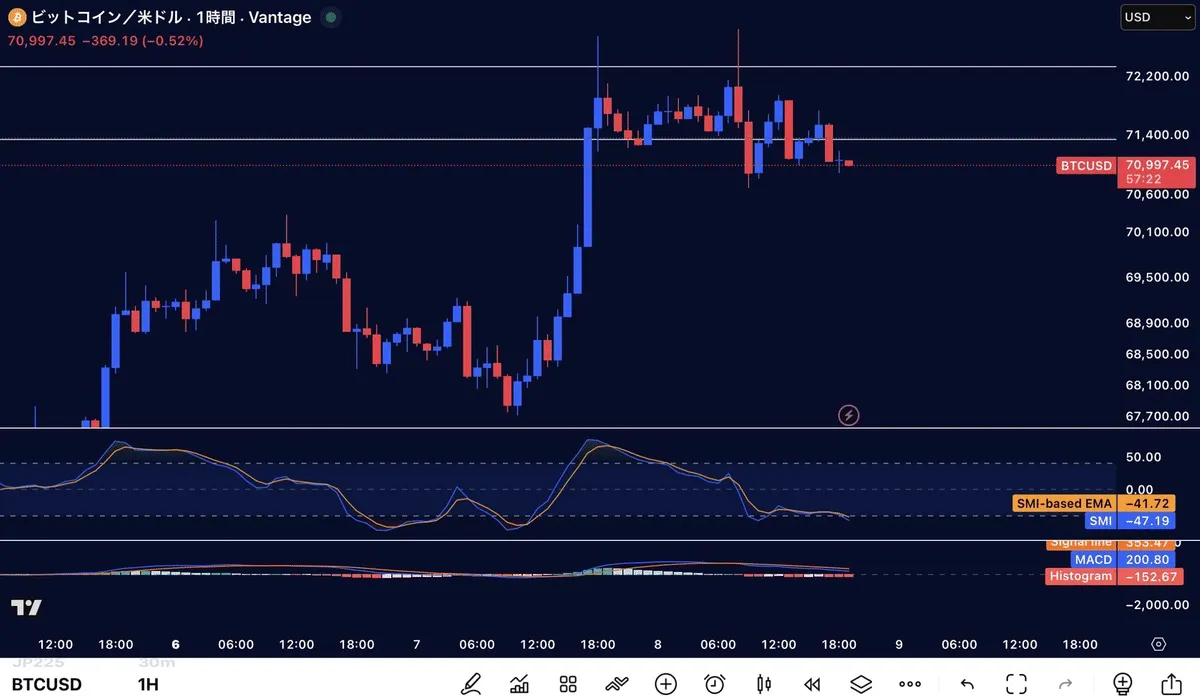
① Trend
- Short-term downtrend forming within a broader range.
- Price hovering around 71,000, testing support levels.
② Indicators
- MACD: Bearish crossover, in negative territory, indicating selling pressure.
- SMI: Staying in negative territory, suggesting continued bearish momentum.
→ Awaiting signs of reversal.
× ![]()