

【Gold and USD/JPY are negatively correlated】The reason why displaying them side by side alone improves trading accuracy
Gold (XAUUSD) and Dollar/Yen (USDJPY). How many traders display these two instruments simultaneously?
I think most people view them separately as “Gold is Gold, Dollar/Yen is Dollar/Yen.”
But in fact, just by placing these two side by side, trading accuracy can improve dramatically.
Gold and Dollar/Yen are basically inversely correlated
Gold and the Dollar/Yen generally move in opposite directions.
Dollar/Yen goes up (Dollar strengthens) → Gold goes down Dollar/Yen goes down (Dollar weakens) → Gold goes up
This is because Gold is traded in dollars. When the dollar strengthens, Gold becomes relatively cheaper, and when the dollar weakens, Gold becomes more expensive.
Of course, it’s not always a perfect inverse correlation. In times of geopolitical risk or risk-off environments, both Gold and the dollar can be bought simultaneously. But in normal market conditions, the inverse correlation is active in many situations.
How to apply the inverse correlation to trading
Here is an example scenario.
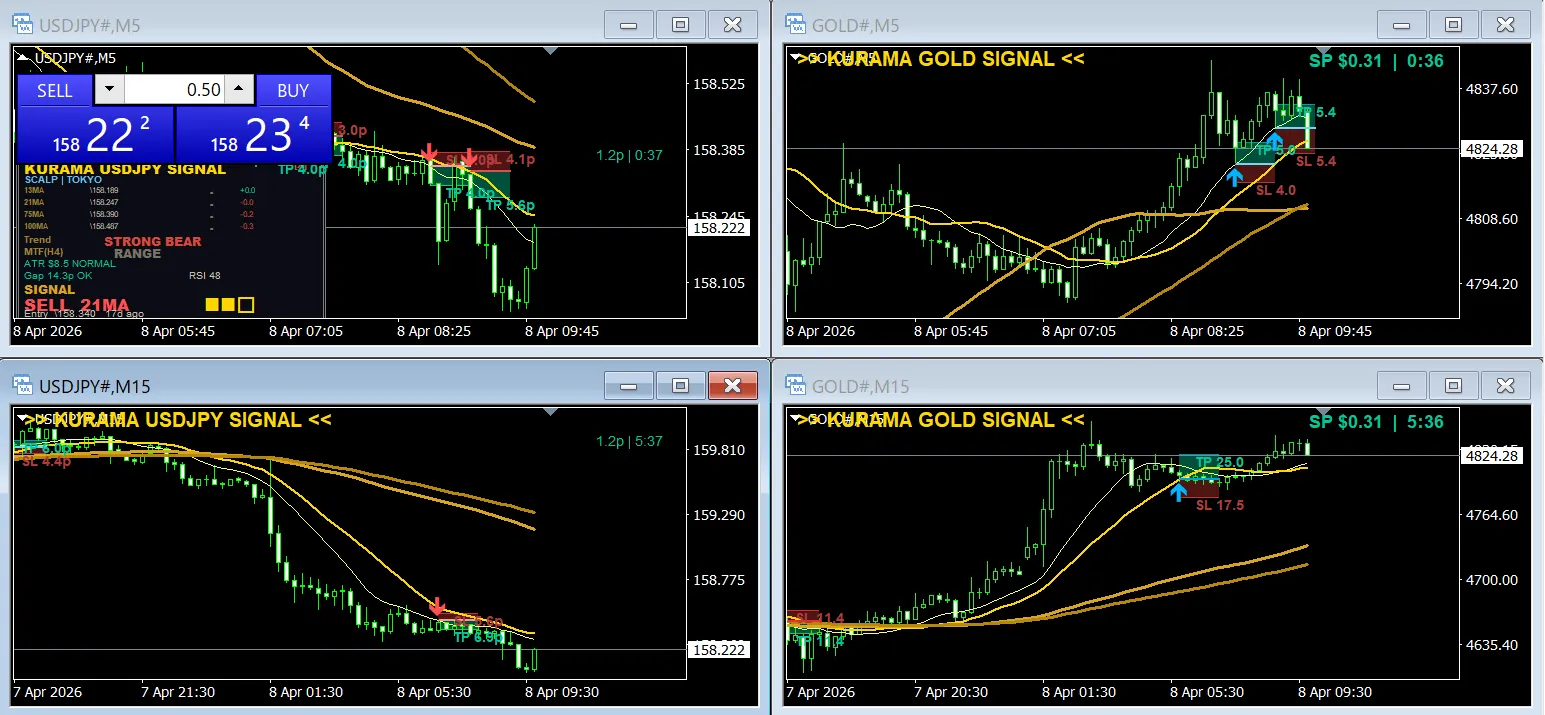
On the USDJPY M5 chart, a SELL signal appears. At the same time, on the Gold M5 chart, a BUY signal appears.
Dollar/Yen is falling = Dollar is weakening. Gold is rising = Dollar is weakening.The directions are aligned.
In this case, the rationale for a dollar-weak signal is confirmed by two instruments simultaneously. It’s more reliable than a signal from just one instrument.
Conversely, if the USDJPY shows a SELL signal and Gold also shows a SELL signal, the directions conflict. It’s better to skip such a setup.
**Enter only when the directions of both instruments align.** This alone reduces unnecessary losses.
Displaying M5 and M15 on four screens
This is my actual trading screen.
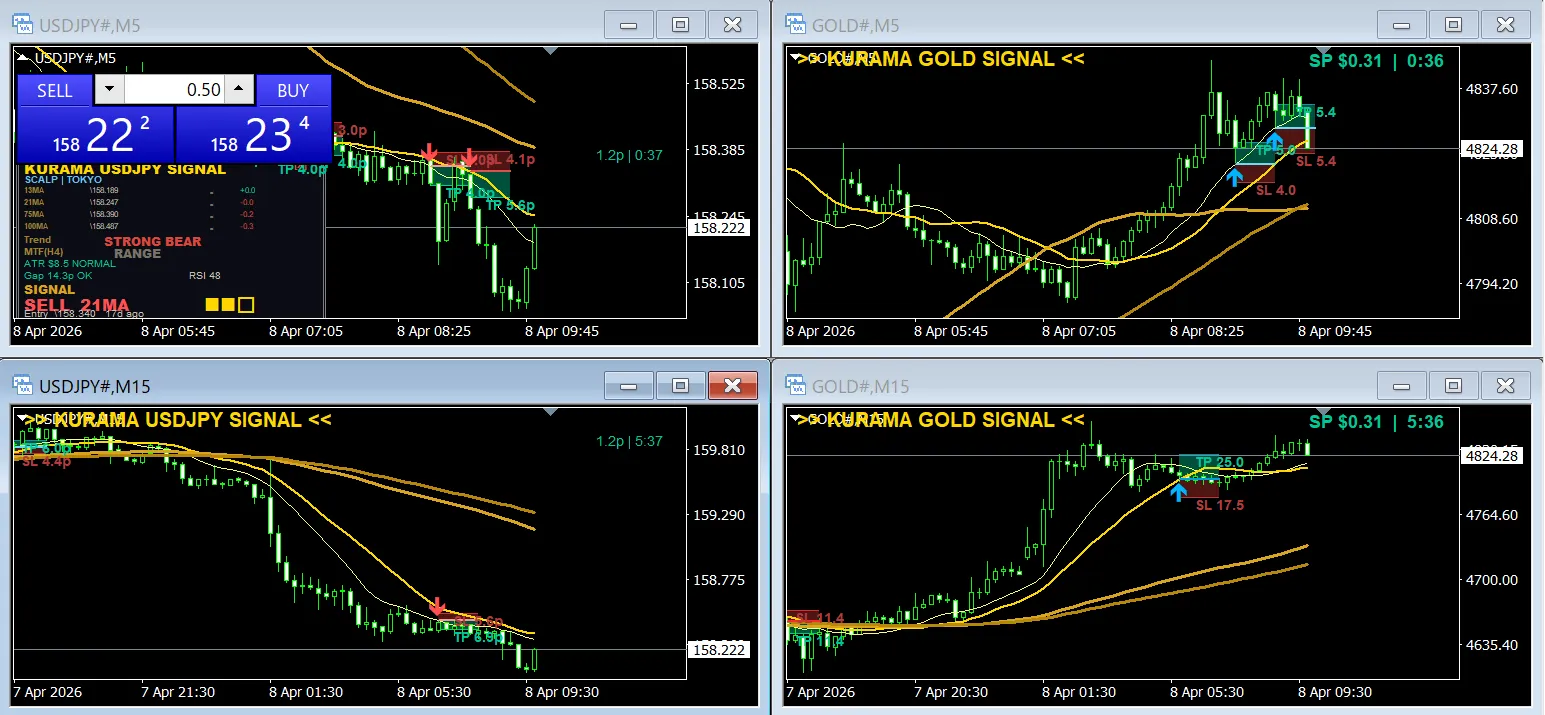
Top left: USDJPY M5 (KURAMA USDJPY SIGNAL) Bottom left: USDJPY M15 (KURAMA USDJPY SIGNAL) Top right: Gold M5 (KURAMA GOLD SIGNAL) Bottom right: Gold M15 (KURAMA GOLD SIGNAL)
By lining up these four screens, you can see at a glance:
- The short-term (M5) and mid-term (M15) directions for USDJPY
- The short-term (M5) and mid-term (M15) directions for Gold
- Whether the two instruments’ directions align
- Which instrument is giving a signal
You don’t need to follow every signal. **Enter only when the four-screen directions align.** This yields the highest accuracy.
Timeframe complementary ability
Gold and Dollar/Yen move in different timeframes.
Tokyo time is dominated by USDJPY. Gold moves slowly. London to New York time is gold-dominant. USDJPY also moves, but Gold shows larger volatility.
In other words,If you’re only watching one, you’re missing half of the daily opportunities.
If you display both KGS and KUS, you can enter on USDJPY signals during Tokyo hours and on Gold signals after London. You won’t have gaps in opportunities throughout the day.
Be careful when inverse correlation breaks down
Usually inverse-correlated Gold and USDJPY begin moving in the same direction. That’s a signal that something unusual is happening in the market.
During risk-off periods when both the yen and Gold are being bought, or during headlines where everything is temporarily sold off—in such scenarios, it’s better not to force entries.
A breakdown of inverse correlation means the normal environment isn’t present. If you display KGS and KUS side by side, you’ll quickly notice this anomaly. Recognizing it helps you avoid unnecessary losses.
If you buy the set, you save
KGS (Gold-only) and KUS (Dollar/Yen-only) are available as a set at a discounted price.
KGS standalone ……… ¥24,800
KUS standalone ……… ¥19,800
Subtotal ……… ¥44,600 ★
Set price … ¥39,800 (¥4,800 OFF)
? See the set here →https://www.gogojungle.co.jp/tools/ebooks/77857?via=users_products