
Bitcoin (BTC/USD) Market Analysis (Thursday, April 9, 2026)
If this is helpful, please give it a like.
The product is here
https://www.gogojungle.co.jp/tools/ebooks/67002
Overall points
• Clear breakout above the daily downtrend line, with a pronounced return to an uptrend. Maintains a strong shape.
• Short-term correction (pullback) phase: After a sharp rise, there is a temporary decline on the 1-hour and 4-hour charts as part of a correction from overheating.
• Support line: Around 65,187 functions as an important medium- to long-term support.
• Range battles: Currently trading near $70,000, with the upper area around $72,000 acting as resistance.
Market environment
Medium-to-long term is slightly bearish. After the trendline break, a pullback is forming, and it is currently in an upward range within the range. If the lower-timeframe declines stabilize, longs will be favored.
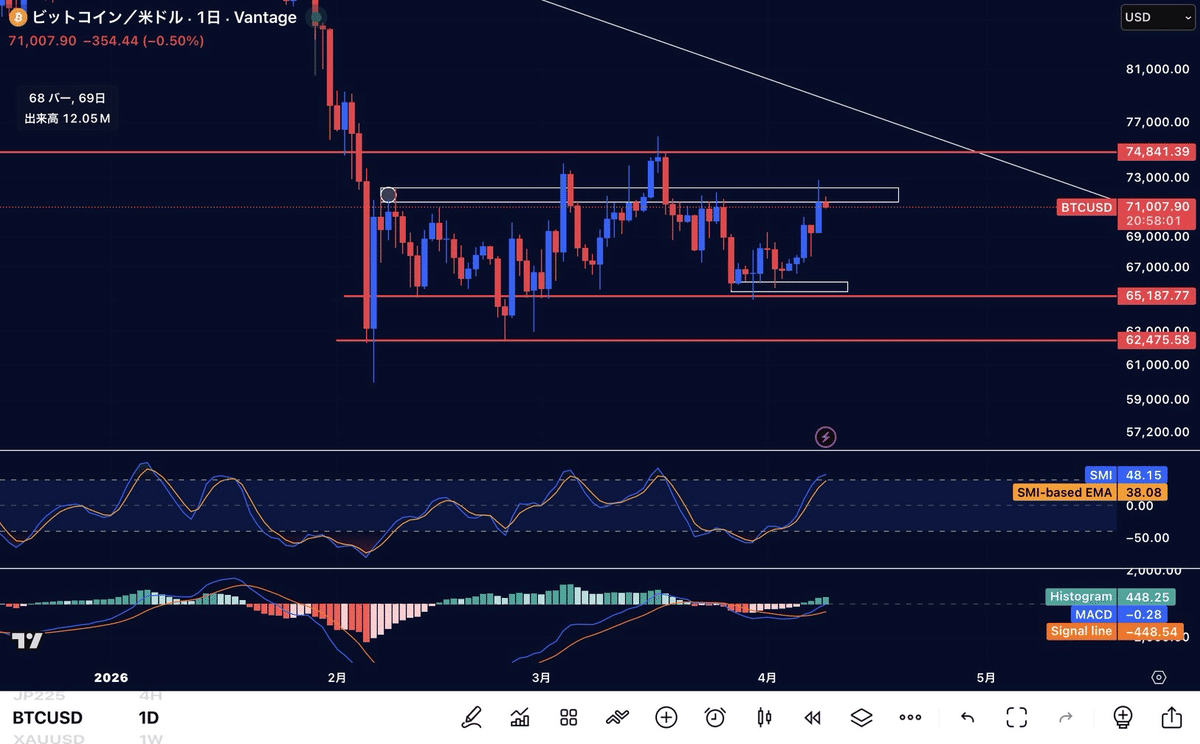
Daily chart analysis
① Trend
• Break of the trendline and transition to an uptrend.
• Upper target around 74,841, lower target around 65,187 as support. The price is testing the upper boundary of the range.
② Indicators
• MACD: expanding in positive territory. Upward momentum.
• SMI: remaining above the EMA, with continued upward momentum.
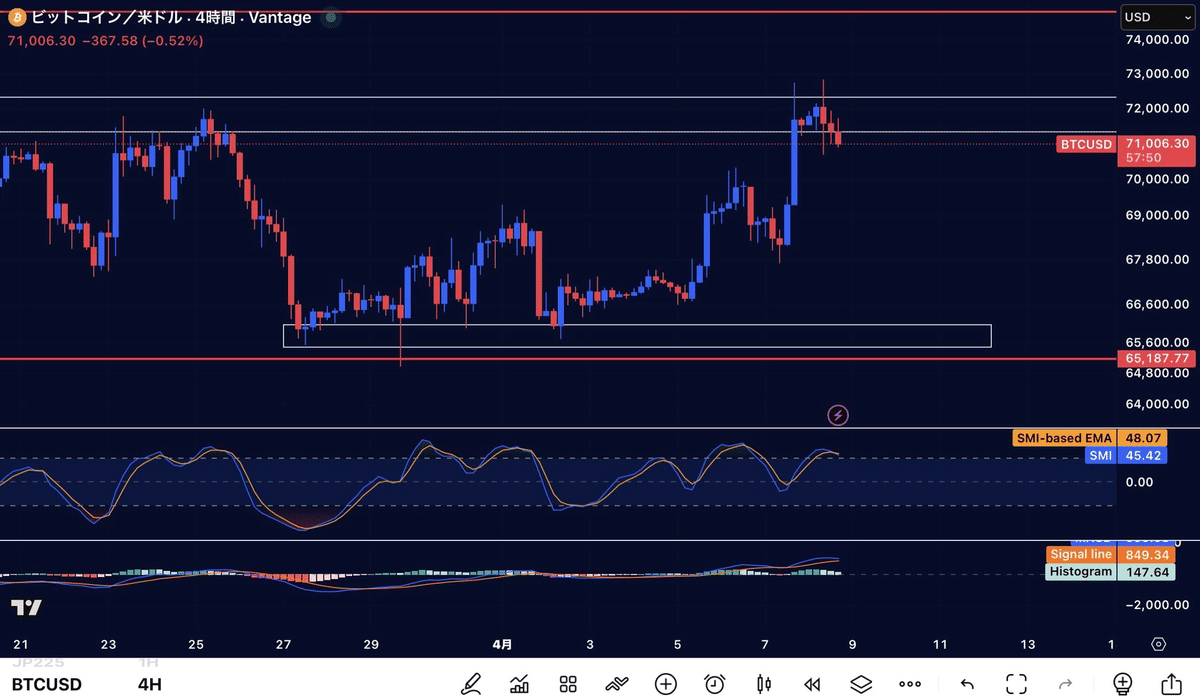
4-hour chart analysis
① Trend
• Upper limit around 72,000 is capping upside, with a range-like correction at higher prices.
• Pullback forming; watching where it finds support.
② Indicators
• MACD: still in positive territory but converging, momentum waning.
• SMI: appears to have a dead cross and is turning downward, suggesting continuation of a correction.
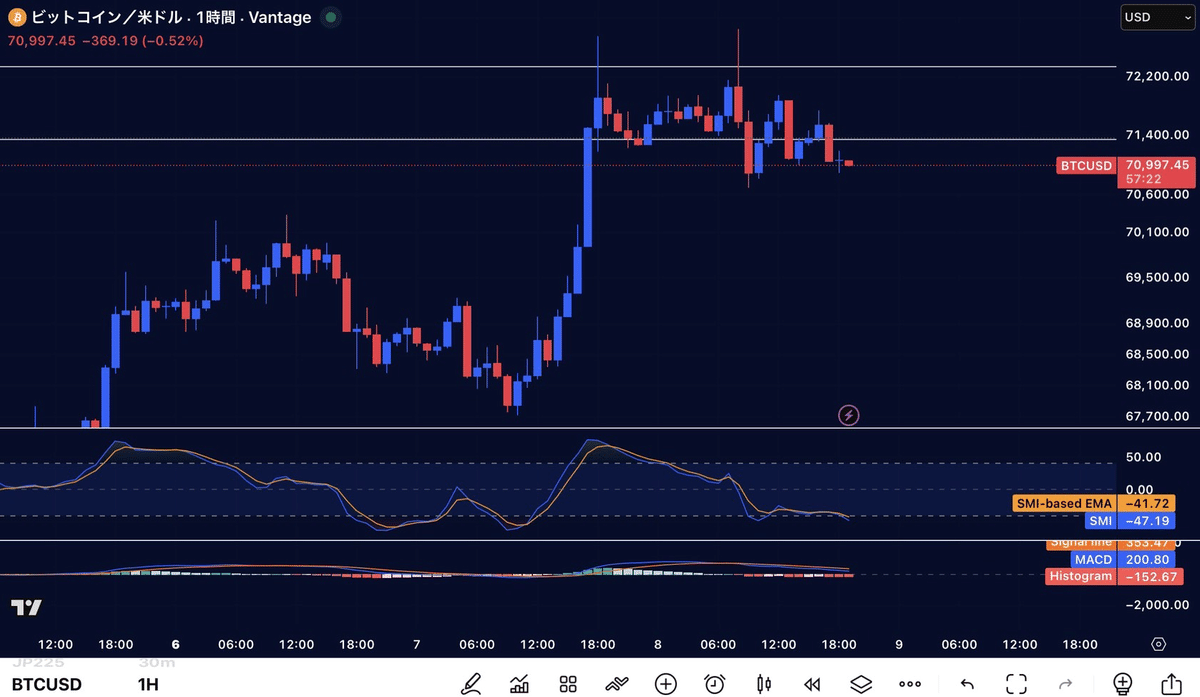
1-hour chart analysis
① Trend
• In the short term, a downtrend is forming while a range-bound downward adjustment occurs.
• Trading near 71,000, testing the support.
② Indicators
• MACD: dead cross, selling pressure dominating in negative territory.
• SMI: negative territory, continuing downward momentum. Waiting for a reversal.