

[Free・Daily Chart Environment Recognition] April 9・ USDJPY・ EURAUD
【Free・Daily Chart Environment Recognition】April 9 USDJPY・EURAUD


I want to learn how to recognize the environment

What method does Shirou-san use for environment recognition?
For those who are wondering, this article will perform environment recognition for USDJPY and EURAUD.
Notes
【Limited Content・Daily Chart Environment Recognition】April 9 USDJPY
USDJPY, at this pointShort bias. (MT4 0:00)
Let’s look at them one by one
① Indicator
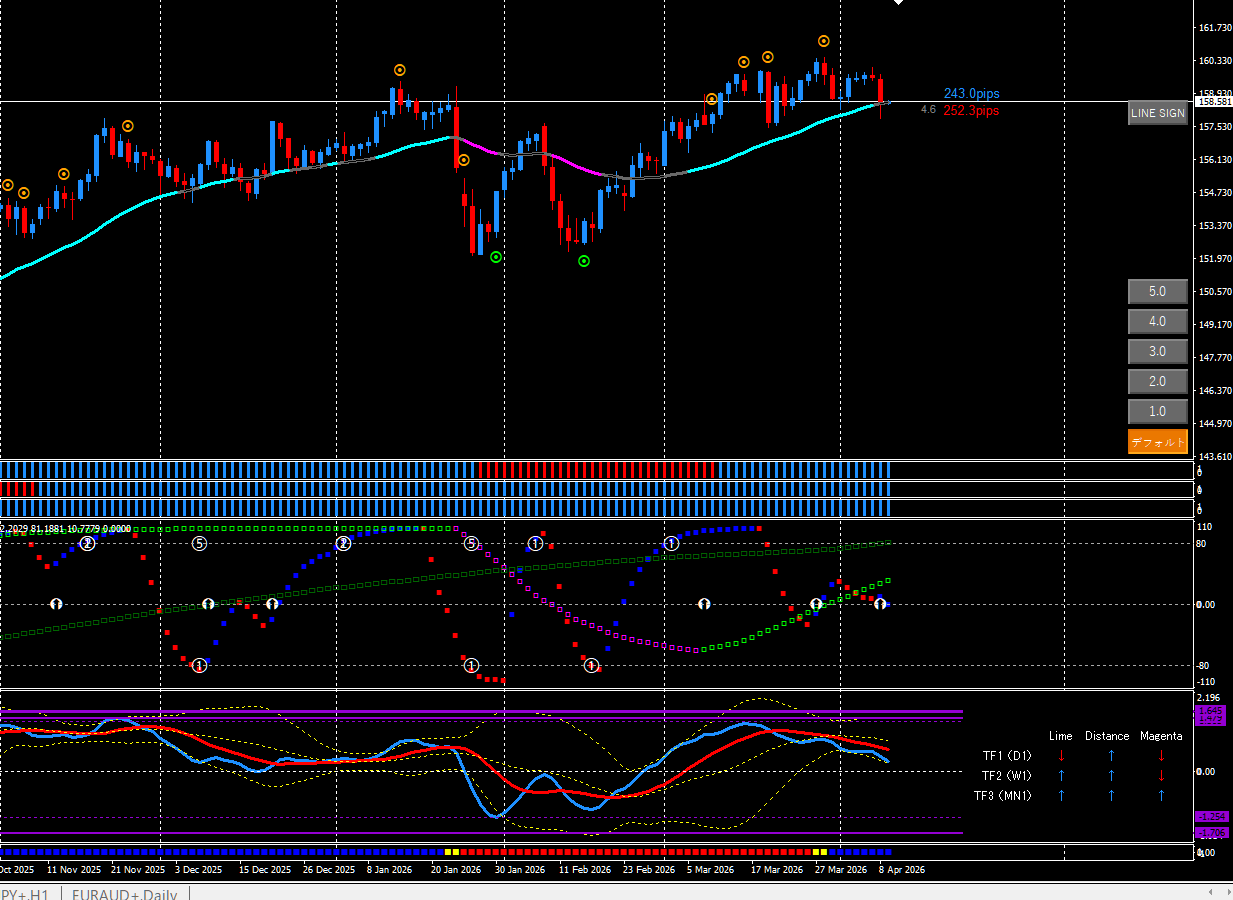
As usual, I will list the indicators’ states one by one.
- Histogram completely blue ↑
- Oscillator TF1 ↑ in all directions
- Oscillator DX Lime orientation ↓
- Current of the Oscillator Lime ↓
- Histogram DX ↑
- Heaven and Earth dots ↓
The indicators are in a conflicting state.
② Candlesticks
Next, the candlesticks.

Candlesticks are formed when the dot appears and touches the line.
The candlestick condition is a timing to wait for now.
Indicators and Candlesticks Points
First, the indicators’ points.

The oscillator is confirmed in all directions, but the oscillator DX is downward.
The movement of the Oscillator DX Lime is the fastest, so for now I’m following the direction of Oscillator DX Lime for a short bias.
However, the indicator directions are quite confused, so I wouldn’t enter in my case.
Candlestick points.
Candlestick touched the line, sowe are in a waiting state until a sense of direction emerges.
There are few grounds to trade on the 1-hour chart.
【Limited Content・Daily Chart Environment Recognition】April 9 EURAUD
EURAUD, at this pointShort bias.
Indicator
We will look at the indicators’ states one by one.
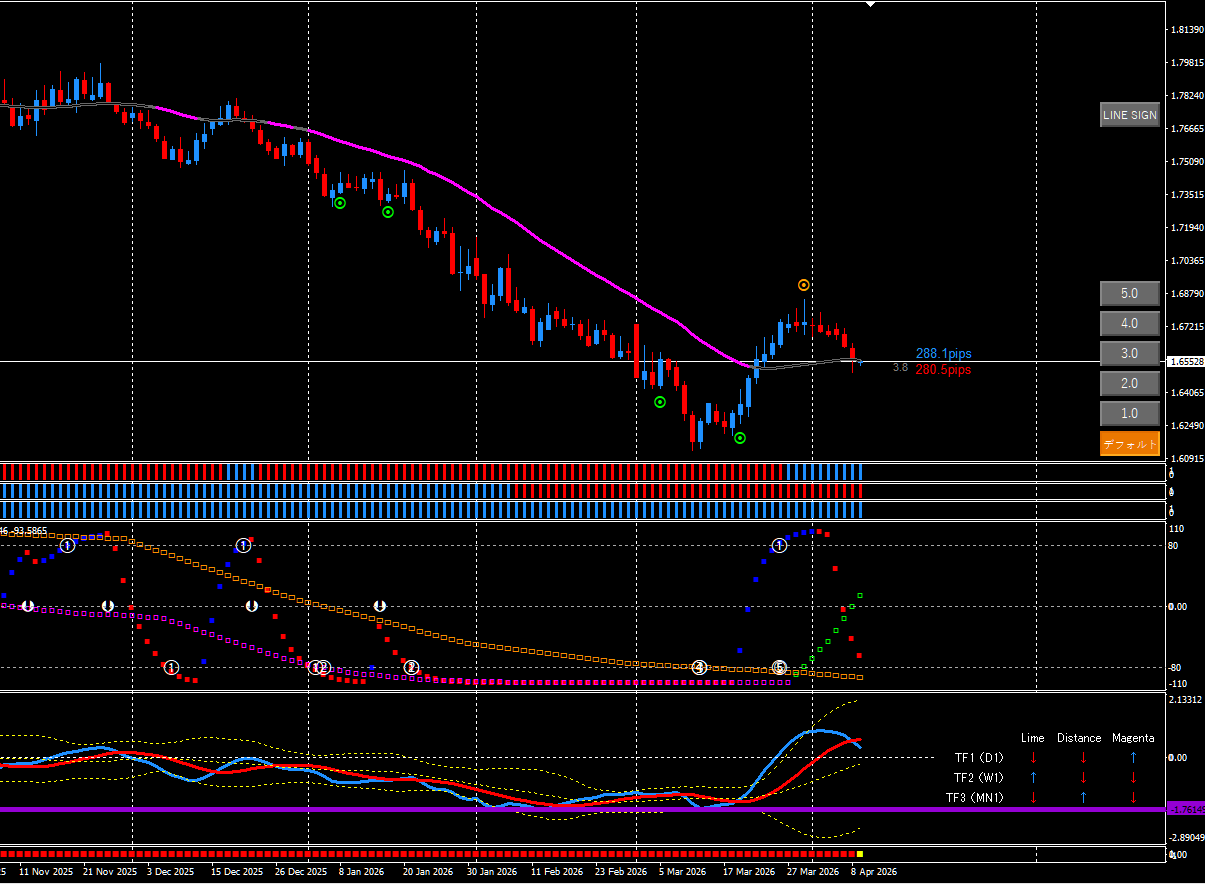
- Histogram current ↑
- Oscillator TF1 current ↓
- Oscillator DX Lime ↓
- Oscillator Lime current ↓
- Histogram DX ↓ undecided
- Heaven and Earth dots ↓
Rather, there are more cases ofshort bias.
Candlesticks
There are short points appearing and touching the line.
- Waiting state
Indicators and Candlesticks Points
First, the indicators.

Oscillator DX is crossing downward cleanly, so it’s stilla valid downward scenario.
Note that the weekly chart is showing a rising cross.
Indicators may clash and lose direction temporarily.
Candlestick points.
Touch from the point toward the line.
Because the Oscillator DX cross is strong, I’m temporarily bearish.
Summary

Dollar/Yen is honestly a difficult market to understand.
It looks like a retrace of an uptrend and also, after forming a triple top, may descend.
For now, we wait.
After about an hour from the London session, I think a direction becomes clearer.
EURAUD is likely to decline due to strong Oscillator DX justification.
However, since it has touched the line as well,
even if a short signal appears now, it’s better not to enter yet
.
Again, the best is to wait for about an hour after the London session.
Also, please pay careful attention to economic indicators (I look at Minkabu) and breaking news.