

Gold Analysis on 2026/04/07
Daily chart was a bullish belt and road? Actually "同時線" typically refers to a doji or simultaneous line; here it seems to indicate a neutral candle pattern. Range signals
【Outlook】
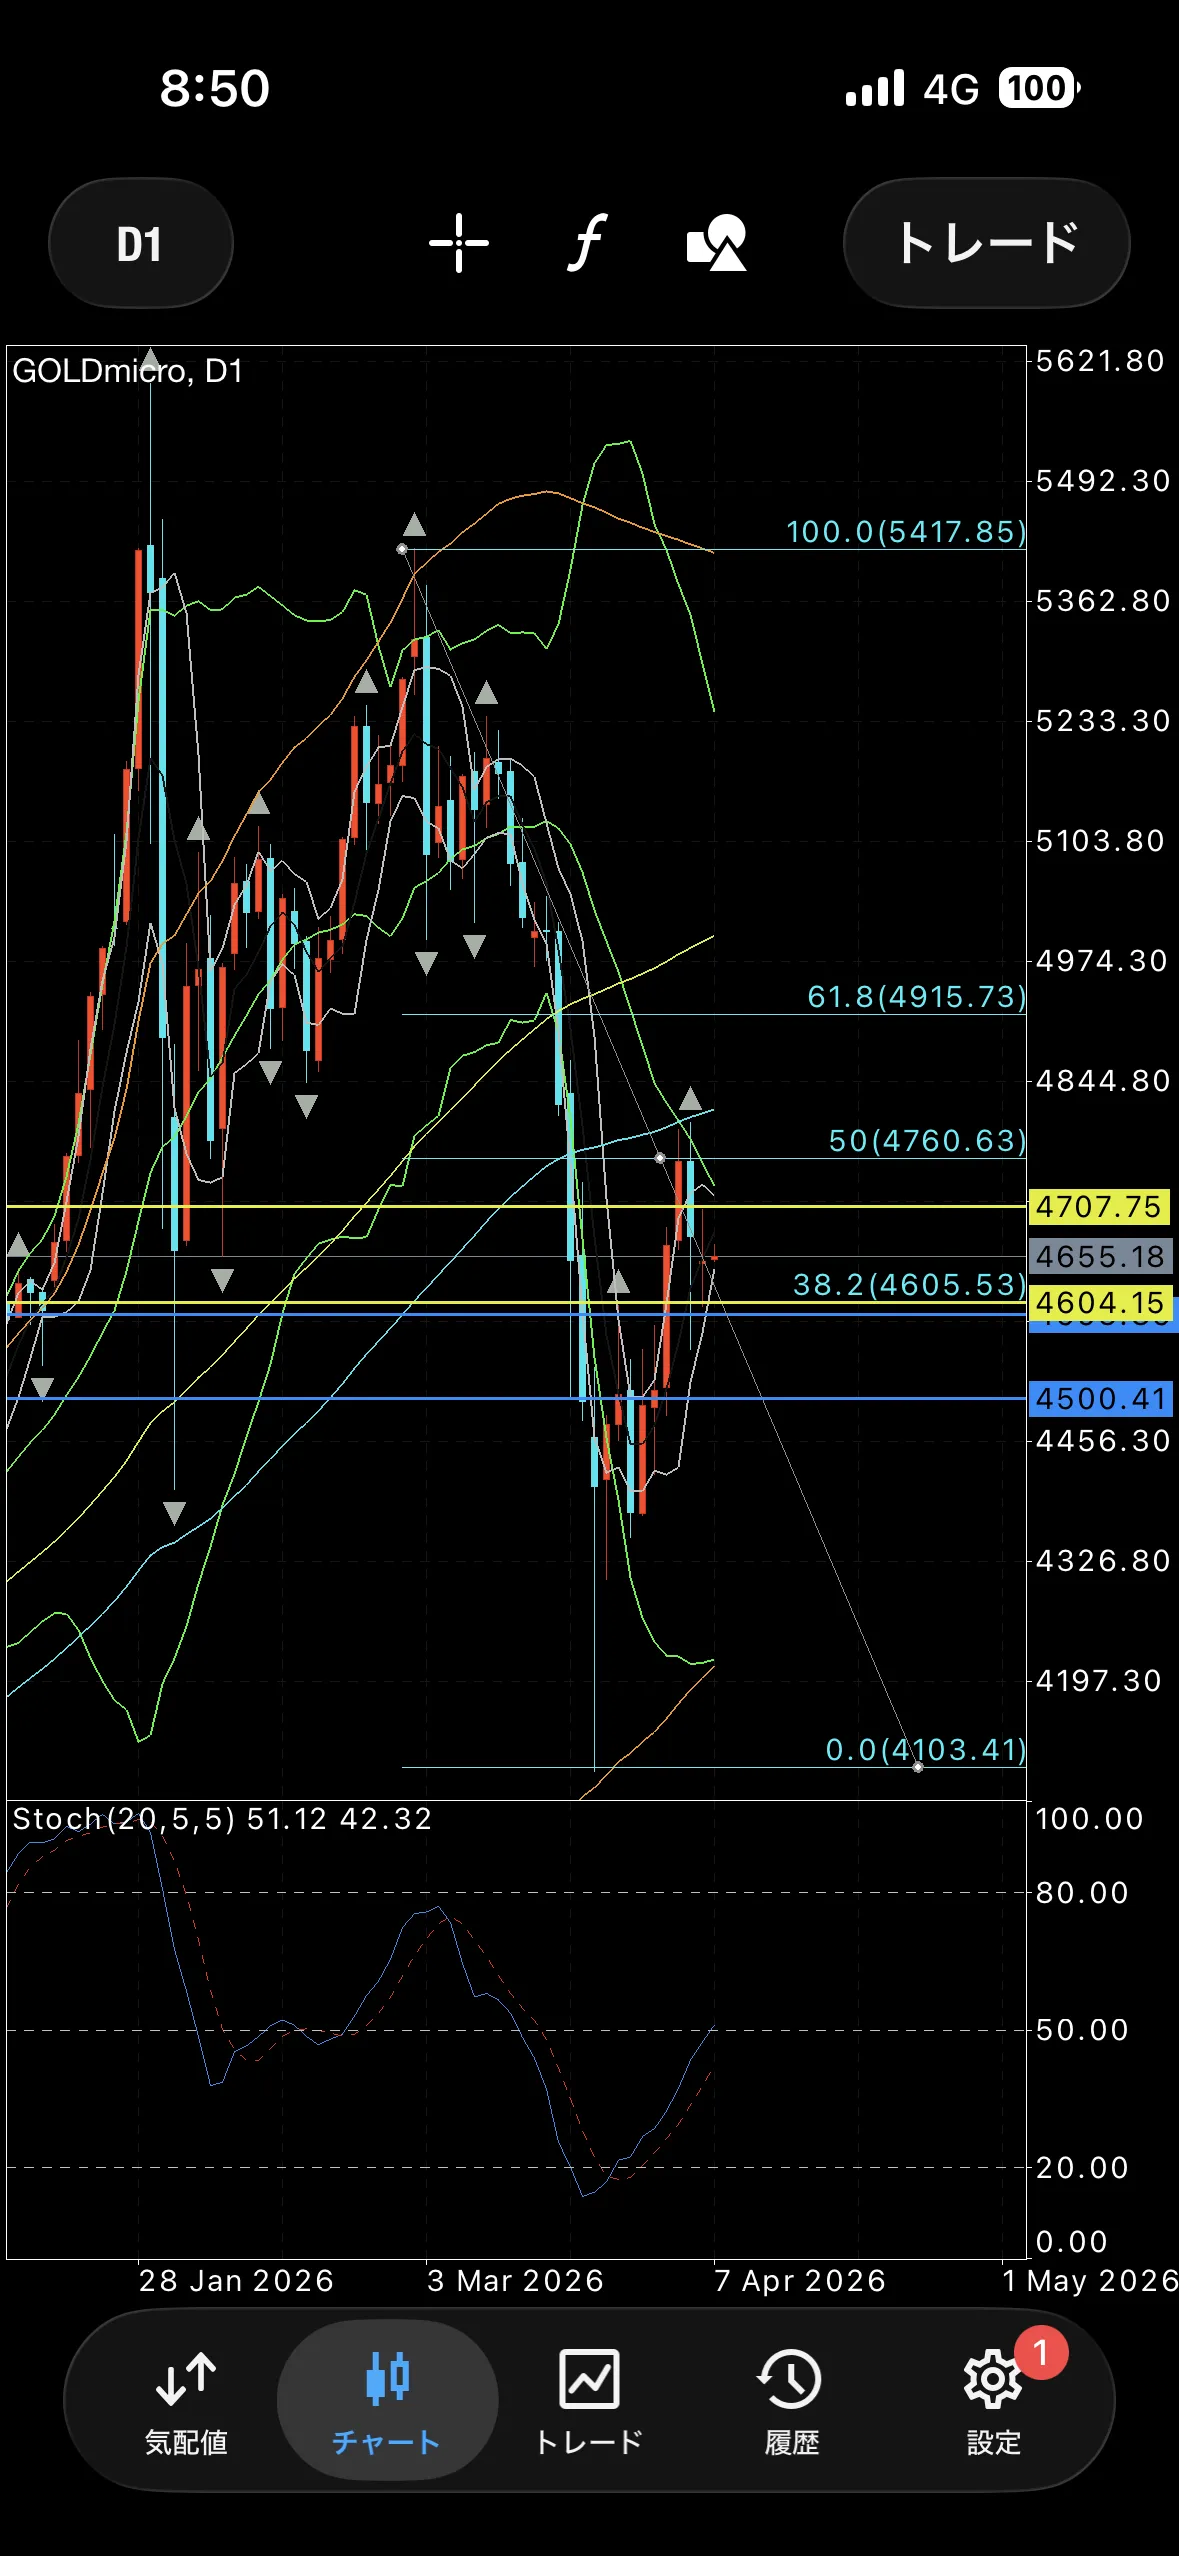
Daily chart ↓
4-hour ↓
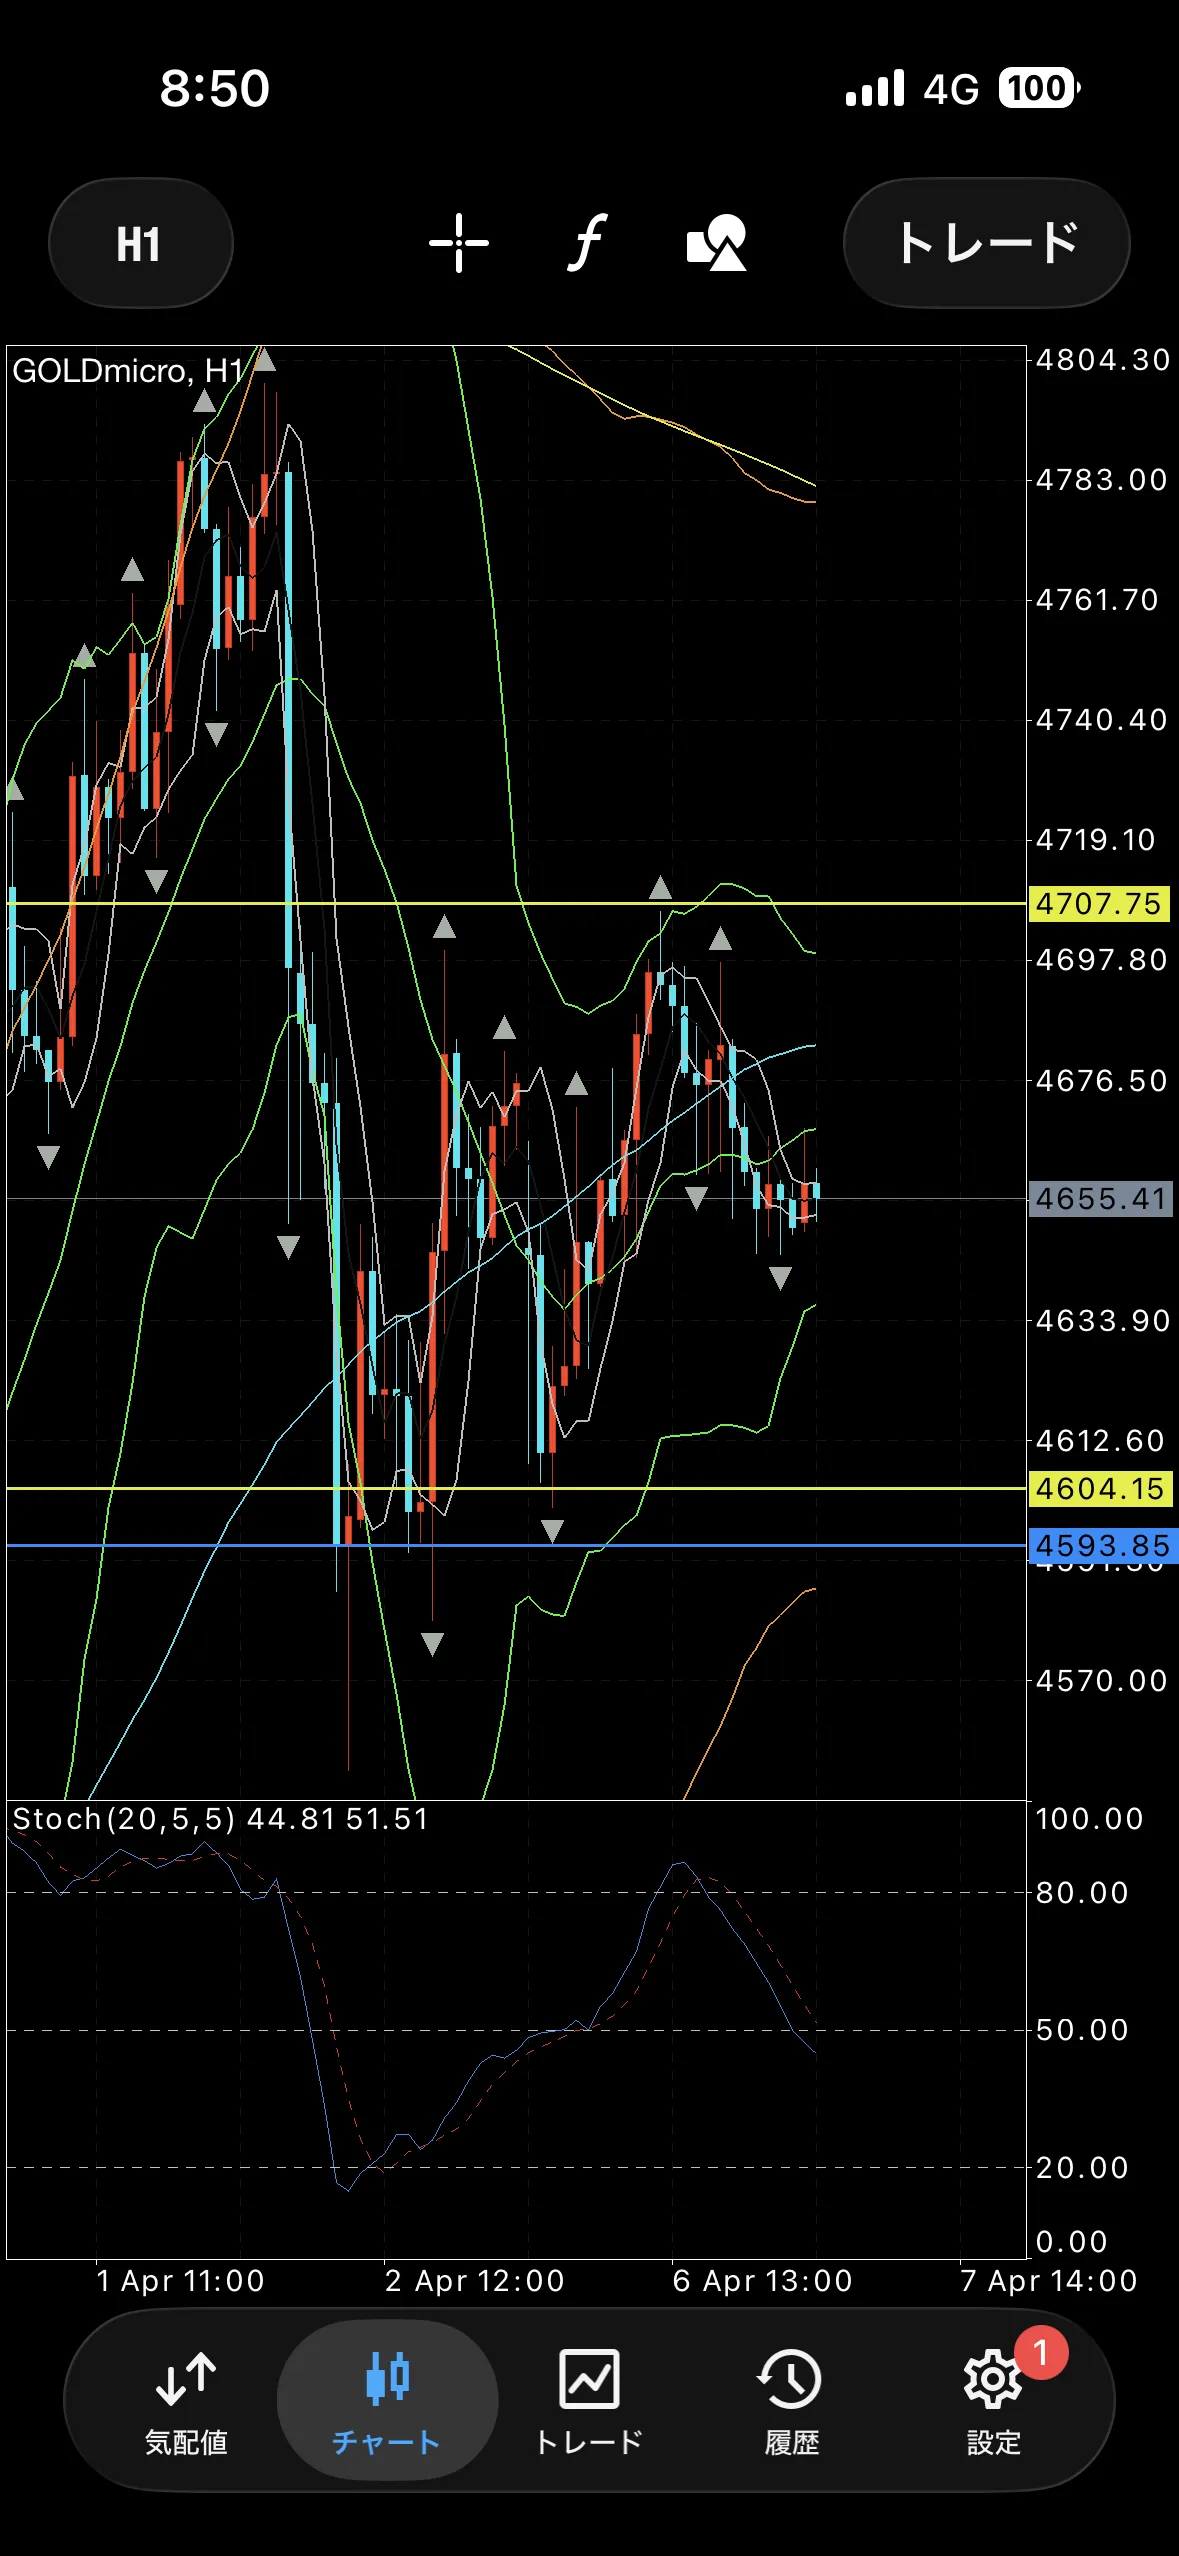
1-hour ↓
【Buy Scenario】
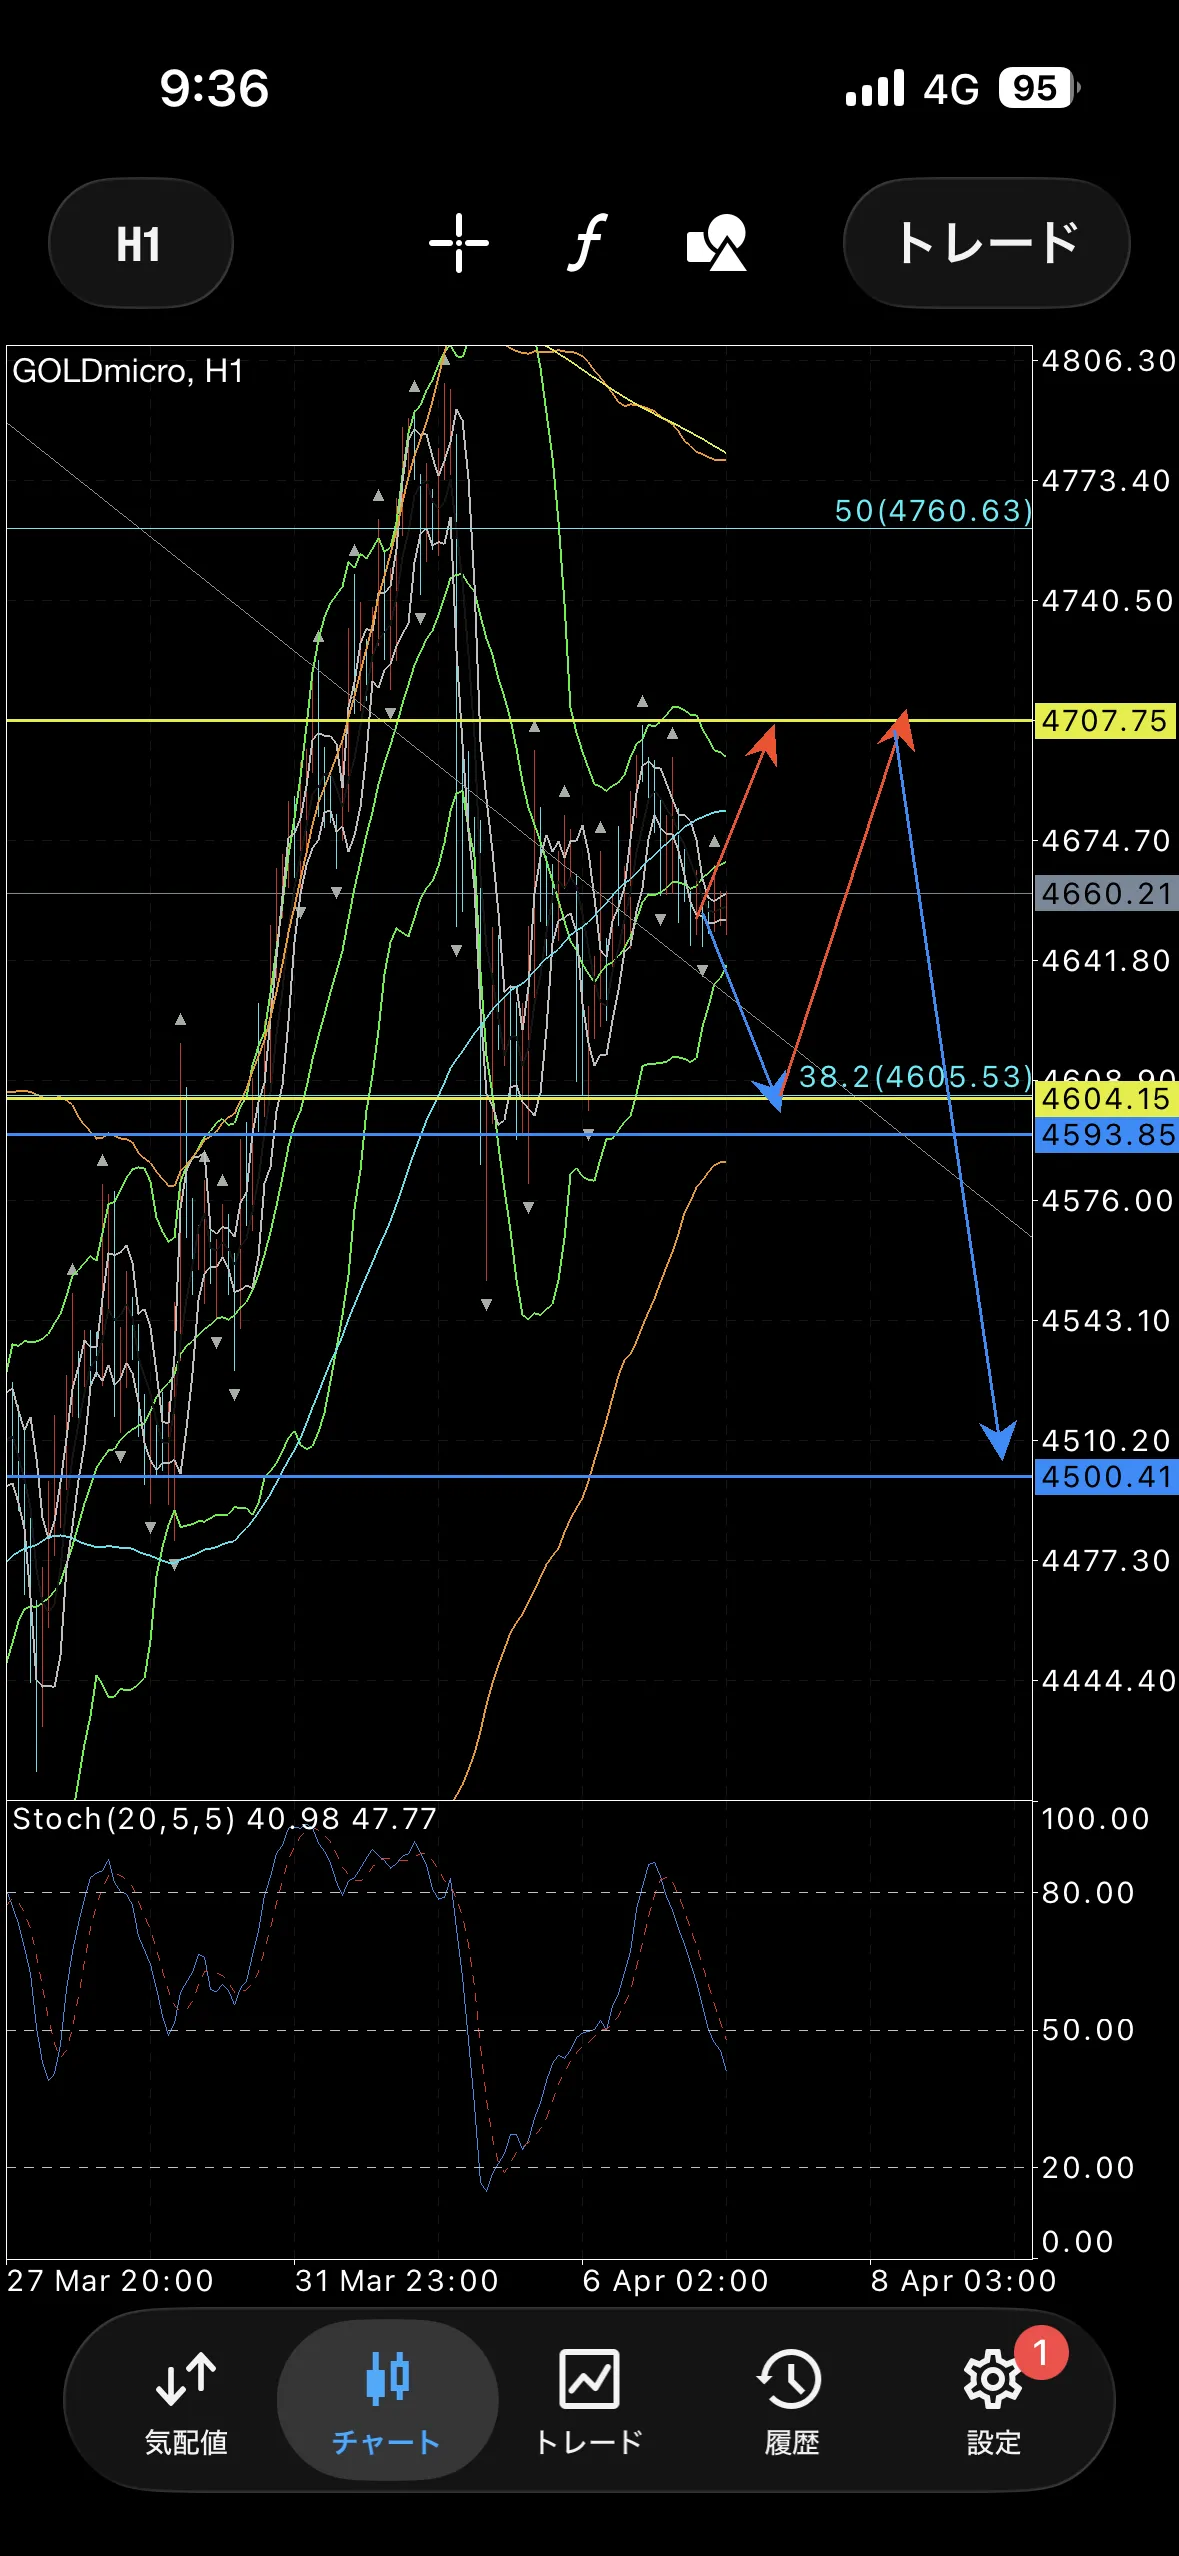
Expect continuation of the range around 4707–4604, go long with 4604 as support
【Sell Scenario】
Similarly to buying, short with range upper around 4704 as resistance
Short with a rising trend line as support
【Sell Defense Line】
4760
4707
【Buy Defense Line】
4605
4500
× ![]()