

<Stock Day Trading Indicator for Professional Use> Aims for the “next” high update. TradingView concept and usage of the “Initial Move Pullback Signal”
Right after the stock price starts to rise strongly.
In that moment when many traders feel they have “missed the boat,” there can actually still be a chance.
That is theinitial pullback.
Strong stocks attract attention in one swoop with a new high and a surge in volume,
and while taking short-term profits, they may rise again.
The first light pullback that appears at this time can become a very important entry point for day traders.
This time we introduceTradingView spec “Initial Pullback Signal”,
to visualize this moment from theprice action and volume trends, an indicator I created.
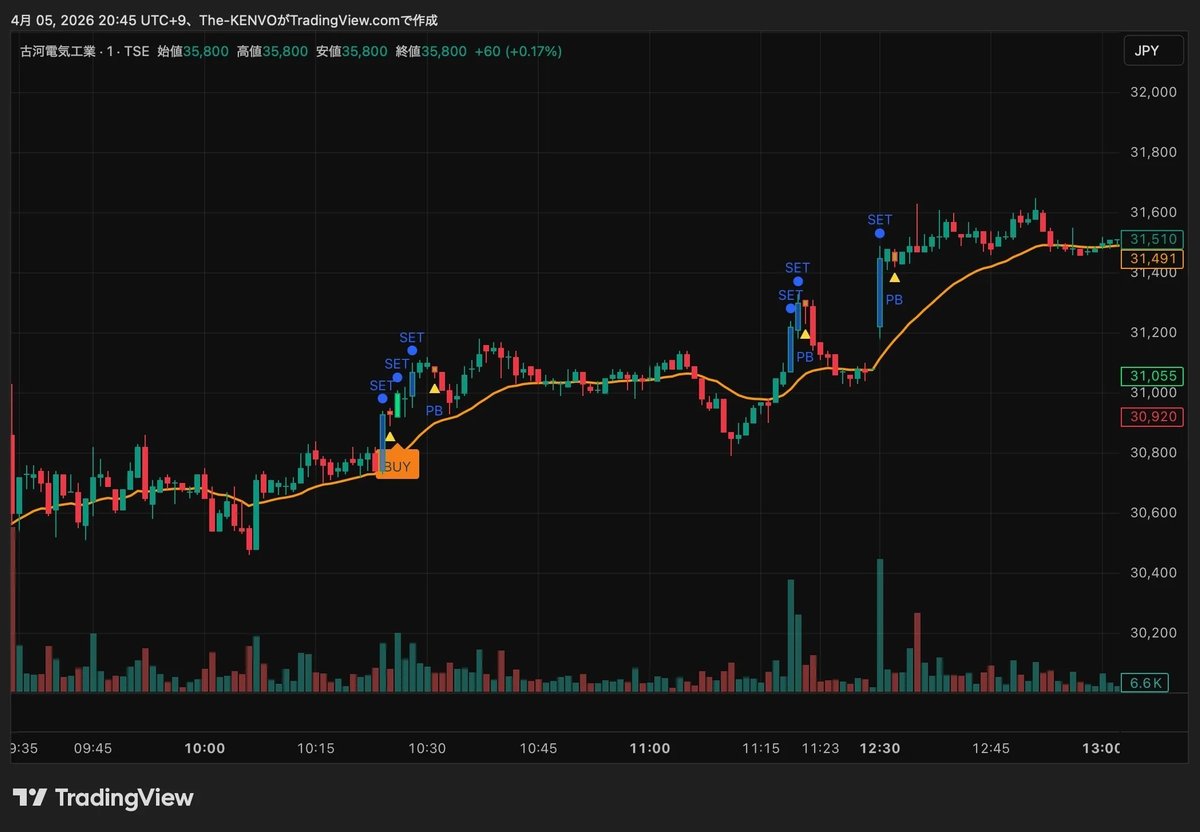
Furukawa Electric (5801) 1-minute chart
Compatible with both Japanese and US stocks,
and designed to pair well with monitoring theme stocks, material stocks, and momentum names.
In this article,
what this indicator is watching
why that pattern tends to work effectively
how to actually use it
situations where you should not use it
explain as clearly as possible.
TradingView spec Initial Pullback Signal【Japan & US stocks supported】

In what situations this indicator targets
To give the conclusion first, this indicator aims for the following sequence.
Highs new high, and a surge in volume on a bullish candle
↓
A bearish candle with decreasing volume
↓
The first pullback right after entering an uptrend
Micron Technology (MU) 1-minute chart
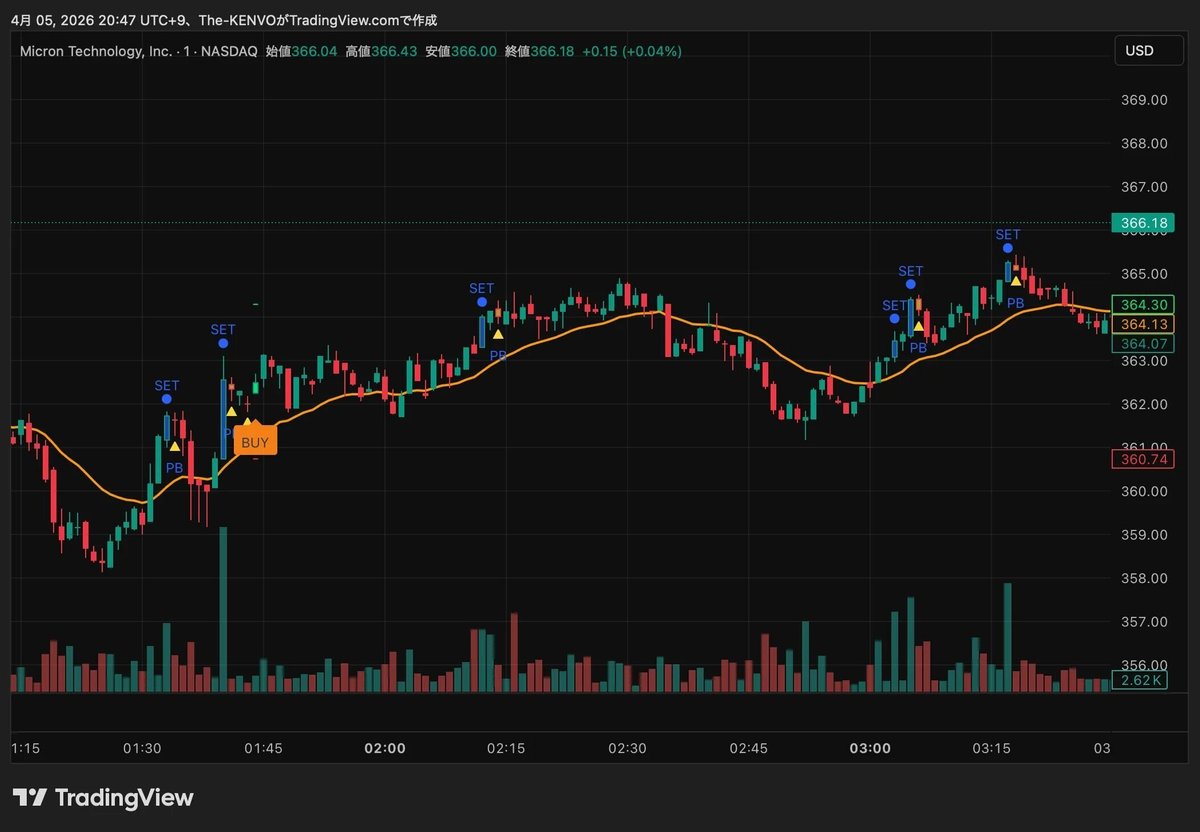
On the surface it seems simple, but in practice this flow is quite meaningful.
In the market, truly strong stocks attract attention from participants in one surge during the first rise.
Proof is thenew highsandsurge in volume.
Not just a small uptick,
they break recent highs
volume clearly increases
positive momentum on a bullish candle
When these conditions line up,
it’s easy to think, “short-term funds are starting to flow into this name.”
.
However, even stocks that rose strongly don’t go up in a straight line forever.
At some point, there is a brief profit-taking.
What matters here is thecontent of the pullback.
Even if a bearish candle appears,
if volume hasn’t expanded at that moment,
it may not be genuine selling.
In other words,
the uptrend is strong
the pullback is shallow
pullback volume is decreasing
When these conditions align,
there is ground for another upward move.
This is what makes it easy to spot the “first pullback”
.
Why the “initial pullback” tends to be a good target
The hard part in trading is not finding rising stocks but deciding where to enter.
For example, when a strong catalyst makes a stock rise, or a theme stock attract funds,
But jumping in on momentum alone often leads to buying near the top.
On the other hand, waiting too long risks being left behind.
In this dilemma, the comparatively balanced choice is
the first pullback.
The reason is simple: the first pullback of a strong stock often comes when market expectations haven’t yet broken down.
In the pullback stage,
the theme is still fresh
there are many new entrants
short sellers are also forced to cover
buying to target the next step comes in
and such conditions remain.
Therefore,
if the first pullback isa light bearish candle with decreased volume,
there is room for buying again.
Conversely, if there are multiple pullbacks, or if each pullback has increasing volume,
or if it stalls after a high,
that advantage gradually fades.
That’s why
this indicator is designed to focus on
“the first pullback of the initial pullback”.
TradingView spec Initial Pullback Signal【Japan & US stocks supported】
Three elements this indicator watches
This indicator is not a flashy logic; what it watches is quite essential.
It’s about the core of price action and volume.
1. New highs
First, determine whether the stock is actually showing strong movement.
As a criterion, use new highs.
To have new highs means, at least at that moment, buyers are prevailing over sellers.
It’s also a point where market participants’ attention tends to gather.
2. Volume surge
Next, to see whether funds are really flowing into those new highs,
check the volume.
If the price rises but volume does not accompany it,
it may be just a thinly traded fluctuation.
On the other hand, a rise with volume implies
“market participants are actually reacting.”
.
3. Volume drops on the pullback
Finally, confirm that volume decreases during the pullback.
This is the core of the logic.
Even if a strong stock pulls back once,
if volume doesn’t swell there,
selling pressure may still be limited.
In other words,
upward momentum exists, but pullbacks have little energy.
This asymmetry is what the indicator targets.
Fujikura (5903) 1-minute chart
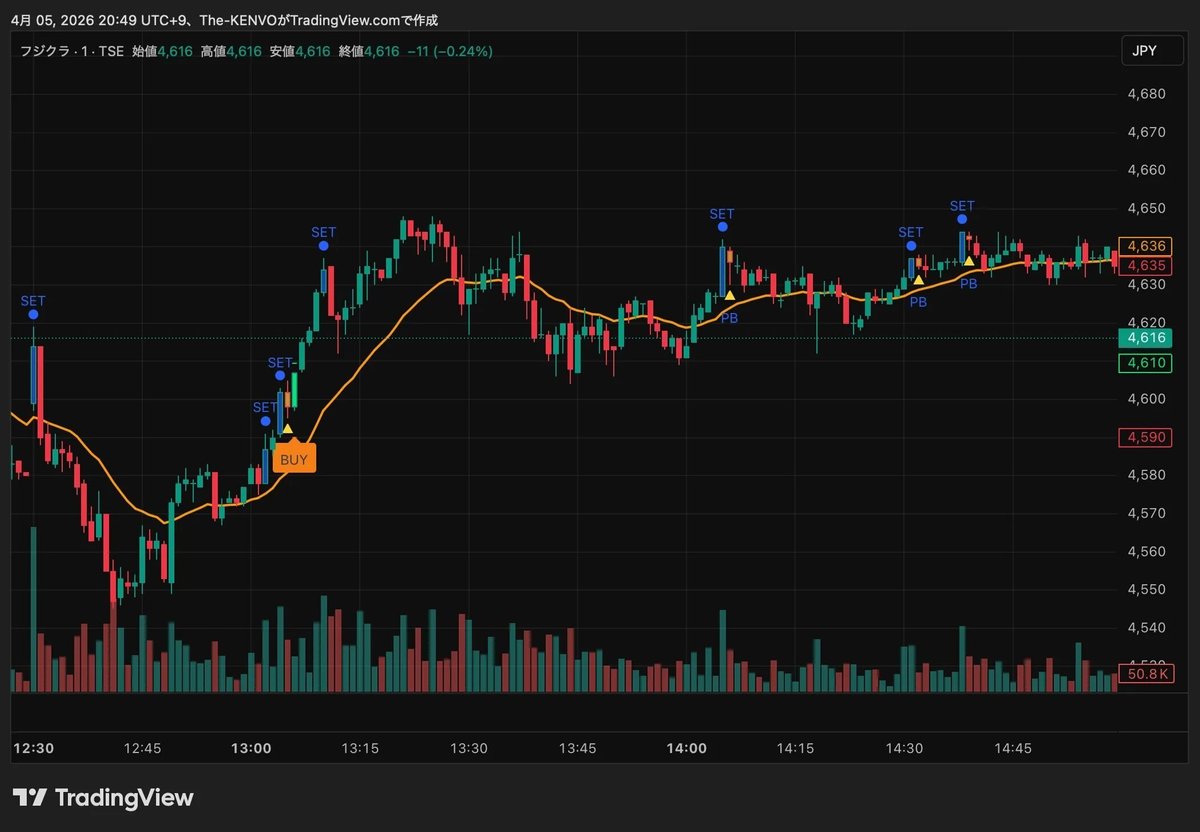
In practice, which stocks does it pair well with
This indicator is not universally applicable to all stocks.
Clearly, it pairs well with certain types.
Cases where it pairs well in Japan
Theme stocks
Material stocks
Top-volume names
Demand-driven stocks with short-term funds
Stocks that show strong moves in the morning session
In Japan, especially,
from the opening to the morning session, short-term funds tend to flow into stocks with theme or news relevance.
At this time, a light pullback after the initial surge can be quite obvious.
Cases where it pairs well in US stocks
Momentum stocks that surge after the open
Growth stocks reacting to news
Popular stocks with surge in volume
Situations where you want to target the initial pullback after a breakout
In US stocks in particular,
for stocks with strong price action after the open,
this logic tends to fit well.
TradingView spec Initial Pullback Signal【Japan & US stocks supported】
Situations where you should not use it
No indicator is suitable for every situation.
This indicator is no exception.
1. Thinly traded stocks
For thinly traded stocks,
the volume trend itself becomes unreliable.
If the order book is light, price action becomes noisier.
2. Truly ranging markets
In a range, even if you see a high, it often stalls soon after.
It can get caught in mere oscillations rather than a genuine pullback.
3. Days with extremely weak market conditions
Even if an individual name looks strong, when the overall market is weak,
pullbacks may not end up as pullbacks but turn into declines.
4. Stocks that have already created pullbacks many times
This logic targets “the first pullback of the initial movement.”
For stocks that have already moved up and down many times, its edge tends to fade.
How to use the signals
This indicator does not guarantee that buying will win just because a signal appears.
Rather, in practice, the strongest use is as a tool to narrow down what to monitor.
For example in Japan,
the core names of the day
top trading volume
theme stocks worth watching
names with funds flowing in the morning
Focusing on these,
pick out those that show the “initial pullback” pattern among them.
In US stocks,
stocks that show strong gaps after the open
stocks being watched in the news
stocks with relatively expanding volume
Among these,
enter not by chasing but by waiting for the pullback.
This indicator helps inform that judgment.
A powerful point when combined with discretion
Personally, I think this indicator is
not to remove discretion but to sharpen it.
Use it to refine your discretion
Elements to watch include, for example:
whether the stock has a theme or catalyst
whether the market environment is favorable or adverse
whether the pullback is stopping near VWAP or moving averages
whether there is buying depth in the order book or price ladder
whether other theme stocks are also strong
By layering these elements,
the quality of signals improves considerably.
Why this indicator was created
There are many technical indicators in the world.
But in actual short-term trading, what you watch is quite simple.
Is the stock truly strong?
Where did funds enter?
Is the pullback selling, or just profit-taking?
Where is the most natural point to ride the next move?
I wanted to visualize this more visually and with better reproducibility.
That became the starting point for creating this indicator.
Buy when the high is updated.
Think a pullback occurs because of a bearish candle.
Rather than such vague interpretations,
look at the set of price and volume movements.
That idea is precisely shaped into
Initial Pullback Signal.
Who this is suited for
Want to target pullbacks in strong stocks
Frequently trade theme stocks and material stocks
Watch both Japanese and US stocks
Want to reduce chasing
Want to weight volume more
Want to raise monitoring efficiency with alerts
Conversely,
for those who want to trade automatically as if it were a robot,
and trade solely by arrows without thinking, this is not suitable.
This indicator is a supplement line for a person who reads the market.
In conclusion
Very strong stocks exhibit movements characteristic of strong stocks.
Among them, the most reproducible is
the first pullback after a new high.
Do not chase — wait.
Not only wait, but define the shape.
That is why I created this indicator as a tool.
Japanese stocks’ theme stocks, material stocks, and supply-demand stocks.
US stock momentum names.
For traders chasing “stocks that funds are moving toward right now,”
I believe this has become a very usable one.
If you’re interested, please also check the product page.
Viewed alongside actual charts,
this indicator’s targets will come across more intuitively.
TradingView spec Initial Pullback Signal【Japan & US stocks supported】
Disclaimer
This article does not recommend buying or selling specific financial products.
The content provided is for information purposes and does not guarantee future results.
Please make all investment decisions at your own risk and judgment.