

Gold Analysis 2026/04/06
Today we are starting with an open window
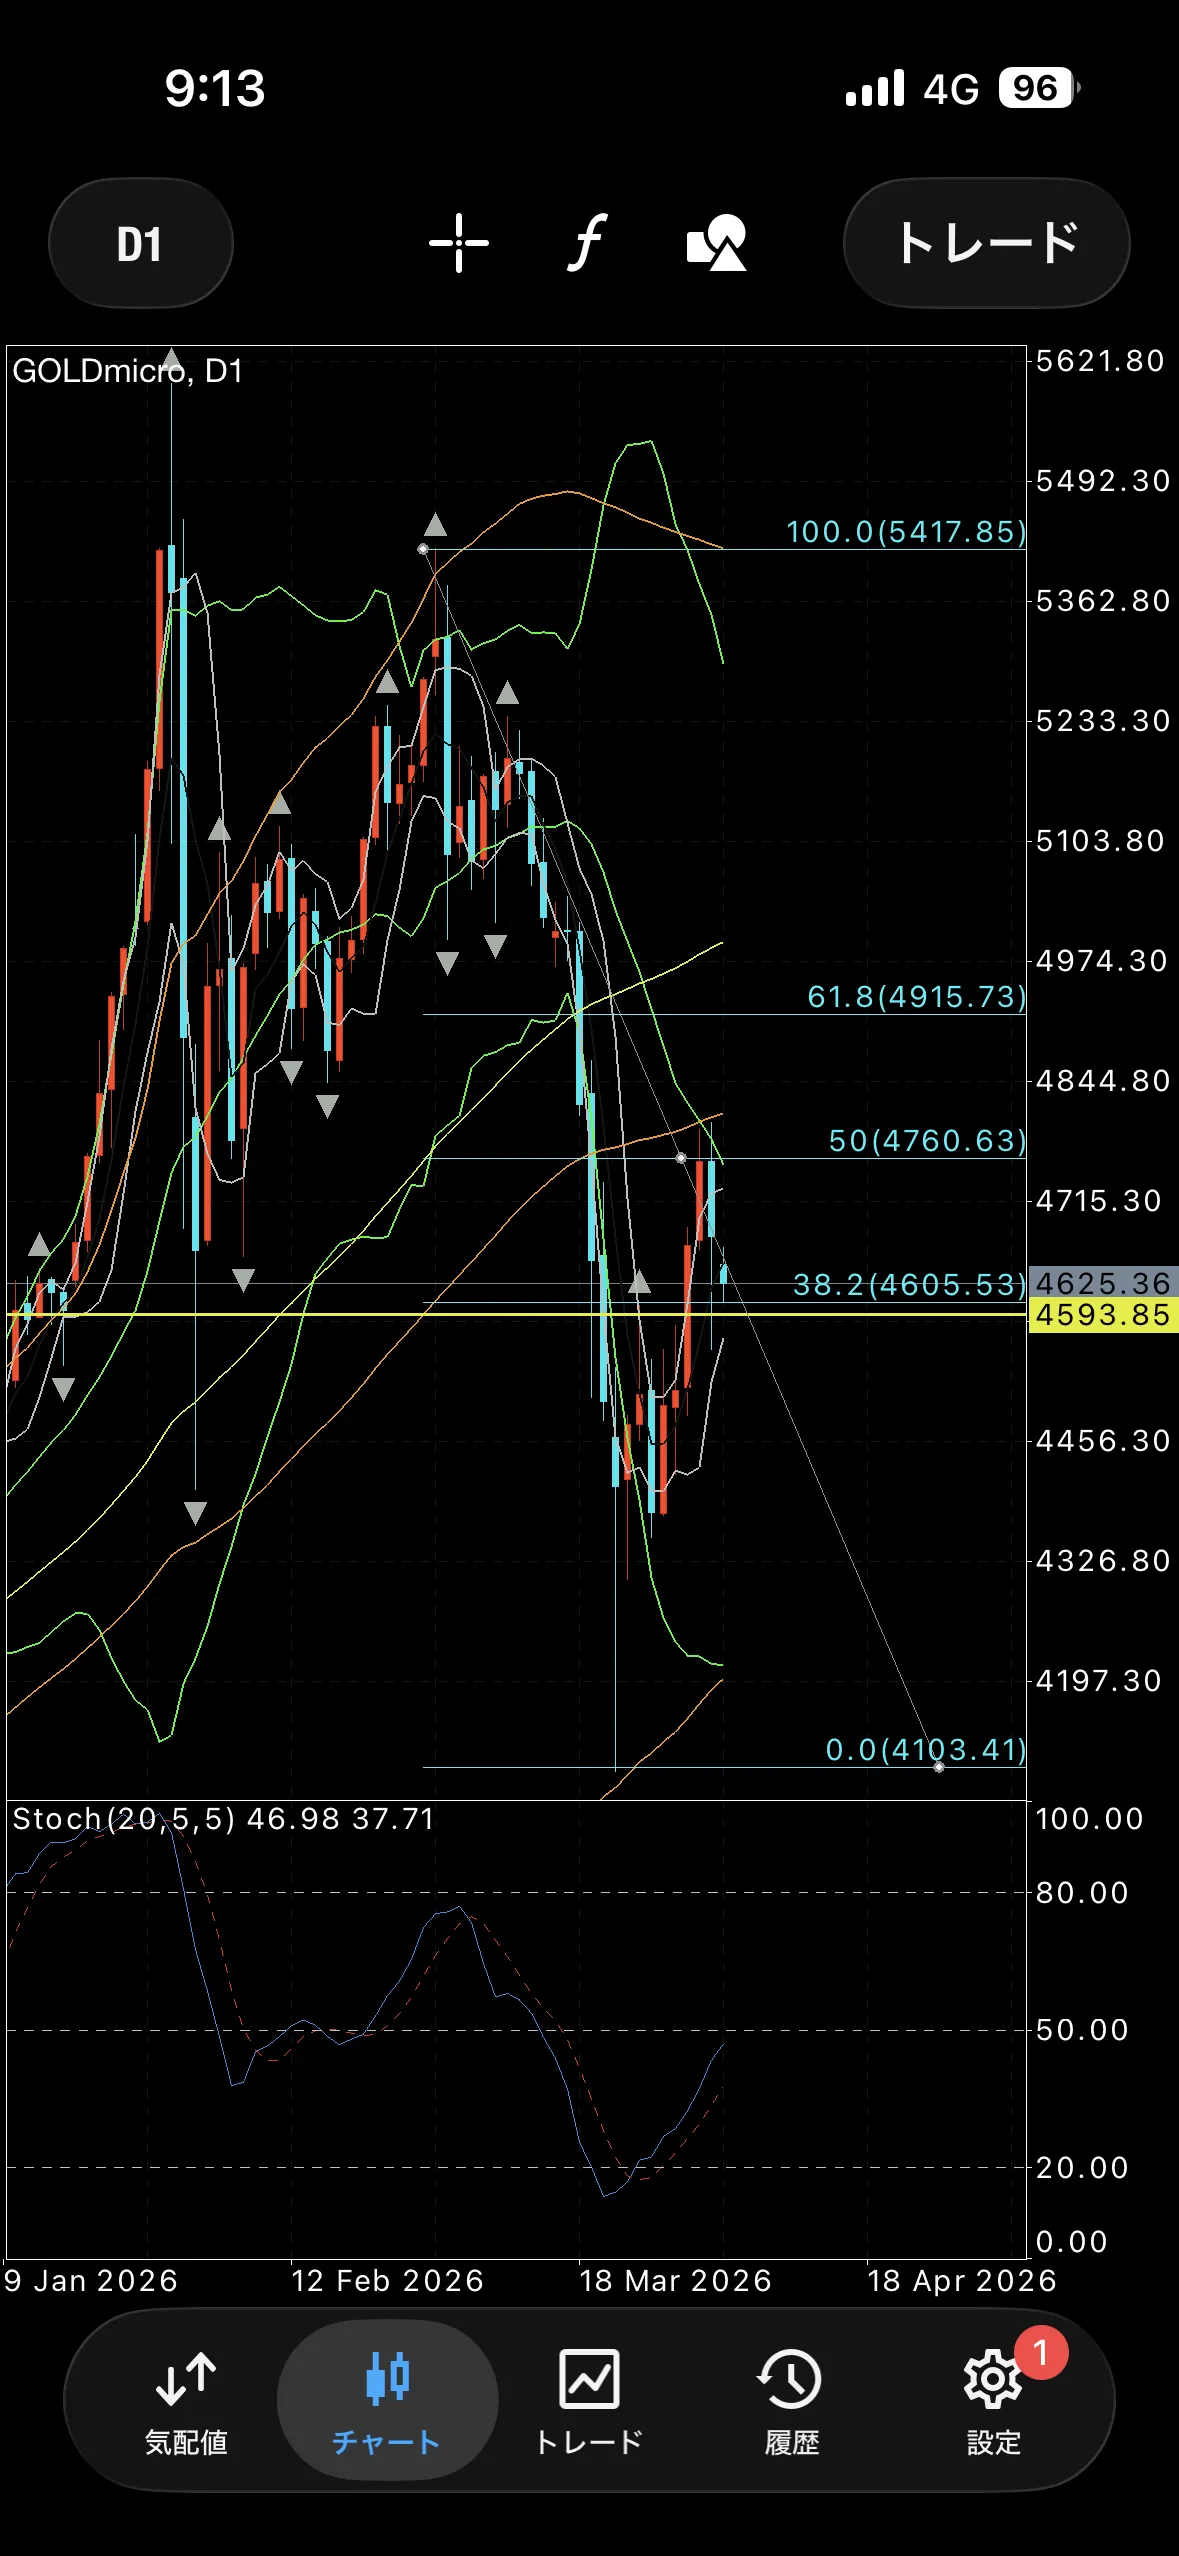
Friday's daily chart showed a long lower wick with a bearish shadow
Because the body of Thursday's bullish candle has not been broken, there is also a possibility that today will end with a lower wick, butgiven the drop from the 50% Fibonacci level, many traders may be aiming for a short position.
【Perspective】
Daily, 4-hour, and 1-hour all show a downward trend
【Sell scenario】
Short-term trend following from the break of 4593.
Sell from horizontal levels at 4684, 4742, etc.
【Buy scenario】
4593 rebound buy (until the 4-hour upward Dow breaks)
【Key price ranges】
4742
4684
4593
4500
× ![]()