

Utilizing the "Visualization Indicator" (Part 245)
“Visualization Indicator” utilization(its245)
1. “28 Currency Pair List Indicator” to evolve further into an indicator
“8CP Visualization Indicator” for GBP J PY to be drawn
“8CP Visualization Indicator” includes Oceania version, London version, NewYork version, AnyCP version. This time we used London version.
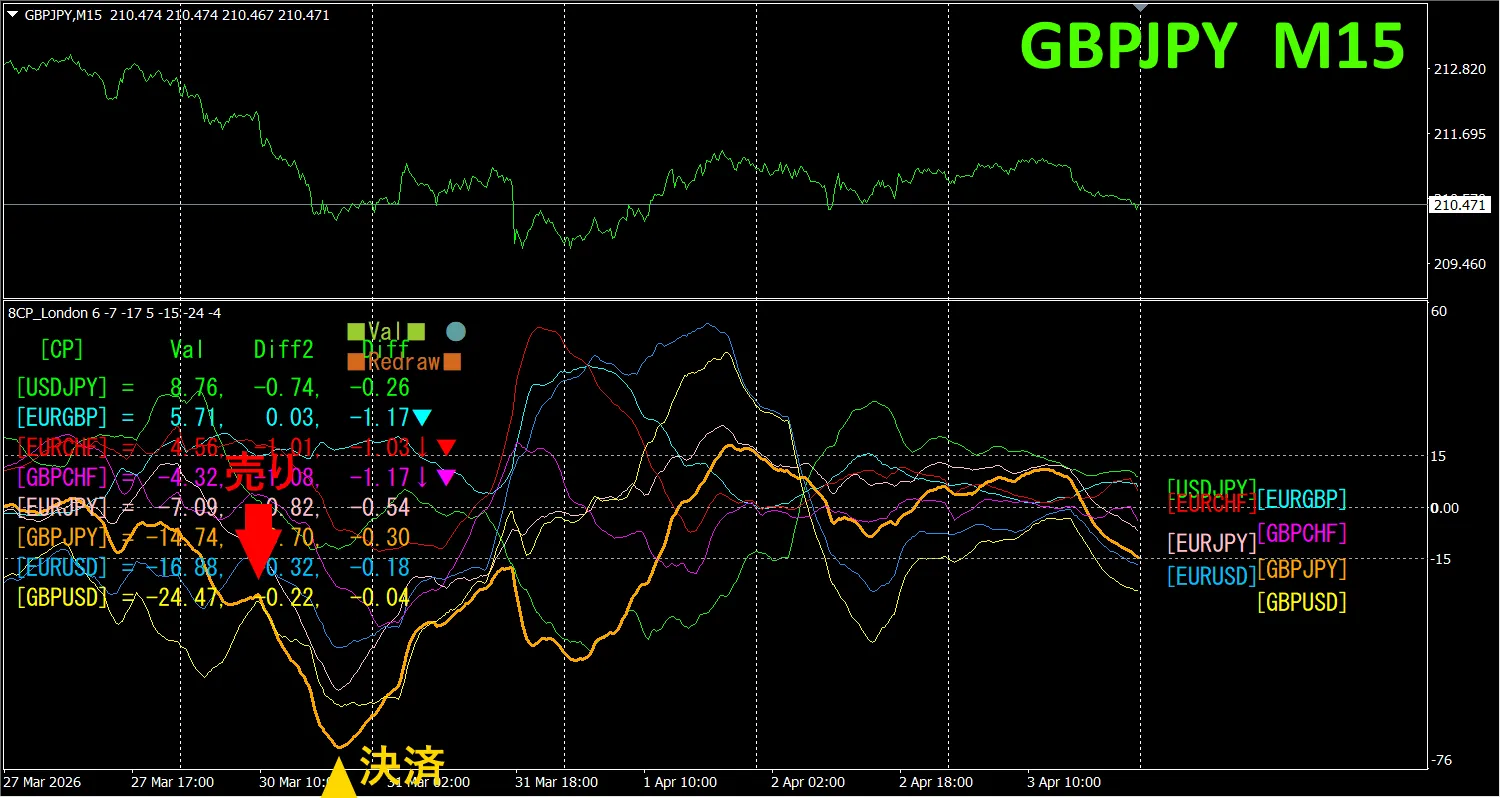
Upper half shows, GBP JPY on a 15-minute chart. Lower half shows the results from the “8CP Visualization Indicator An orange colored chart corresponds to GBP JPY.
On Monday, the GBP JPY chart moved below the other charts, so we sold. We closed at the day's low, earning about 170 pips. Profit was around 170 pips. Taking only what you can, and not trading the rest is the correct approach.
Currency Strength Graph
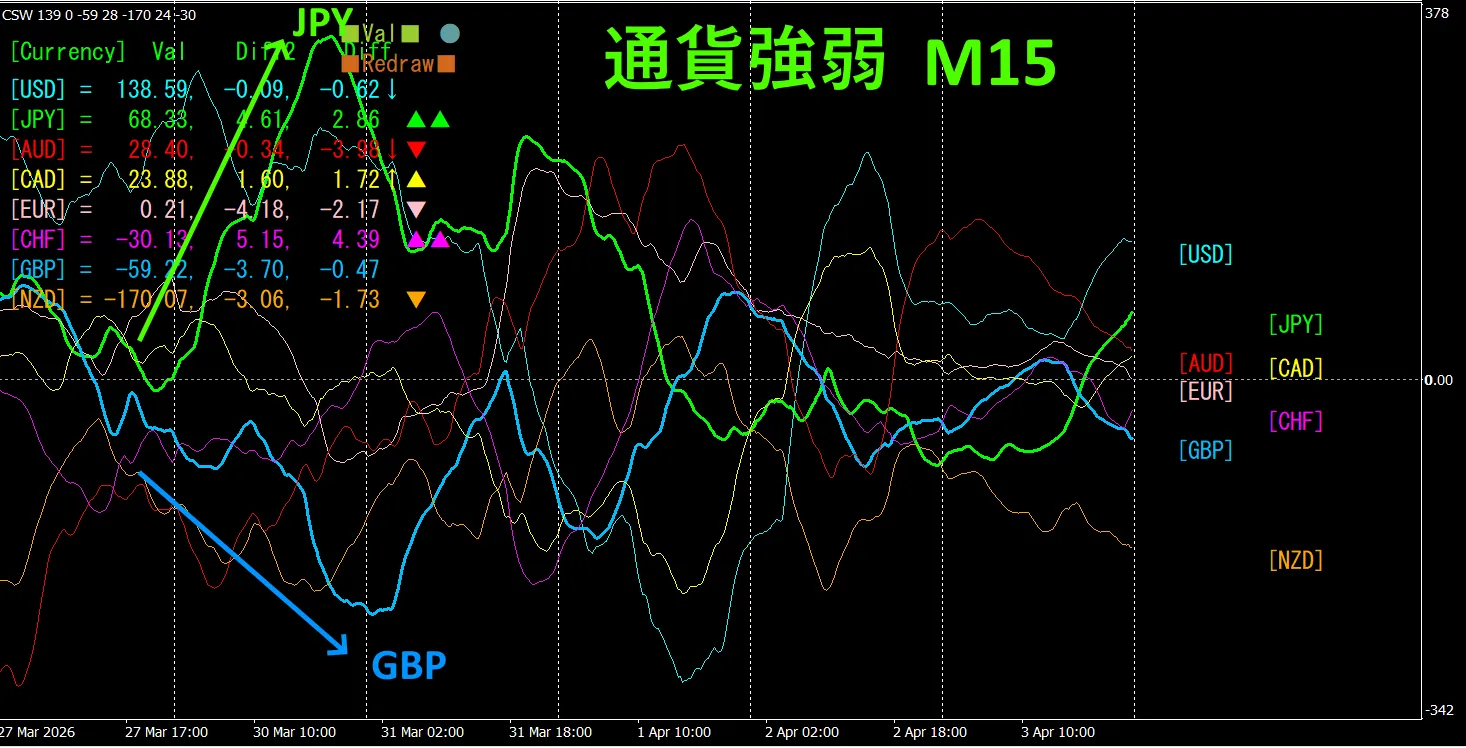
Looking at the 15-minute currency strength graph, GBP and JPY are in reverse correlation. Only the widening, diverging parts of GBP and JPY should be traded. When widening, you should sell GBP/JPY. Although briefly, since they are in reverse correlation, target only those points for trading.
In FX, pick the currency pair that is currently the strongest growth and in reverse correlation, and the results will follow.
“Aim for Currency Strength Reversals” is FX's iron rule.
Using “TrendLine-EX” you can automate entries and exits when lines are breached diagonally. Since you can leave it as is, easy trades become possible. “TrendLine-EX” can sell automatically on a break below the trendline, and close automatically on break above, making it a semi-automatic EA.
2. Try Best Select Indicator
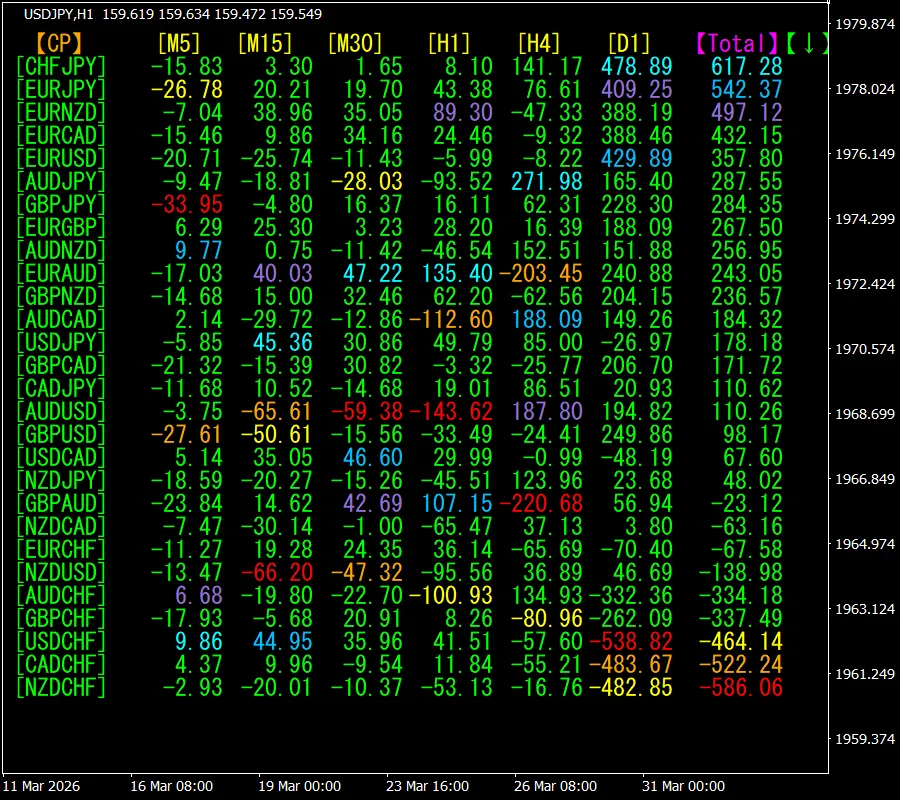
The diagram below is a snapshot from 2026 March 31 14:53 (JST).
This figure is not the usual “28 Currency Pairs Best Select Indicator, but the “28 Currency Pairs Deviation Comparison Indicator” (unreleased indicator), which quantifies the deviation of each of the 28 currency pairs from their moving averages and visualizes it. [TOTAL] sorts values in descending order. The lowest is NZD CHF, which indicates the candlestick is far below the moving average .
Now, let’s look at NZD CHF chart.
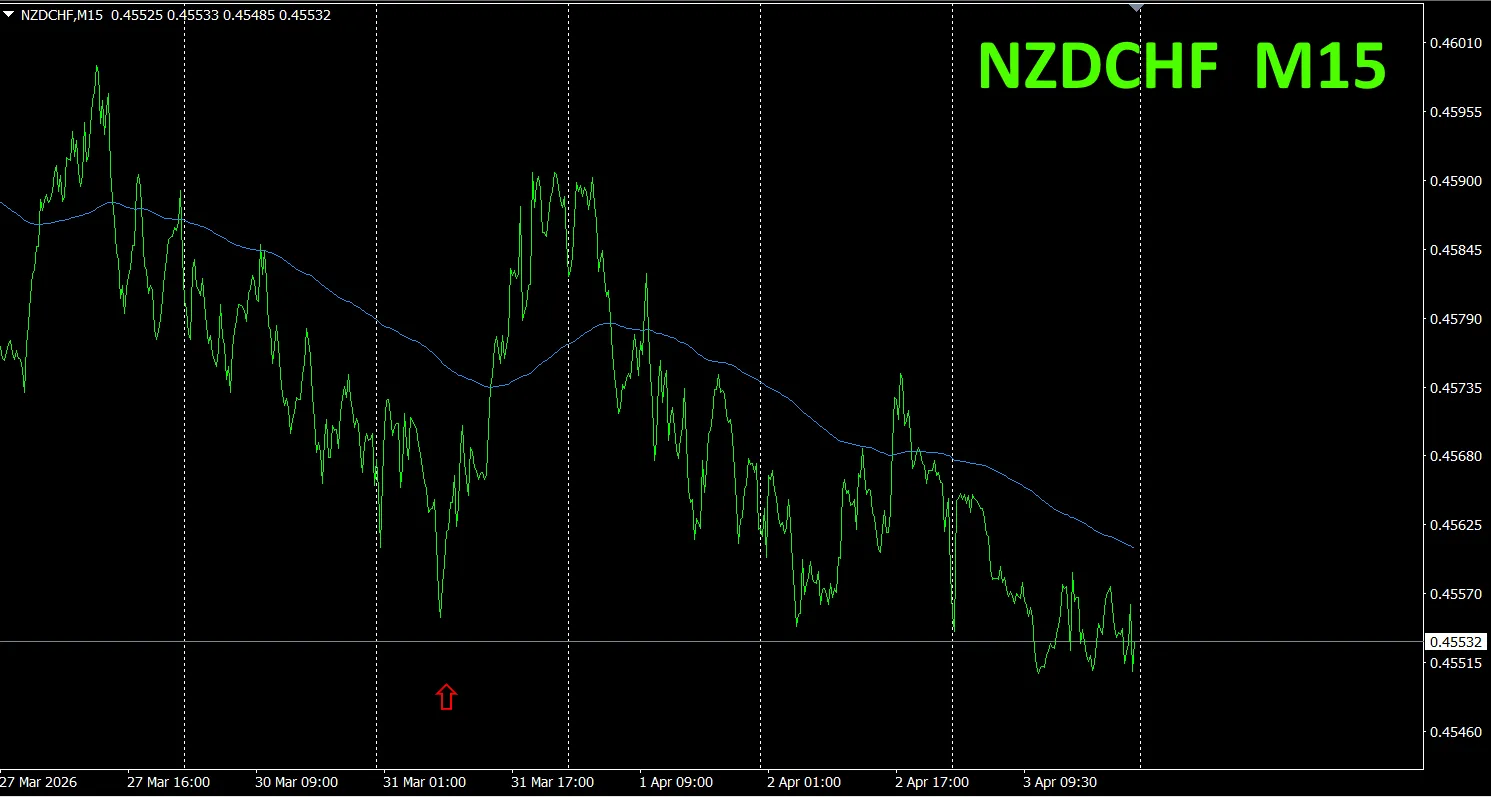
The red arrows mark the points where the screenshot was taken. They capture points where the price deviates far below the moving average.
The “28 Currency Pairs Best Select Indicator” allows easily identifying which currency among the 28 pairs is showing the strongest trend. Also the “28 Currency Pair Deviation Comparison Indicator” tells you which currency pair among the 28 has the greatest deviation, enabling you to judge at a glance which pair to trade.
“28 Currency Pairs Best Select Indicator”

https://www.gogojungle.co.jp/tools/indicators/35128
3.2021 year 5 month onwards, how did EURJPY move?
we have tracked EURJPY’s movement.
To view the overall trend, a 30-minute chart showing roughly the last three weeks is drawn.
Last time, we wrote the following.
Pink is EUR, green is JPY. EUR and JPY do not show a clear direction. Since the direction is not clear, EURJPY will likely be range-bound in the future.
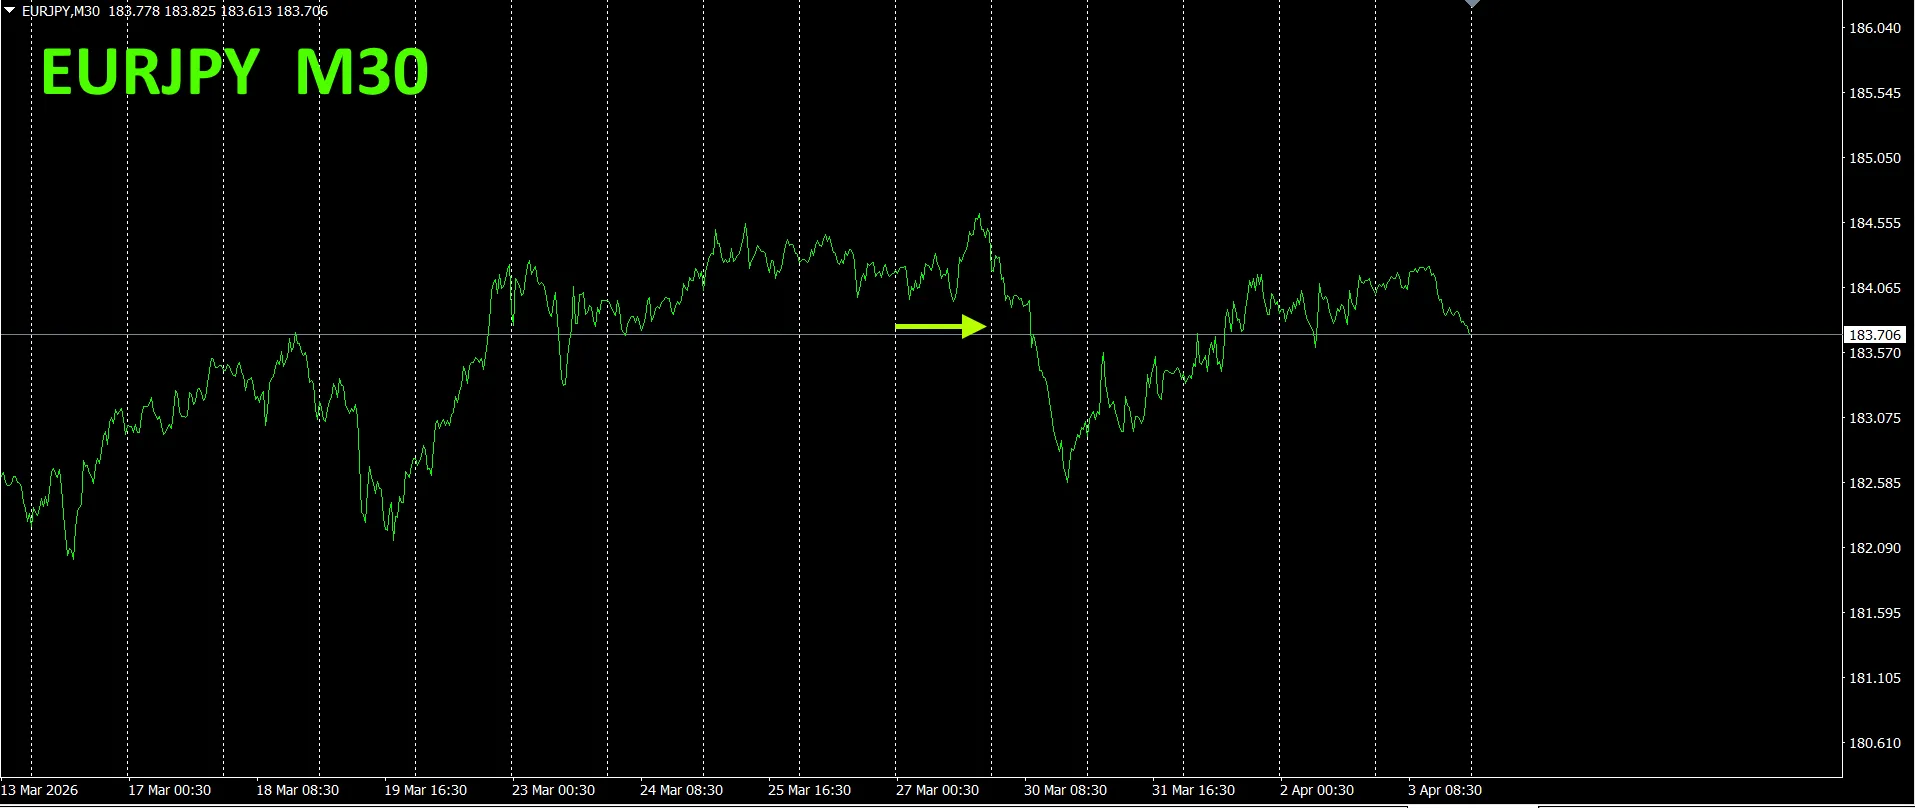
It declined on Monday, but by week’s end had returned to the previous level
30-minute currency strength chart.
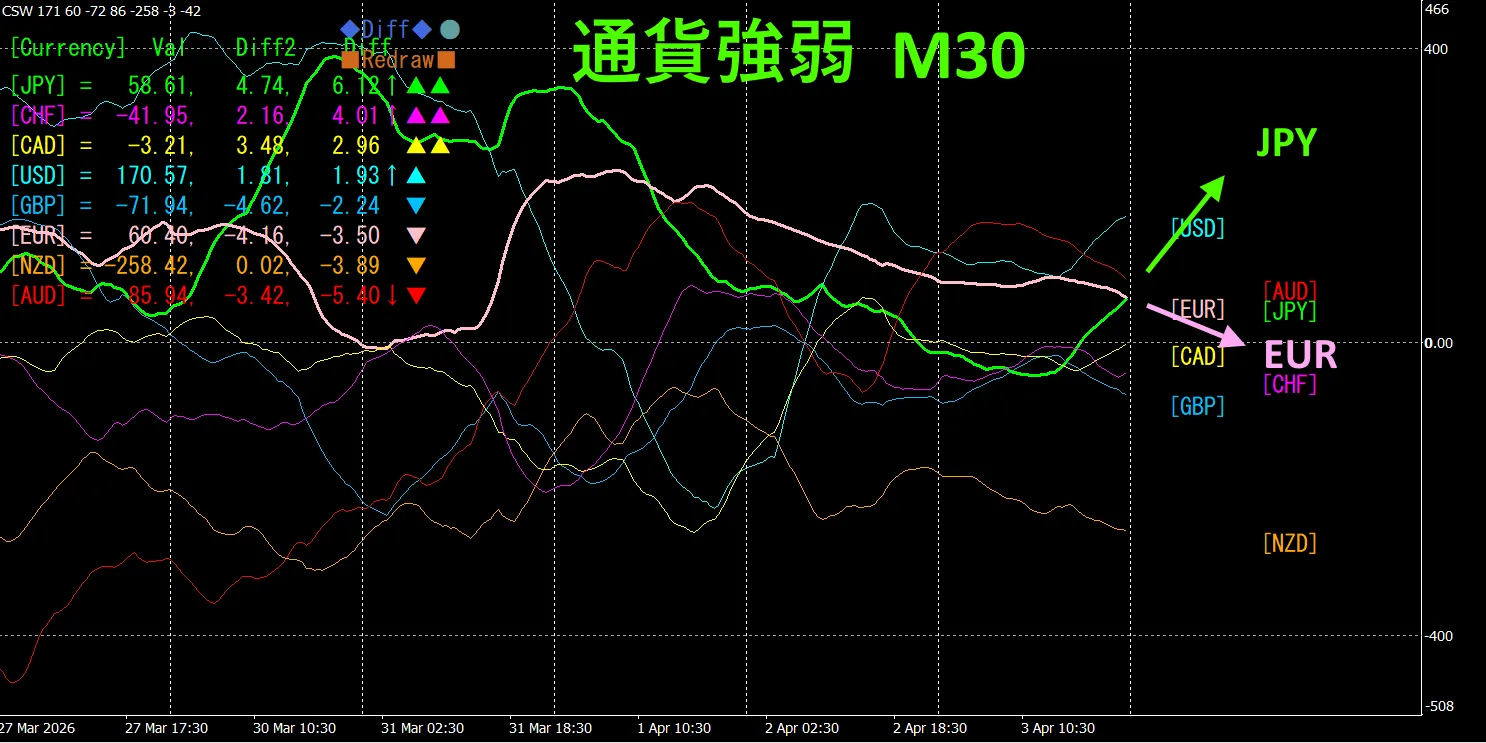
Pink is EUR, green is JPY. EUR is down, and JPY is up, so future EURJPY is expected to fall.
4. Try the new indicator Dual_MACD_Trend_Indicator.
New indicator “Dual_MACD_Trend_Indicator” details are below.
MT4 version:https://www.gogojungle.co.jp/tools/indicators/62199
MT5 version:https://www.gogojungle.co.jp/tools/indicators/62202
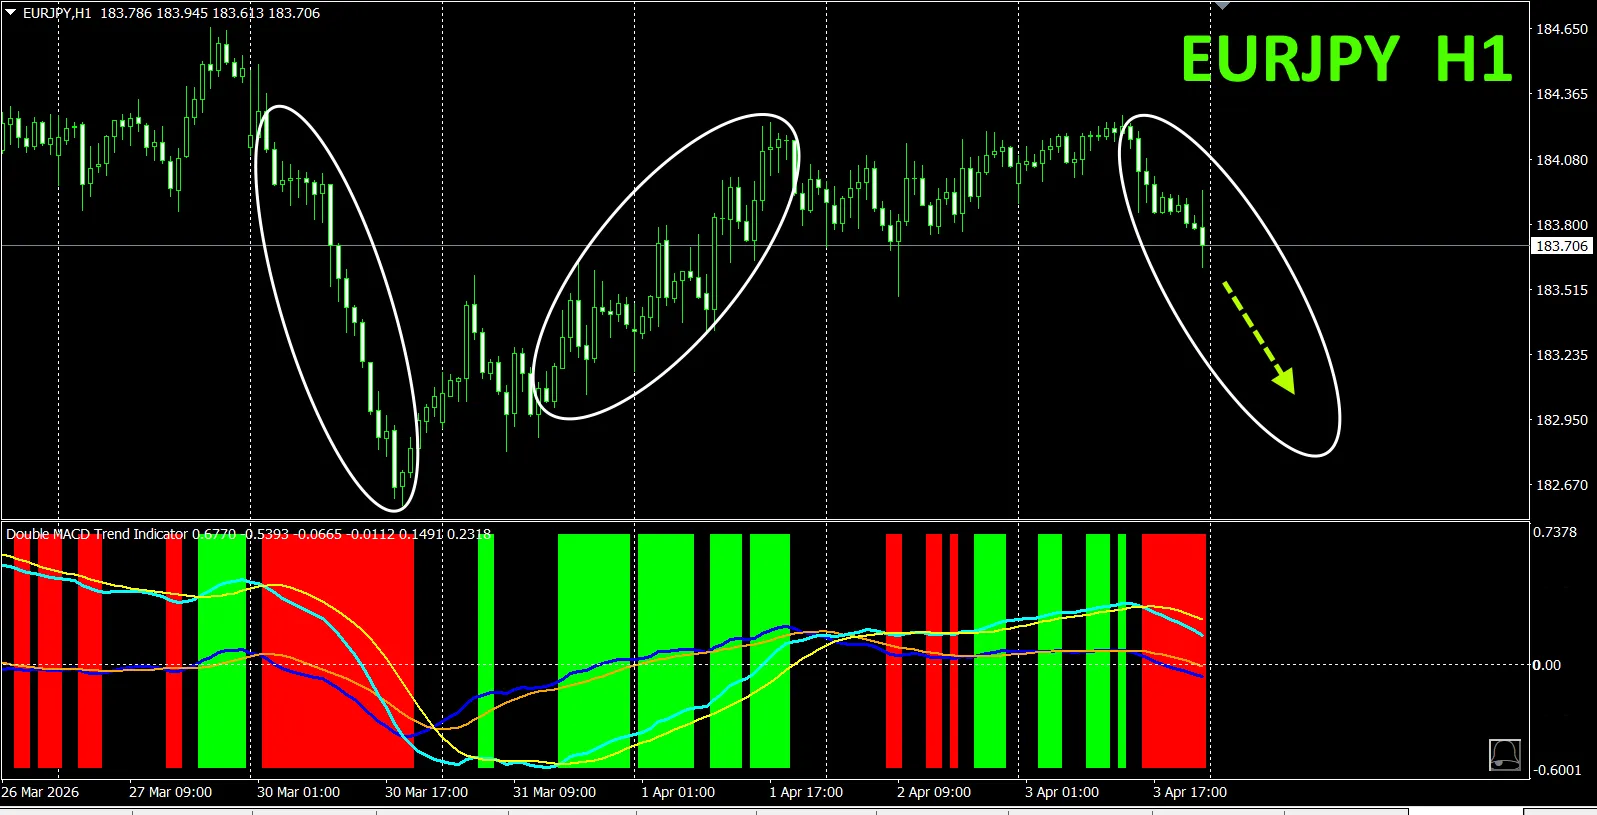
This indicator clearly shows trend direction with color. If bar color is Lime, it is a buy; if Red, a sell. It is beginner-friendly. If the bar color is green, it indicates an uptrend; if red, a downtrend; if no color, there is no trend.Because it is color-coded, you can grasp the trend at a glance.
The red sell zone and green buy zone are clearly separated, making trading easier at a glance.In the top figure, focus only on the circled area; if the indicator color is red, trade sells; if green, buys.Only focus on steeper slopes of the ellipses; avoid trading in areas with gentle slopes.
Since a downtrend is forming over the weekend, further declines are expected. Place a market order sell and, assuming you take profit at the recent low, you would gain about 100 pips
In Dual_MACD_Trend_Indicator, buy in green zones, sell in red zones, and do not trade otherwise — simple rule.
With “Dual_MACD_Trend_Indicator” you will no longer be unsure about trading direction.
From the sales page
“Trend_Color_MA_Dual_MTF” was developed to transform your trading. This tool is not just a moving average. It visualizes trend direction with color, and notifies you with sound and alerts the moment a trading opportunity arrives—your personal assistant..
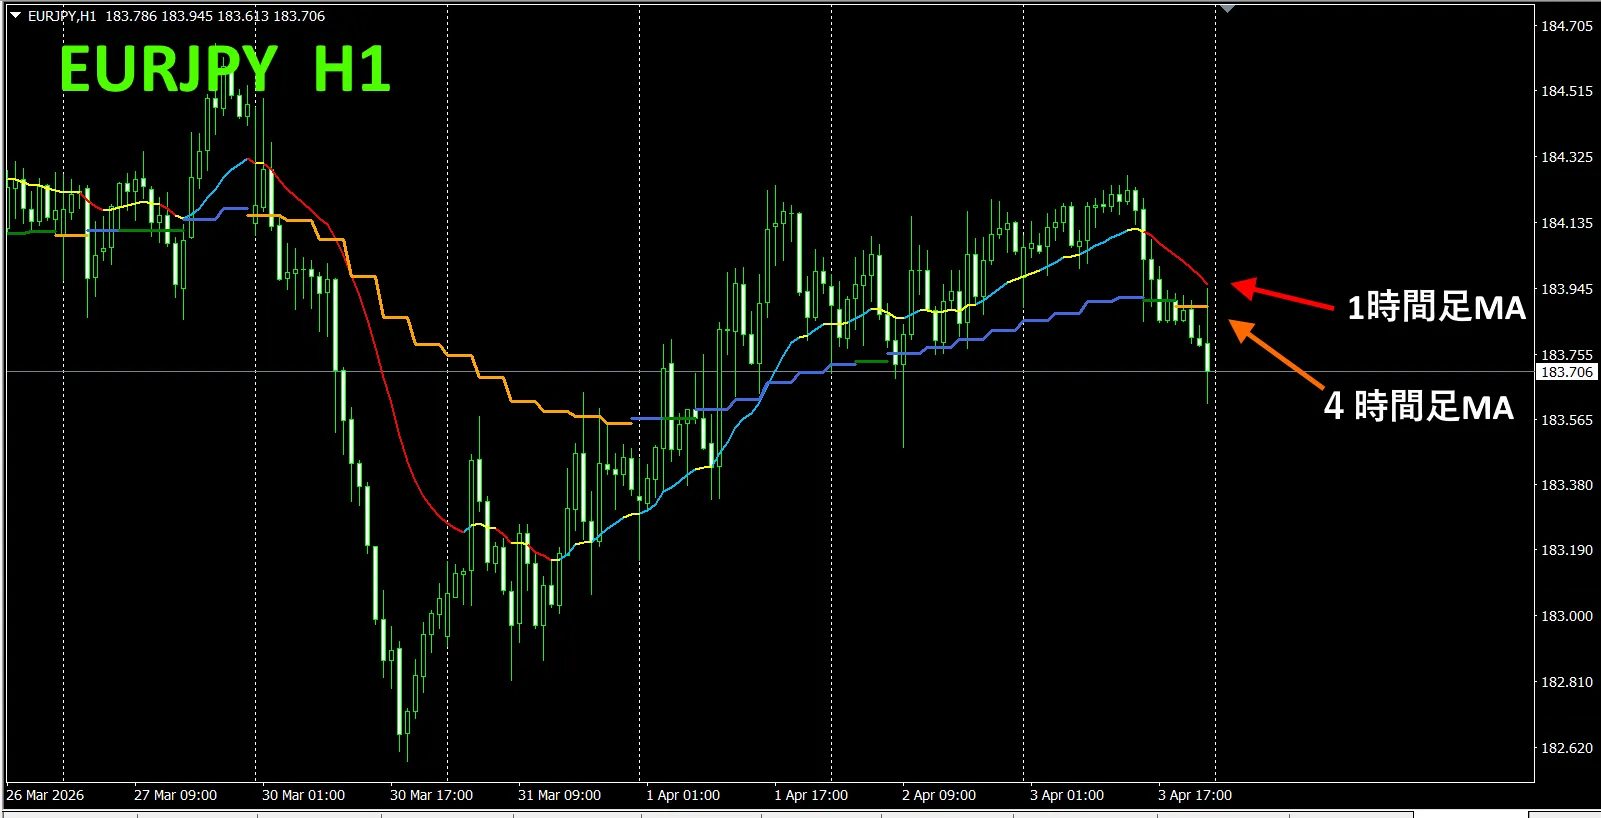
As an example, on EURJPY 1-hour chart we displayed the 4-hour moving averages simultaneously.
If the color of the higher-time frame and the current frame match in the same color family, trade accordingly: red for sell, blue for buy.
1-hour MA shows red indicating a downtrend, 4-hour MA shows orange indicating downtrend, and candlesticks break below the two moving averages, suggesting a selling bias from here.
For details, please refer to the following link.
https://www.gogojungle.co.jp/tools/indicators/75985
“8CFD Visualization Indicator Any version”
https://www.gogojungle.co.jp/tools/indicators/32288
“toretore Indicator
https://www.gogojungle.co.jp/tools/indicators/50115
“TrendLine-EX”

https://www.gogojungle.co.jp/tools/indicators/42257
“8C Currency Strength Visualization Indicator” is described on the following pagesC Currency Strength Visualization Indicator” is described on the following pages。

MT4 version https://www.gogojungle.co.jp/tools/indicators/39150
MT5 version https://www.gogojungle.co.jp/tools/indicators/39159
【Items I have for sale】


