

FX Techniques are Simple and Fine|The Reason Why “Simple FX Techniques” Outperform Complicated Techniques
To you who are looking for a simple method in FX
When you first started FX, haven't you had experiences like this?
You think, “There must be a better method,” and keep trying new methods one after another. You keep adding indicators to the chart until the screen is full of lines. You click on “methods with 90% win rate” on YouTube or blogs and start from scratch again.
This was exactly the same for me, with more than 10 years of trading experience.
Let me get to the point.
FX methods are strongest when they are simple.
In this article, I, who have more than 10 years of trading experience and am a programmer, will introduce what really worksa simpleFX methodin a ranked format.After reading this article, you may be able to picture choosing one method that you should use.
Simple is the strongest FX method — why do complex strategies fail?
When I began trading, there were more than ten indicators on the chart.
Moving averages, MACD, RSI, Bollinger Bands, Ichimoku. I seriously believed, “If I have all these, I won’t lose.”
But what happened?
Each entry had contradictions like “this indicator is GO, but this one is NO,” so I never knew where to enter. I also extended the time to stop out without justification, thinking “it might come back if I wait a little longer.”
This is the main reason why complex strategies fail.
When there is too much information, the human brain delays judgment.
In cognitive science, this phenomenon is known as “decision paralysis”: the more options there are, the harder it is to make the optimal decision.
FX is the same. The more indicators you have, the more the basis for entries becomes ambiguous, and the more delayed your stop-out decisions become. As a result, you fall into the worst pattern: “entering somehow and stopping out somehow.”
A simple method has none of this.
Since the basis is limited to one or two points, decisions are fast. The stop-out line is clear, so the mind doesn’t waver. This is the biggest reason simple methods beat complex strategies.
FX methods don’t need many — what is truly needed?
“So, do I not need any method at all?”
If you think so, you’re wrong.
Trading blindly versushaving a simple methodand trading with it are completely different things.
Trading blindly means you enter simply because you feel it will rise. This has no reproducibility, and even if you win by chance, there’s no guarantee you’ll win the same next time.
Meanwhile,a simple methodmeans you have a clear rule such as,“I enter when these conditions are met.”This is the essence.
Indicators should be used as “support”
Indicators are not totally unnecessary.
Signs to not miss entry signals, indicators as supportive decision material—if used correctly, they become powerful allies.
However, they are always “support.”
The main basis lies in candlestick patterns and price movement. Indicators are used to reinforce that basis. If you get the order wrong, you’ll be trading at the mercy of indicators.
How to choose a method that fits you
The criteria to choose a method that fits you are threefold.
First,is the rule clear?“Enter when this shape appears” should be determinable the same by anyone.
Second,can you explain the basis?Can you explain in your own words why you enter there?
Third,can you sustain it?A method that is too difficult to continue is meaningless, even if the win rate is high.
FX method ranking — 4 simple, usable methods
The ranking criteria are threefold:
Simplicity (clear rules that anyone can reproduce), low subjective variance (settings and interpretations don’t vary), and compatibility with candlestick trading (how well it can pair with reversal signals that are the article’s core).
Chosen with these criteria,simpleand usableFX method rankingis presented.
Ranking 1: Candlestick trading
First place goes tocandlesticktrading.
Why number 1?
Because it is the only method that can base its reasoning on price itself, without relying on indicator values.Thus.
Moving averages are past averages. RSI, MACD all display results of past prices. But candlesticks show the current battle between buyers and sellers at this very moment.
Here I freely share my candlestick trading method I’ve used for more than 10 years (Pattern ① Basic Break).

Entry Pattern ① (Basic Break) — what it is
The concept is simple.
“Confirm a sign that the upward momentum is stopping and aim for a reversal.”
The concrete conditions are as follows.
For a short entry
First, look for a two-candle pattern where both the high and the low have risen (two candles with rising highs and lows).Two candlesImagine an upward parallelogram.
Next, when the low of the second candle is breached and closed by the end of the third candle, this is a signal toenter short.
The key is “confirmed by the close.” If there’s a temporary break below the low by a wick but the close returns above, you do not enter. This is a very important rule to avoid being misled by wicks.
There are also conditions for candlestick color (bullish/bearish).
For other exit timings and other entry patterns, see the product on GoGoJangan.
→Simple Candlestick Trade Spectrum
Ranking 2: Fibonacci
Second place is Fibonacci.
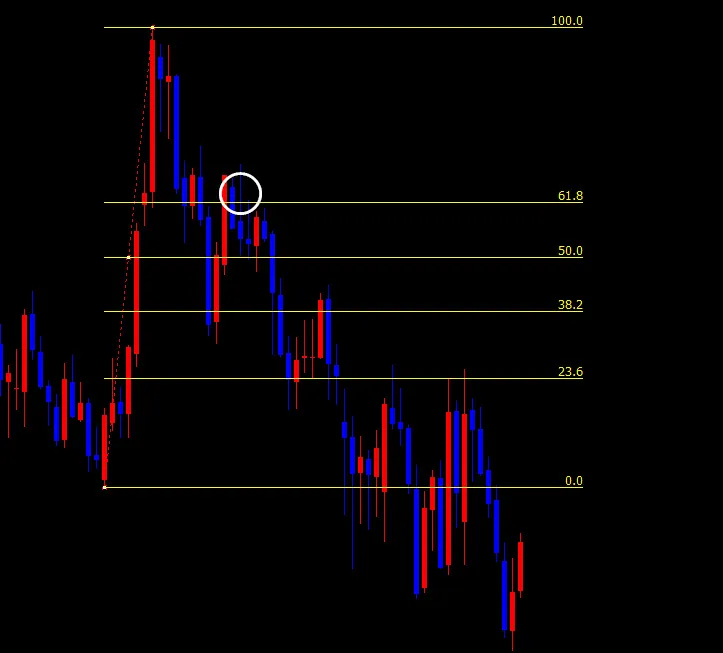
What makes Fibonacci superior isit can measure depth of pullbacks and retracements numerically.
After a price advance, no one knows how far it will pull back. But with Fibonacci, you can pre-define points where reversals are likely at specific price levels like 38.2%, 50%, 61.8%.
Particularly notable isthe 61.8% line, called the Golden Ratio, common in nature. In FX, prices often reverse around this line, and because many traders are watching it, it has a strong corroborating basis.
Ranking 3: Pivot
Third place is Pivot.
Pivot’s strength lies inthe calculation is fixed, so anyone using it will see the same line.
It is automatically calculated from the previous day's high, low, and close, leaving no room for personal subjectivity.
Most importantly,institutional investors and bank traders also reference pivots, making them effective as support and resistance because many professionals watch the same lines.
If you draw pivots based on the previous day’s daily chart, you’ll see them become support/resistance on the next day’s 15-minute chart.
Ranking 4: RSI divergence
Fourth place is RSI divergence.
You may wonder, “Why not MACD?” I intentionally chose RSI for this reason. I’ll compare it with MACD to explain.
RSI vs MACD — why RSI fits better
What RSI excels at
RSI’s setting value is fixed at 14 as an industry standard. Traders worldwide view with the same setting, making it one of the indicators with the least person-to-person variance.
The judgment criteria are clear: over 70 is overbought, under 30 is oversold. This shared standard minimizes interpretation drift when judging divergences.
Why MACD is slightly inferior
MACD has three settings: short-term, long-term, and signal. Commonly 12, 26, 9, but traders vary this.
Also, MACD displays results based on EMA twice, which introduces more lag than RSI. From the article’s focus on simplicity and clear basis, RSI is more suitable.
What divergence means
Divergence is when price movement and RSI movement move in opposite directions.
Look at the chart below. GBPUSD daily chart.
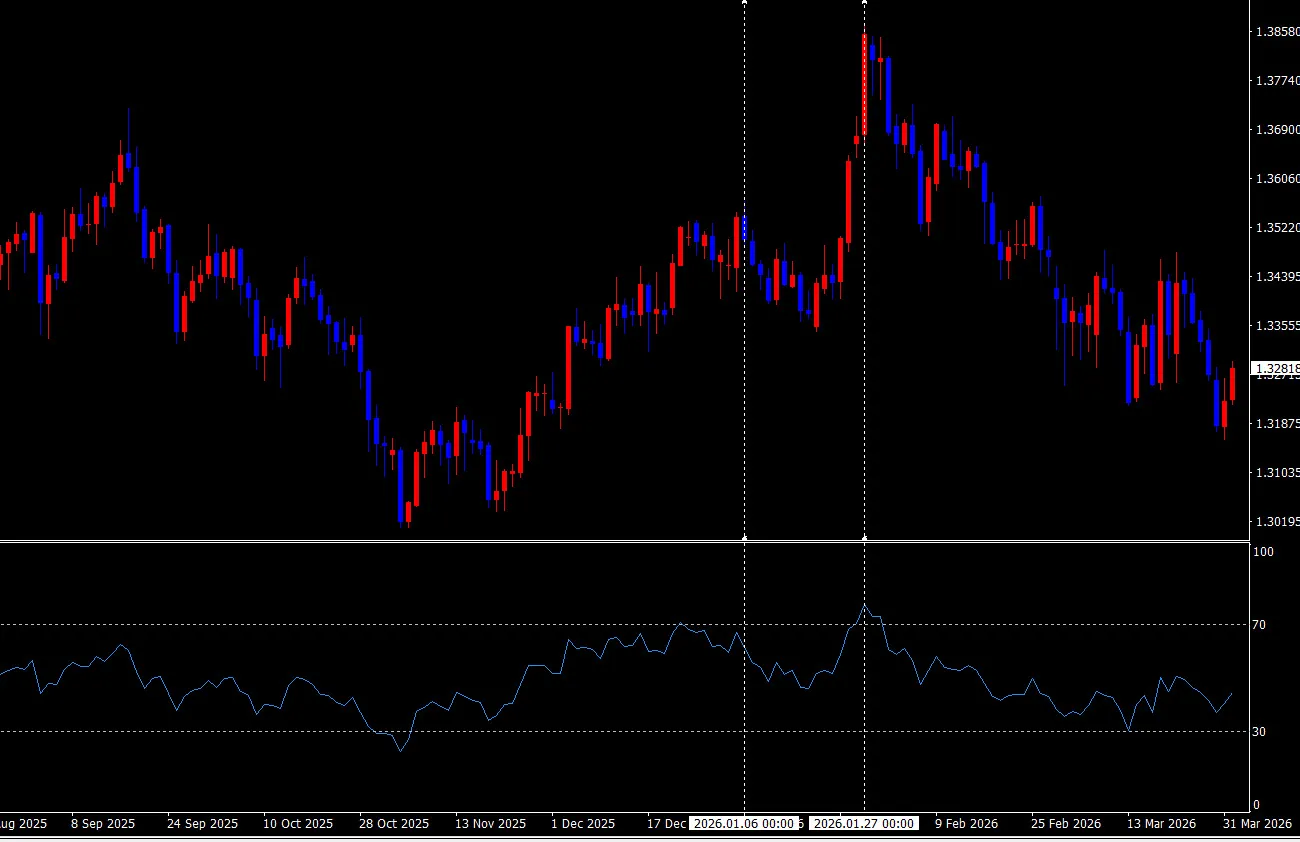
Around Jan 6 (left vertical line)Price makes a new high. RSI is around 65.
Around Jan 27 (right vertical line)Price makes a new high even higher than Jan 6 (around 1.3850). But RSI is around 71–72, rising only slightly compared to the price increase.
That is to say,price rose extensively while RSI barely rose.
This divergence between the price’s rise and RSI’s rise signals internal weakness in the upward momentum.
And afterward, the price fell sharply.
Practical steps to simplify FX methods
“I understand simple methods are better. But how do I narrow down to one?”
Here are concrete practical steps.
FX is about mastering one method — the shortcut to success
Are you becoming a “method gypsy”?
A method gypsy is someone who, after one method fails, immediately starts looking for another one.
To be honest, for the first 2–3 years I was completely a method gypsy. I’d think, “This method lost three times in a row. It doesn’t suit me,” and move to another. That cycle.
But after more than 10 years, I learned the following:
It was not that the method was bad, but that I gave up before mastering it.
Step 1: Demo trade 100 times under the same conditions
First, try the same conditions 100 times in a demo without using real money.
100 times may seem large, but it’s the minimum. With too few samples, judging that a method is unusable will be a mistaken conclusion from occasional losses.
After 100 trials, to see the method’s traits emerges. You’ll know in what market conditions it works well and in what conditions it doesn’t.
Step 2: Keep a trading log and record patterns
Record 100 trades.
What to record: entry conditions, result (win/loss), market environment at that time (trend or range) — these three are enough.
Reviewing the records will reveal patterns like “this condition tends to win.” This becomes your data-driven justification.
Step 3: Narrow to winning patterns and go live
Only enter during the conditions that were shown as likely to win during Step 2, and move to live trading.
At this time, the crucial judgment is not to enter under conditions that tend to lose. Mastering a method also means knowing where not to enter.
For me, after 10+ years, the state of mastery is when I can look at a chart and instantly decide, “these conditions are met” or “not applicable.” It takes time, but focusing on one method will make it clear eventually.
FX method simplification summary — when in doubt, focus on one and master it
To summarize what this article has conveyed:
FX methods are strongest when simple. Complex strategies fail because they slow down judgment due to too much information. Indicators should be used as support, while the main basis is price action on candlesticks.
As a simple and usable FX method ranking, I presented 1) Candlestick trading, 2) Fibonacci, 3) Pivot, 4) RSI divergence.
Among them, the most straightforward and with the clearest basis is candlestick trading pattern ① (Basic Break), which is offered for free. This method requires no indicators, has clear entry conditions, and is designed for small losses and large gains. It’s best for someone who wants to master a simple FX method.
If you’re unsure, start by trying this one 100 times.
My honest conclusion from more than a decade of trading is that you achieve far better results by mastering one simple method than by juggling ten complex ones.
→Simple Candlestick Trade Spectrum