

FX Techniques are Simple and Fine|The Reason Why “Simple FX Techniques” Outperform Complicated Techniques
To you seeking a simple method for FX
When you started FX, haven't you had experiences like this?
“Maybe there’s a better method,” you think, and keep trying new methods one after another. You keep adding indicators to the chart until the screen is full of lines. You jump at phrases like “90% winning method” on YouTube or blogs and start over from scratch.
Even after more than 10 years of trading, I was exactly the same at the beginning.
Let me get to the point.
FX methods are strongest when they are simple.
In this article, I, who has over 10 years of trading experience and is also a programmer, will introduce truly usablesimpleFX methodsin ranked order.After reading this article, you might be able to picture selecting one method you should use.
FX methods are strongest when simple — why do complex strategies fail
When I first started trading, there were more than 10 indicators on the chart.
Moving averages, MACD, RSI, Bollinger Bands, Ichimoku. I seriously thought, with all of these, I wouldn’t lose.
But how did it turn out?
Every entry, there was a contradiction like “this indicator is GO, but this one is NO,” and I ended up not knowing where to enter. I also delayed exit timing, thinking “it may come back if I wait a bit longer,” without justification.
This is the main reason why complex strategies fail.
When there is too much information, the human brain pushes judgments forward.
This phenomenon, known in cognitive science as “decision paralysis,” means the more options there are, the harder it is to make the optimal decision.
FX is the same. The more indicators you have, the more ambiguous your entry basis becomes, and the slower your exit decisions become. As a result, you end up with the worst pattern: “enter vaguely, exit vaguely.”
A simple method has none of this.
Because the basis is narrowed to one or two points, decisions are quick. The exit line is clear, so your mindset won’t wobble. That’s the biggest reason why simple methods beat complex strategies.
FX strategies you don’t need many — what is truly necessary?
“Then, do I not need any method at all?”
If you think that, you’re wrong.
Trading blindly versushaving a simple methodto trade with is completely different.
Blind trading is just “I feel like it will go up, so I buy” — an entry with no reproducibility, where even if you win once, there’s no guarantee you’ll win the same way again.
On the other hand,a simple methodmeans“an explicit rule that if these conditions are met, I enter”.
Indicators should be used as “support”
Indicators aren’t absolutely unnecessary.
Signs to avoid missing entry signals, and indicators as supplemental judgment material, can be powerful allies if used correctly.
However, they are only “support.”
The main basis lies in the candlestick patterns and price movement. Indicators are used to corroborate that basis. If you reverse this order, you’ll trade driven by the indicators.
How to choose a method that suits you
Your criteria for choosing a method are threefold.
First,whether the rules are clear. The condition “if this shape appears, enter” should be something anyone can judge in the same way.
Second,whether the basis can be explained. Be able to explain in your own words why you entered at that point.
Third,whether it can be sustained. A method that’s too difficult to continue is meaningless, even if the win rate is high.
FX method ranking — 4 recommended simple and usable methods
The criteria for ranking are threefold.
Simplicity (clear rules that anyone can reproduce), low variance due to individual differences (settings and interpretations don’t vary), and compatibility with candlestick trading (ease of combining with reversal signals that are the article’s core).
Chosen by these criteria, we will introducesimpleand usableFX method ranking.
Ranking No.1 — Candlestick trading
No.1 iscandlesticktrading.
Why is it No.1?
Becauseit’s the only method that can base its rationale on price itself, without relying on indicator values.
Moving averages are historic averages. RSI, MACD all display results calculated from prices in the past. But candlesticks convey the current moment’s battle between buyers and sellers as it is.
Here, I will freely share the candlestick trading method I have actually used for over 10 years (Pattern ① Basic Break).
What is Entry Pattern ① (Basic Break)
The idea behind this pattern is simple.
“Confirm a sign that the bullish momentum has stopped, and aim for a reversal”
The specific conditions are as follows.
For a sell entry
First, look for a combination of two candles where both the high and the low have risen (two candles with higher highs and higher lows). Imagine an upward-sloping parallelogram.
Next, when the low of the second candle is broken and closed below by the close of the third candle, that is the sell entry signal.
The key point is “closed by the close.” If the price briefly dips below using the wick but closes higher, you do not enter. This is a very important rule to prevent getting fooled by wicks.
There are conditions on the color of the candlestick (bullish or bearish).
For other entry patterns, and the exit timing, they are listed on GoGoJiang (GogoJyan).
→Simple Candlestick Trade Spectrum
Ranking No.2 — Fibonacci
No.2 is Fibonacci.
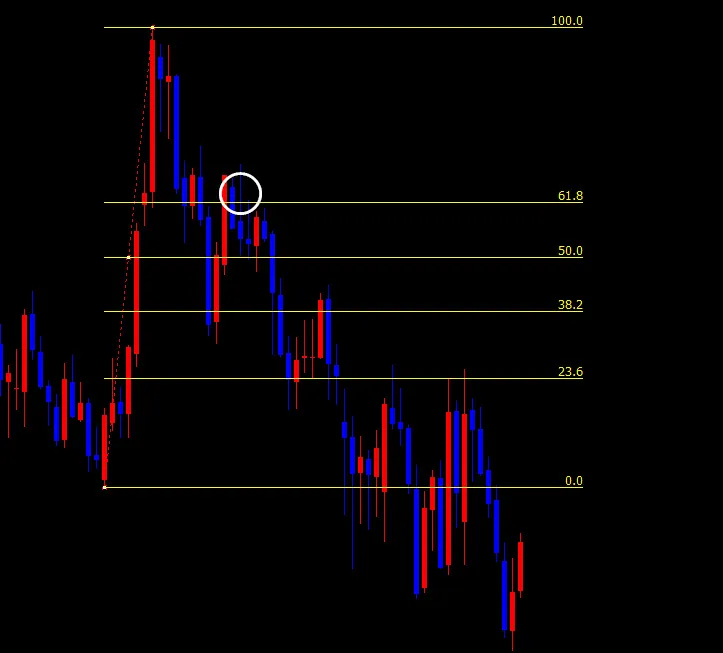
What makes Fibonacci excellent isit can quantify pullbacks and retraces.
After a price rise, no one knows how deep a pullback will be. But using Fibonacci you can pre-know levels at which price tends to rebound: 38.2%, 50%, 61.8%.
Particularly notable isthe 61.8% line.
This is the “golden ratio” found in nature, and many traders worldwide are aware of it, making it a robust justification for price reversals.
Ranking No.3 — Pivot
Ranking No.3 is Pivot.
The reason Pivot is excellent isthe calculation is fixed, so everyone sees the same line.
Since it’s automatically calculated from the previous day’s high, low, and close, there is no room for personal subjectivity.
And most importantly,institutional investors and bank traders also refer to Pivot, so supports and resistances tend to function well because many professionals watch the same line.
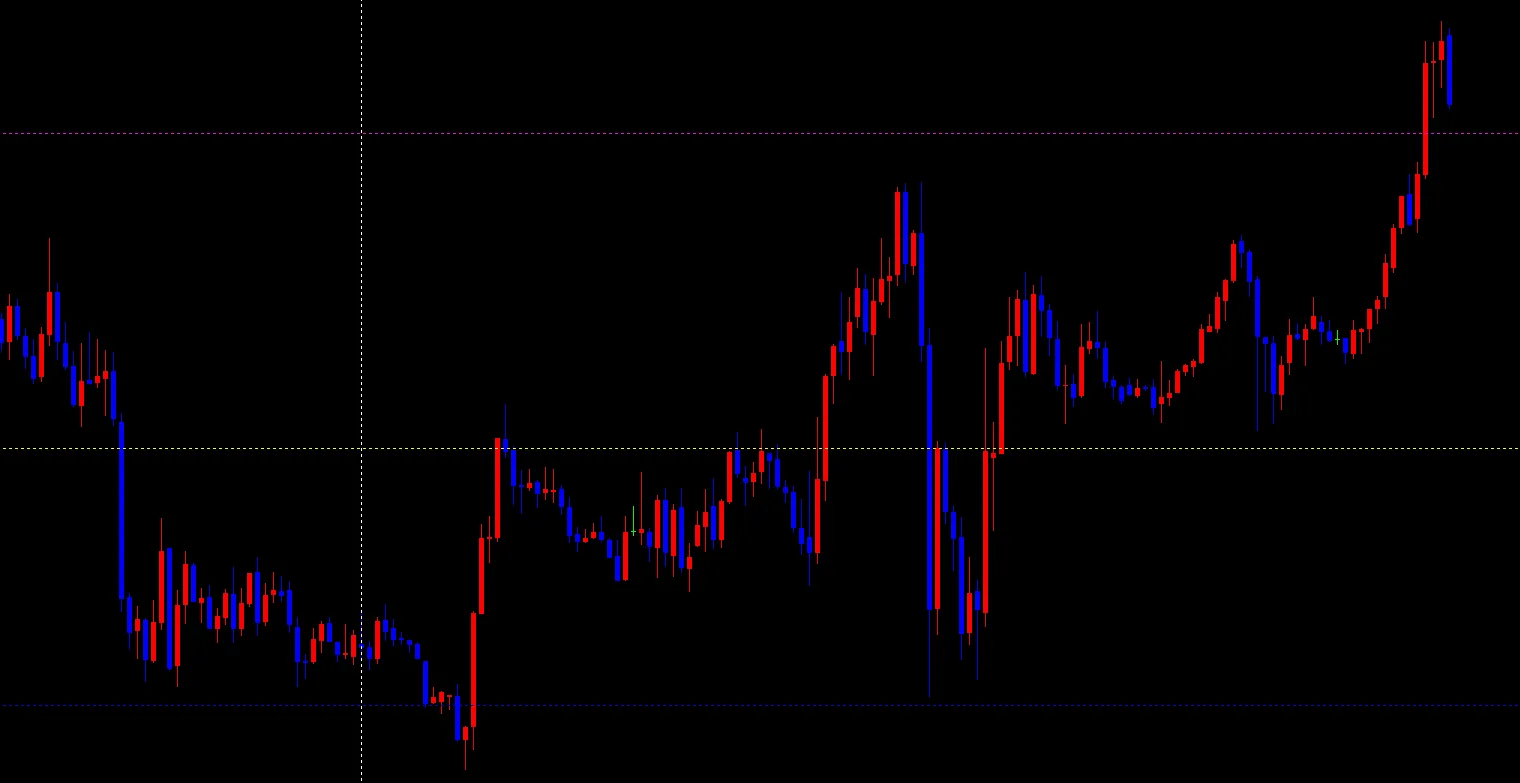
When you draw pivots based on the previous day’s daily chart, you’ll see them become resistance/support on the next day (15-minute chart).
Ranking No.4 — RSI divergence
Ranking No.4 is RSI divergence.
If you’re reading this and thinking, “Why not MACD?” you’re not alone. This article deliberately selects RSI. I’ll explain why by comparing it with MACD.
RSI vs MACD — why RSI is more suitable
Strengths of RSI
RSI’s setting value of 14 is the industry standard and is almost fixed. Traders worldwide monitor with the same setting, so individual judgment variances are minimized.
The decision criteria are also clear. Over 70 means overbought, under 30 means oversold, and this standard is globally accepted. Because divergences are judged based on this standard, interpretation is less prone to deviation.
Why MACD is somewhat inferior
MACD has three settings: short-term, long-term, and signal. Typically “12, 26, 9” are standard, but settings vary among traders.
Also, MACD shows results calculated from EMA twice, so it has more lag than RSI. From the perspective of the article’s emphasis on simplicity and clear basis, RSI is more appropriate.
What is divergence?
Divergence is when price movement and RSI movement move in opposite directions.
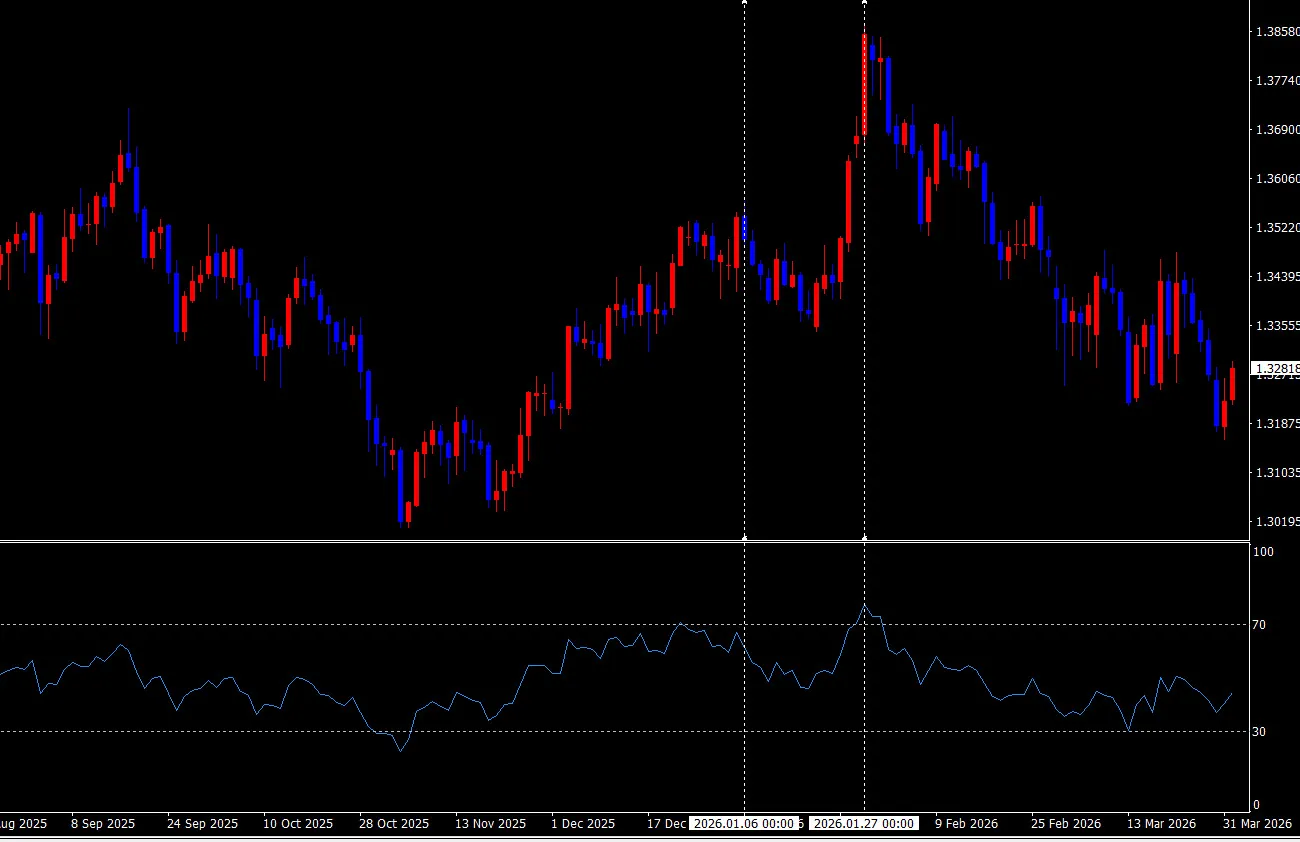
Around January 6 (left vertical line)Price makes a new high. RSI is around the 65 area.
Around January 27 (right vertical line)Price makes an even higher high (around 1.3850). But RSI is around 71–72, rising only modestly compared to price.
In other words,price has risen so much, yet RSI has risen only a little.
This divergence between price rise and RSI rise is a sign that upward momentum is weakening from within.
And afterward, price plunged.
Practical steps to simplify FX methods
“I know simple methods are best. But how do I narrow it down?”
Here, I’ll share concrete practical steps.
FX is a shortcut to success by mastering one method
Are you becoming a “method gypsy”?
A method gypsy is someone who, after a few losses with one method, immediately starts looking for another method.
To be honest, for the first 2–3 years after I started trading, I was completely a method gypsy. “I lost three times in a row with this method. This method doesn’t suit me,” so I looked for another method, and so on.
But after more than 10 years of trading, I realized something.
It wasn’t the method itself that was bad; I had given up before truly mastering it.
Step 1 — 100 trials in a demo to verify the conditions
First, try the same conditions 100 times in a demo without using real funds.
100 times might seem large, but it’s the minimum. With too few samples, a single loss can lead to erroneous judgments that “this method can’t be used.”
If you test 100 times, you’ll see the method’s characteristics. You’ll accumulate data on when it works best and when it doesn’t.
Step 2 — Keep a trade journal and record patterns
Record 100 trades.
What to record: entry conditions, result (win/loss), and market condition at that time (trend or range). Three data points are enough.
Reviewing the records will reveal patterns like “these conditions tend to win,” which becomes the basis for your own data-driven evidence.
Step 3 — Narrow to winning patterns and go live
From Step 2, focus only on the conditions that tended to win, and move to live trading.
At this stage, the most important decision is not entering under conditions that tend to lose. Mastering a method also means knowing where not to enter.
From my experience of more than 10 years, the mastered state is when you can look at a chart and immediately decide, “this condition is met” or “not relevant,” without hesitation. It takes time to reach, but if you focus on one method, you will surely get there.
FX method simplification summary — when in doubt, pick one and master it
To summarize what this article conveys.
FX methods are strongest when simple. Complex strategies fail because information overload slows decision-making. Indicators are for support, and the main basis lies in the candlestick price itself.
As a simple and usable FX method ranking, we introduced No.1 candlestick trading, No.2 Fibonacci, No.3 Pivot, No.4 RSI divergence.
Among them, the most simple and clearly justified method is the candlestick trading Pattern ① (Basic Break), which is now freely available. This method requires no indicators, has explicit entry conditions, and is designed to maximize profit while limiting risk, making it most suitable for those who want to master one simple FX method.
If you’re unsure, start by trying this one 100 times.
From years of trading experience, mastering one simple method yields consistently better long-term results than juggling 10 complex methods.
→Simple Candlestick Trade Spectrum