

Gold Analysis 2026/03/31
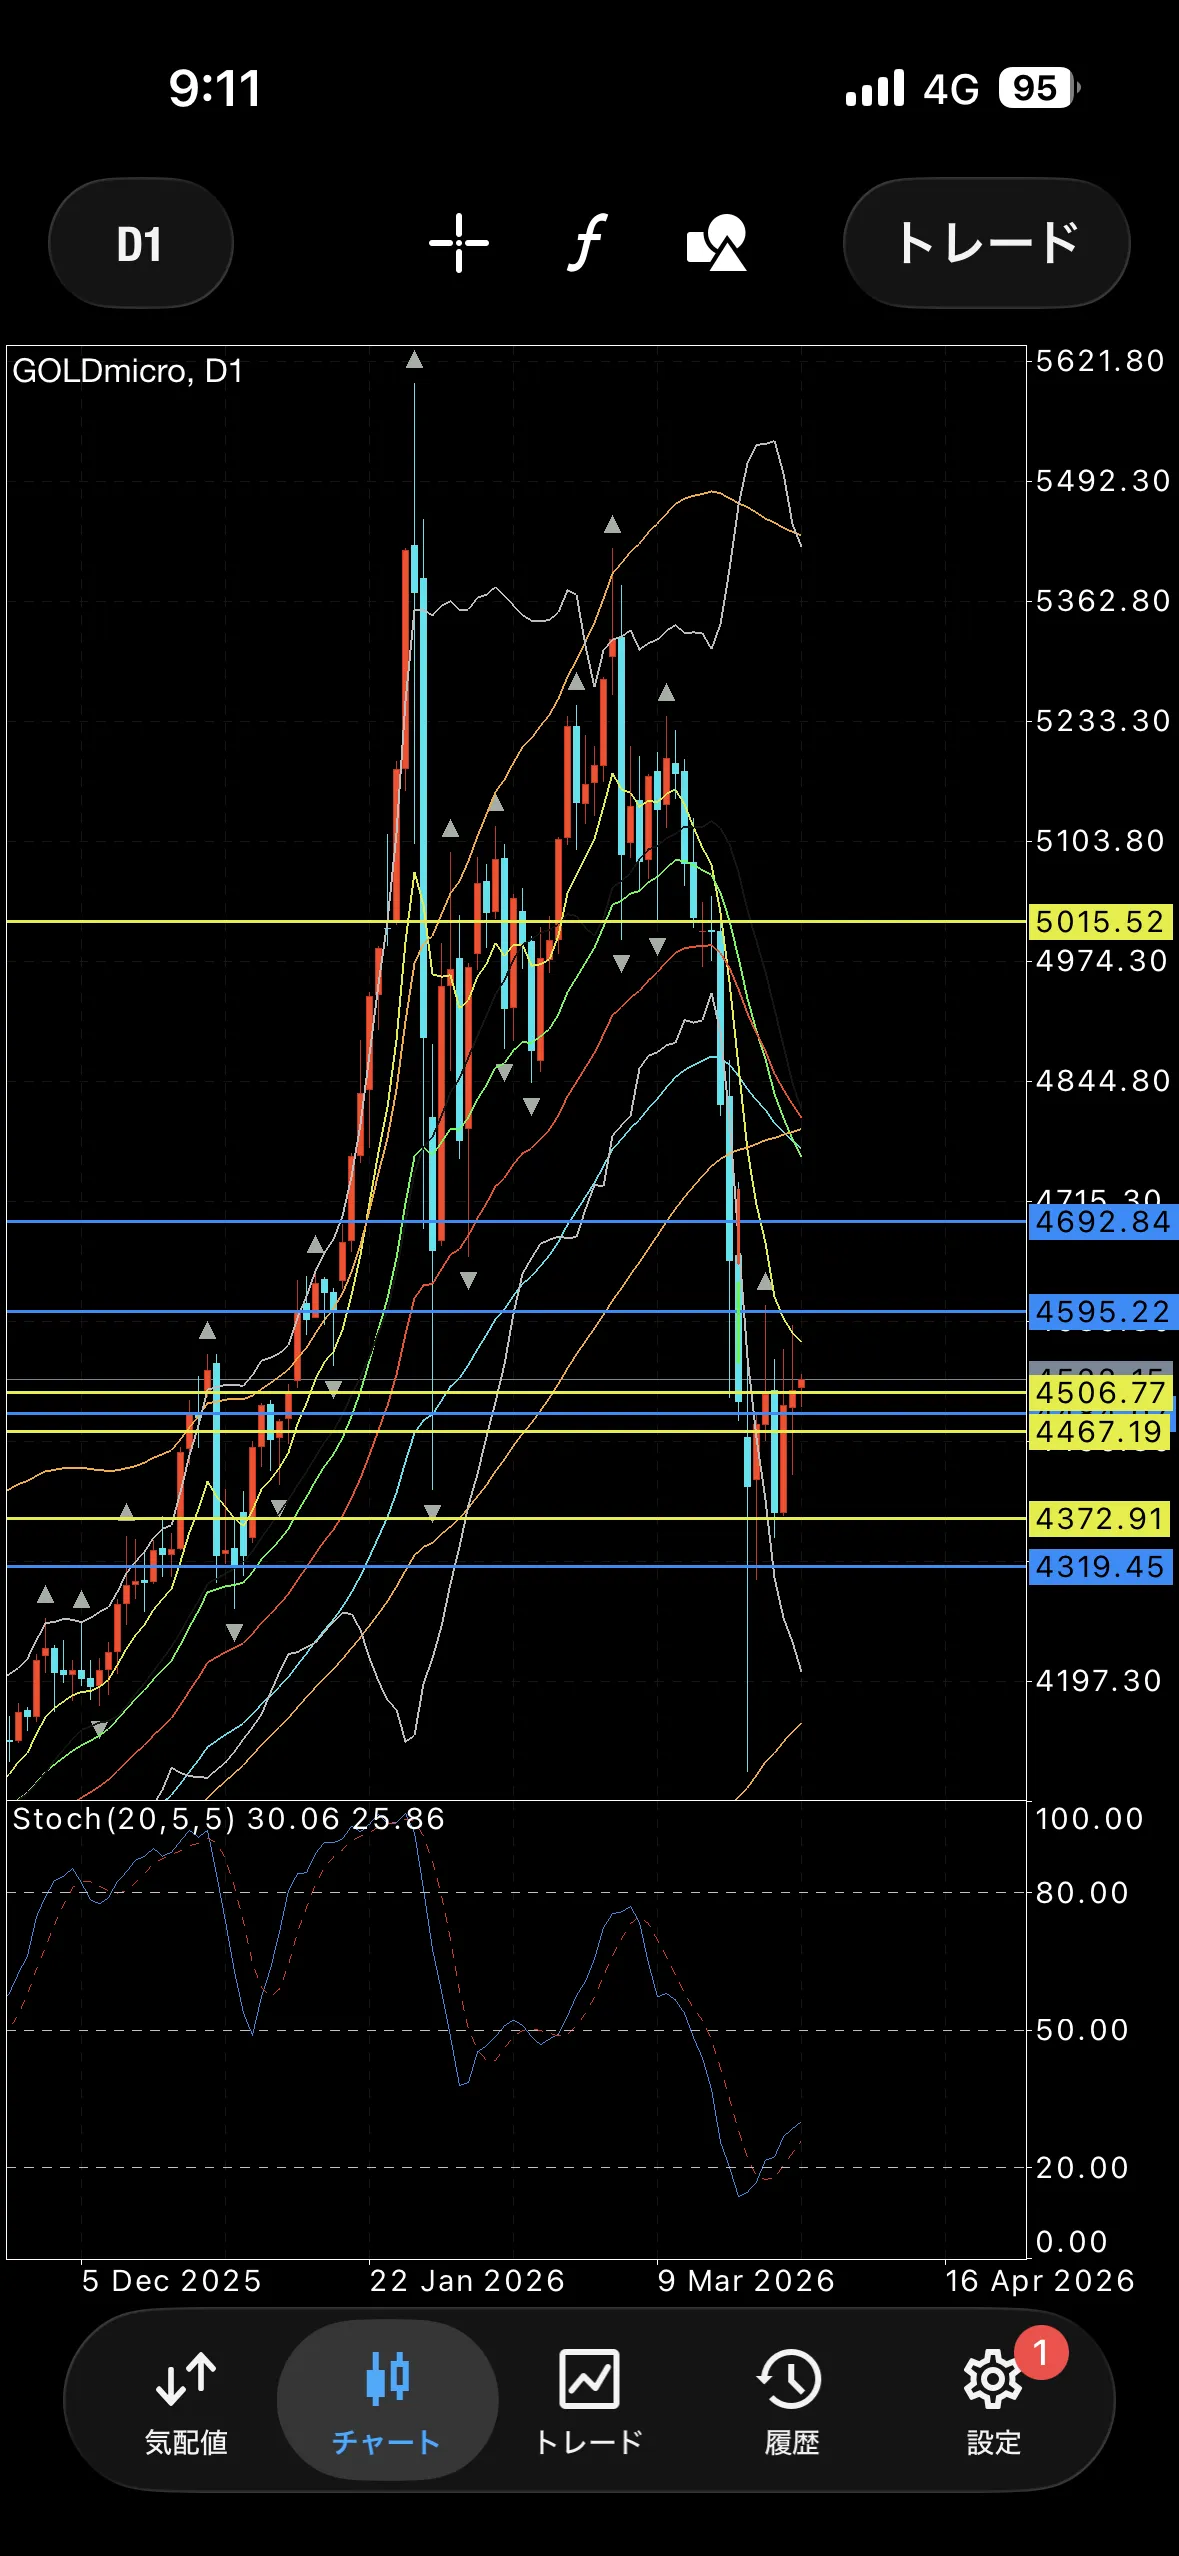
【Yesterday's daily chart】
It was a bullish candlestick with a tail.
Range suggests, but since it is below the 9MA, it is assumed to be heading downward.
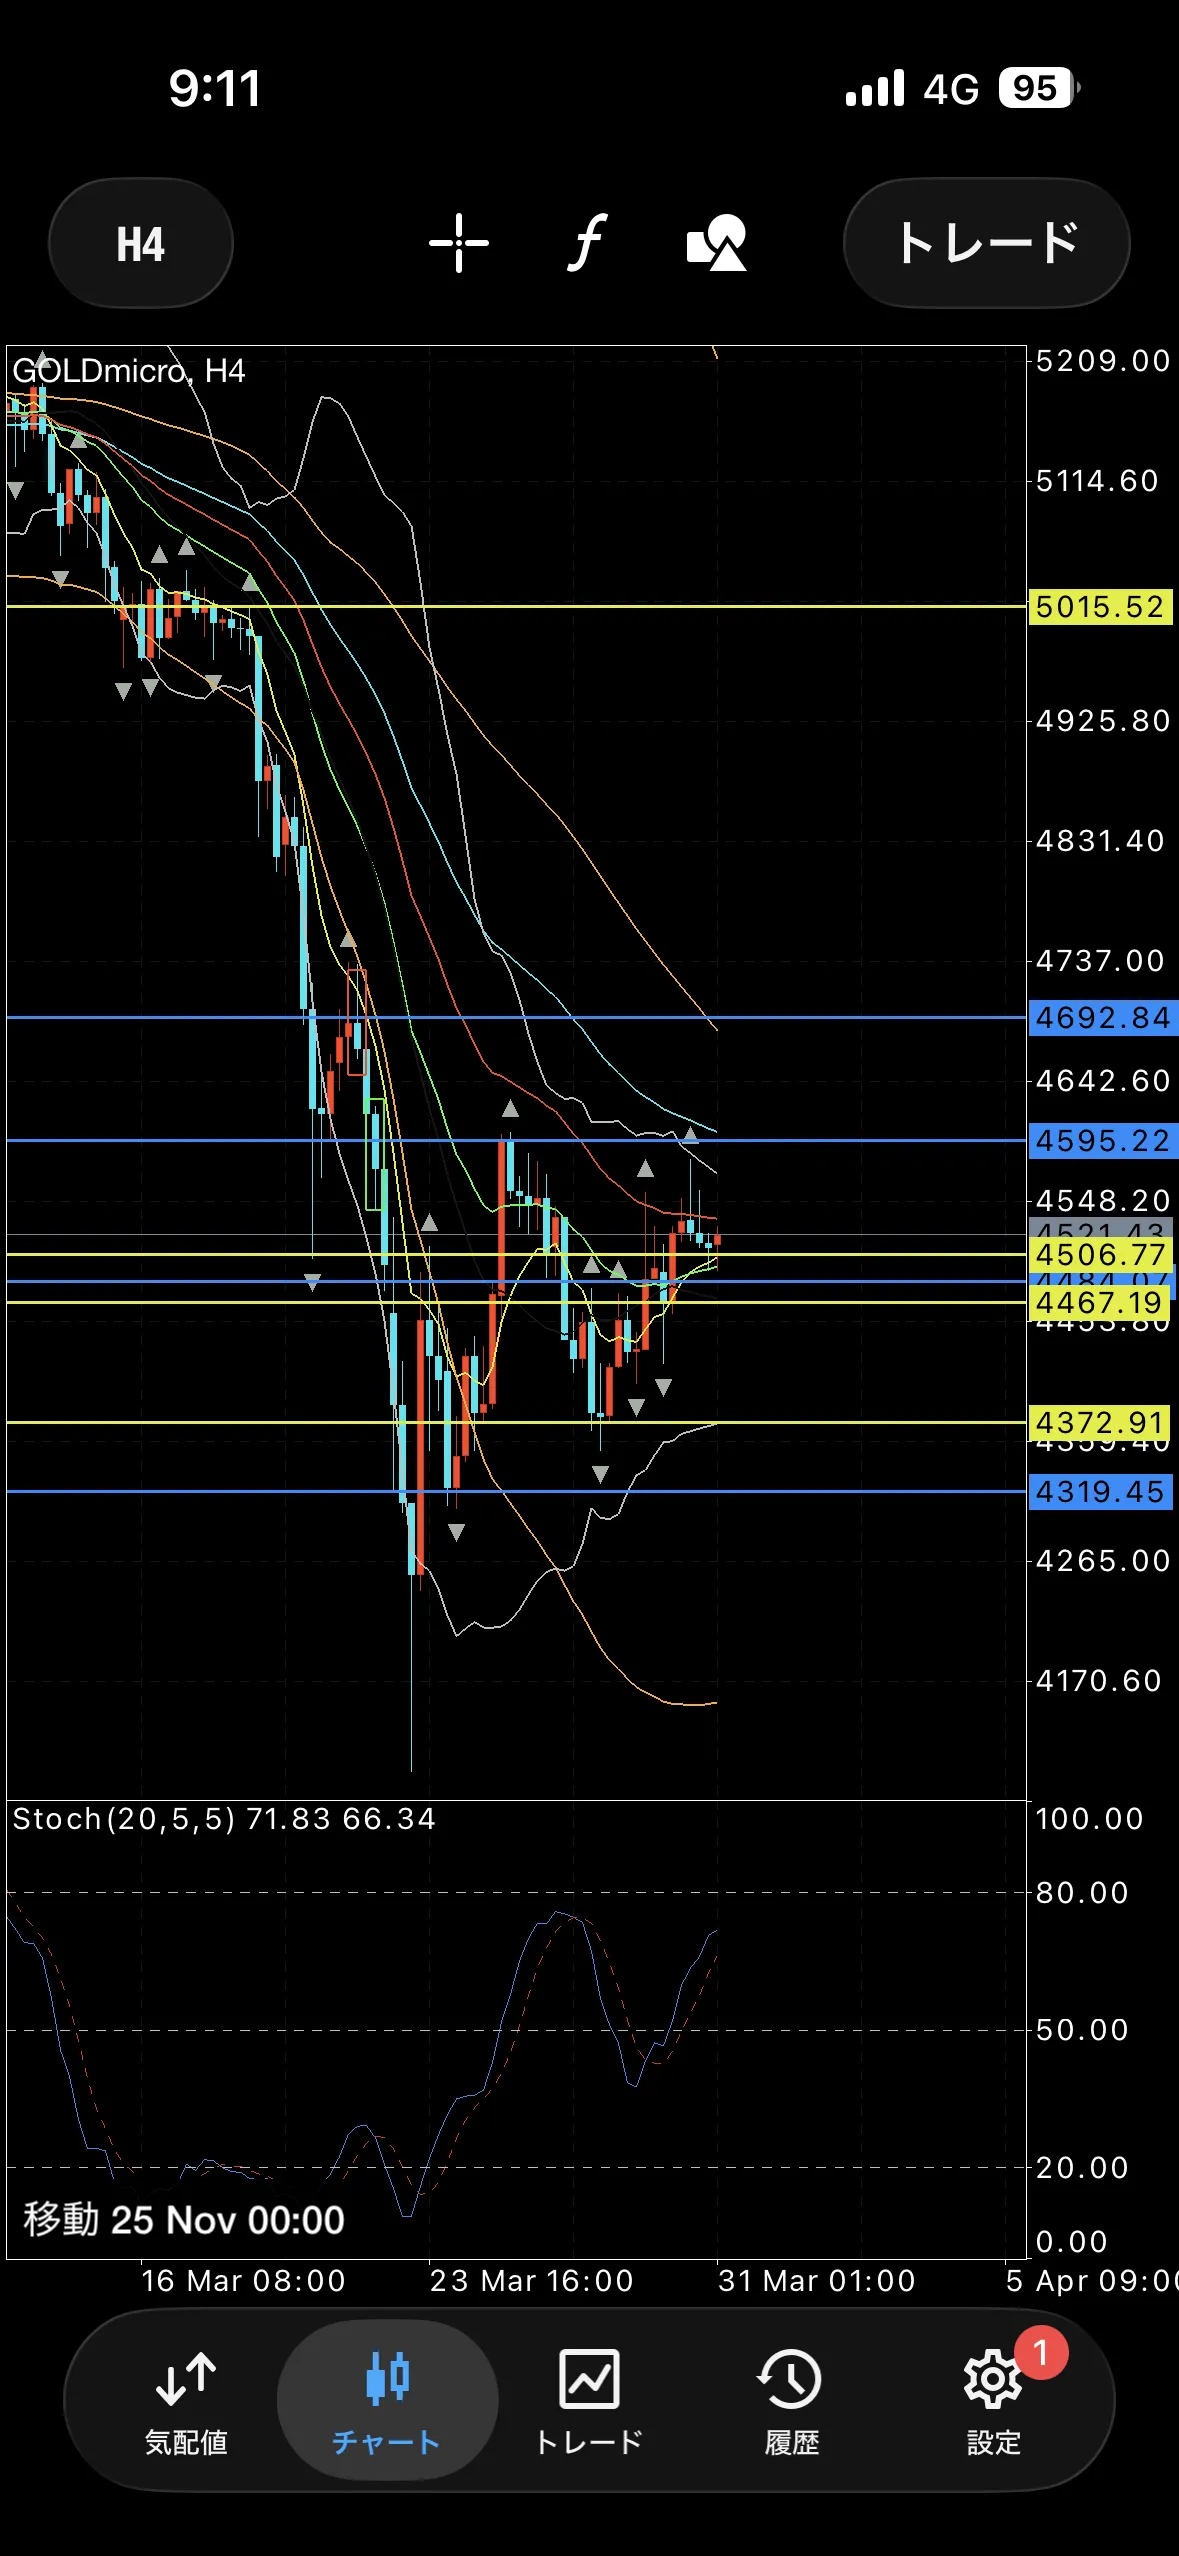
【4-hour chart】
On the daily chart, it is stopped near the 40MA. Moreover, since it is in the PO (price open) state, the bias is bearish.
If aiming for a short, I think targeting a minor pullback after the 9MA break is fine.
Oscillator has turned up, so waiting a bit longer feels reasonable.
BB indicates a range.
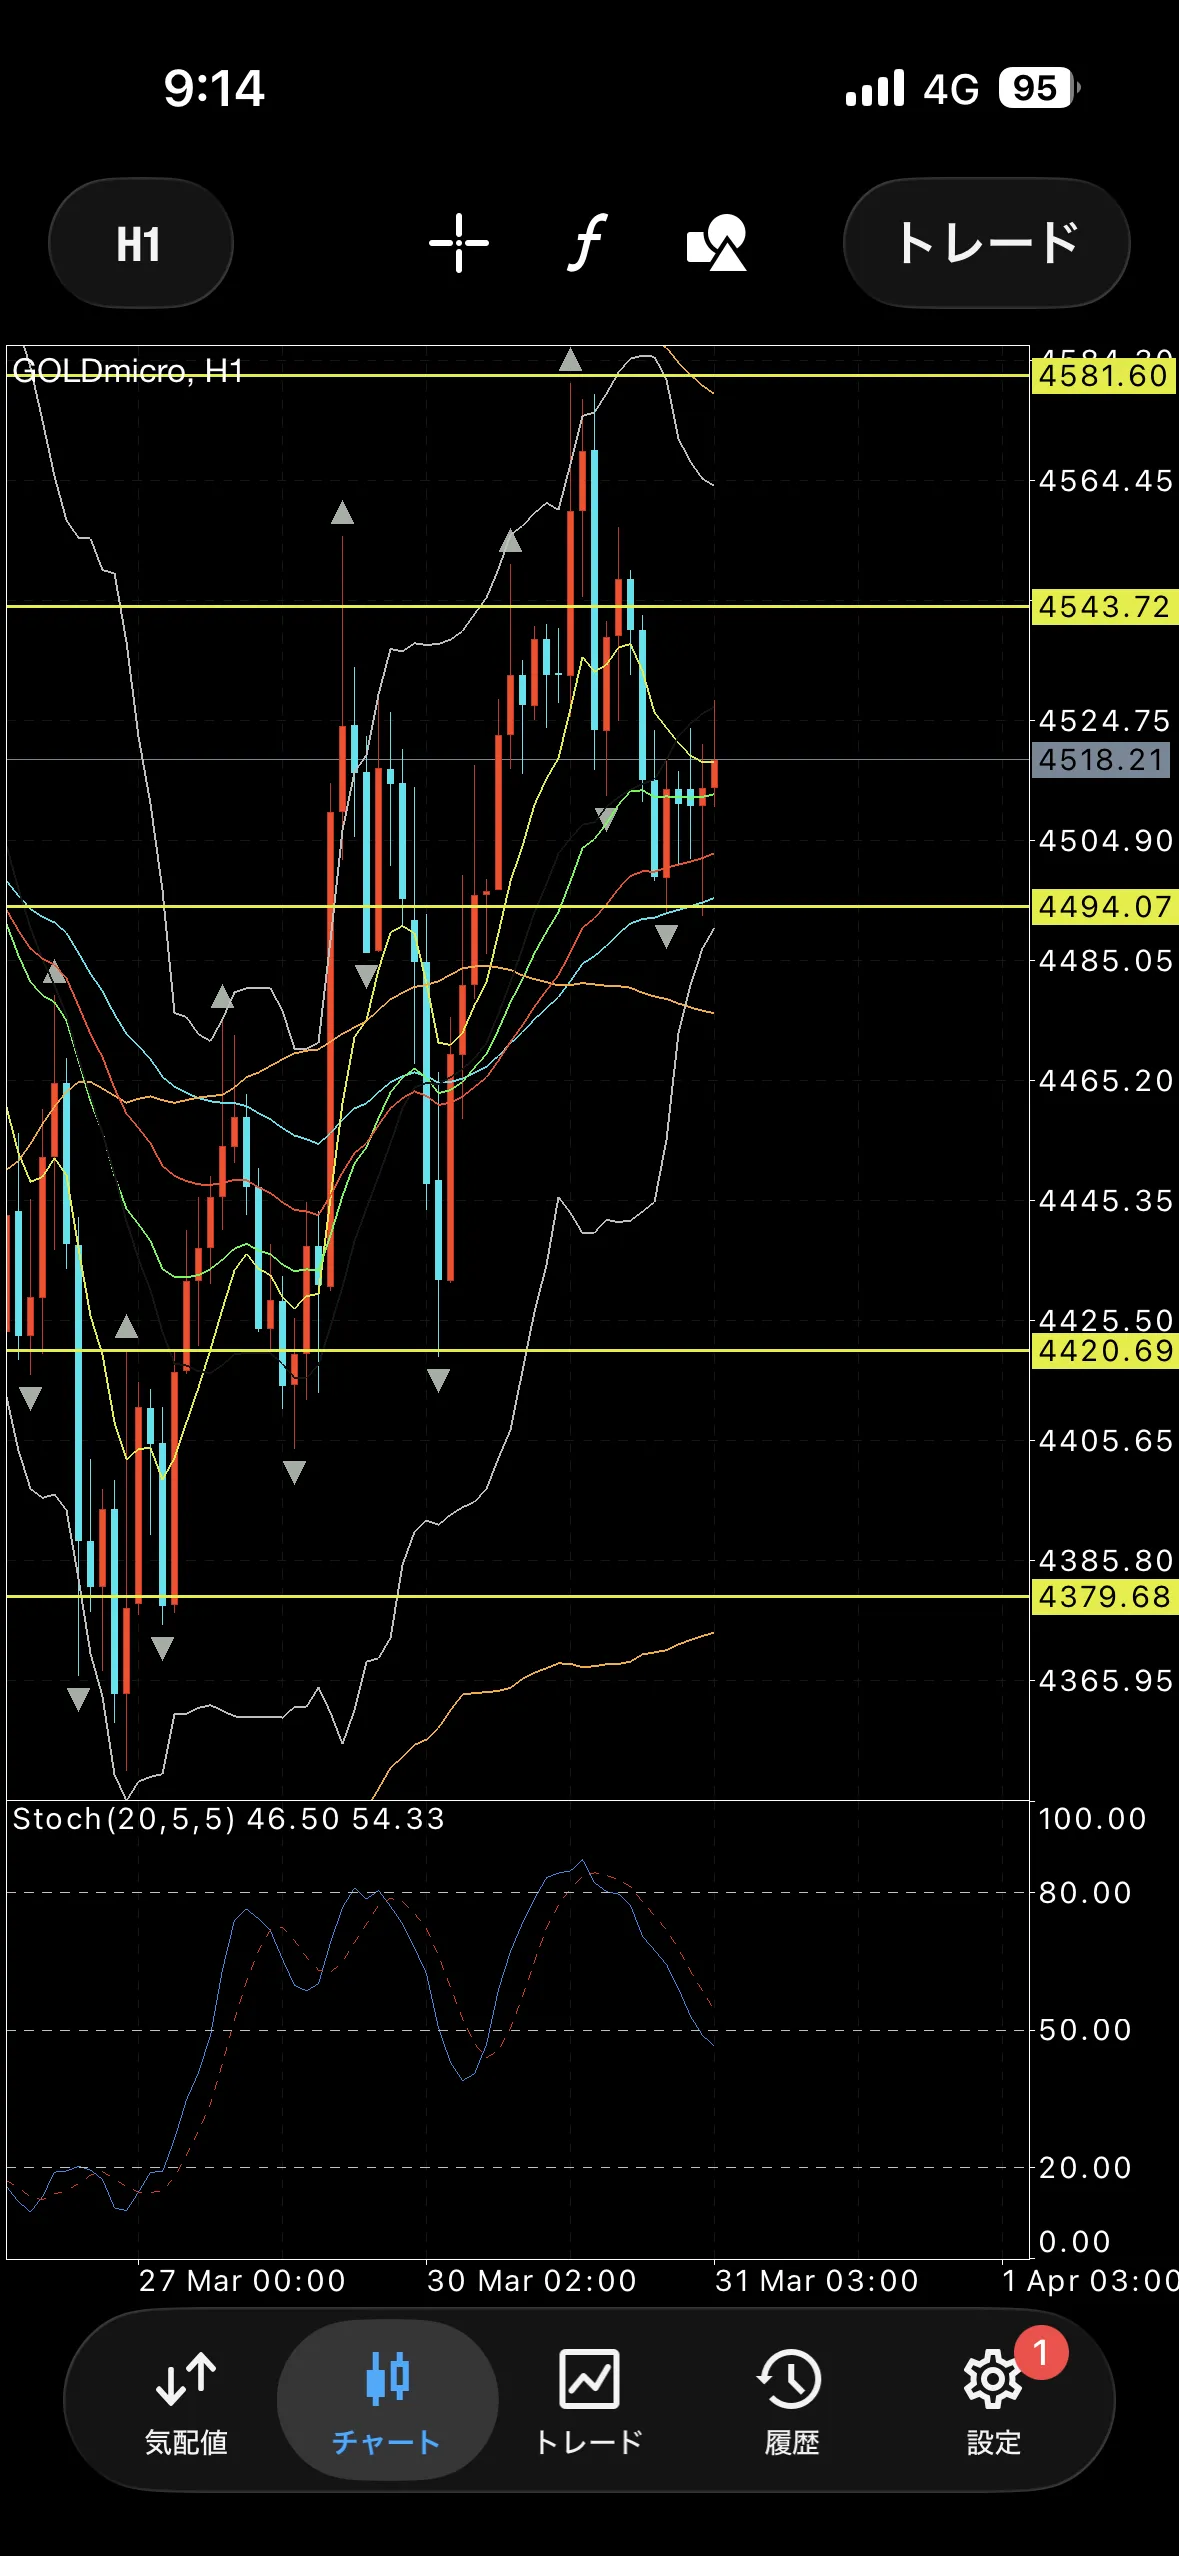
【1-hour chart】
BB lower band, around the 4-hour BB middle.
If this level breaks downward, using 4494 as the neck line for a head-and-shoulders setup could lead to a decline toward around 4420–4440?
【Key price levels】
4581
4543
4488
4420
4379
× ![]()