

Gold Analysis on 2026/03/30
【Previous daily chart】
Bullish candle
【View】
・Daily chart
Candlestick: bullish until it falls below 4384
MA: Short-term ↓ Mid-term ↓ Long-term ↑
Oscillator: ↓
・4-hour chart
MA: Short-term range Mid-term ↓ Long-term ↓
Oscillator: Range
【Remarks】
・Daily chart
Since it is stopping at the long-term BB 1σ and the mid-term BB -1σ, there is a possibility of rising from the upside of the bullish candle
At present, it tends to enter a range due to the clash between short-term and mid-to-long-term
・4-hour chart
With higher lows, as long as it does not fall below around 4374, bullish outlook remains
In the short term, range-bound; if it catches up to the 75MA, there is a possibility of decline again
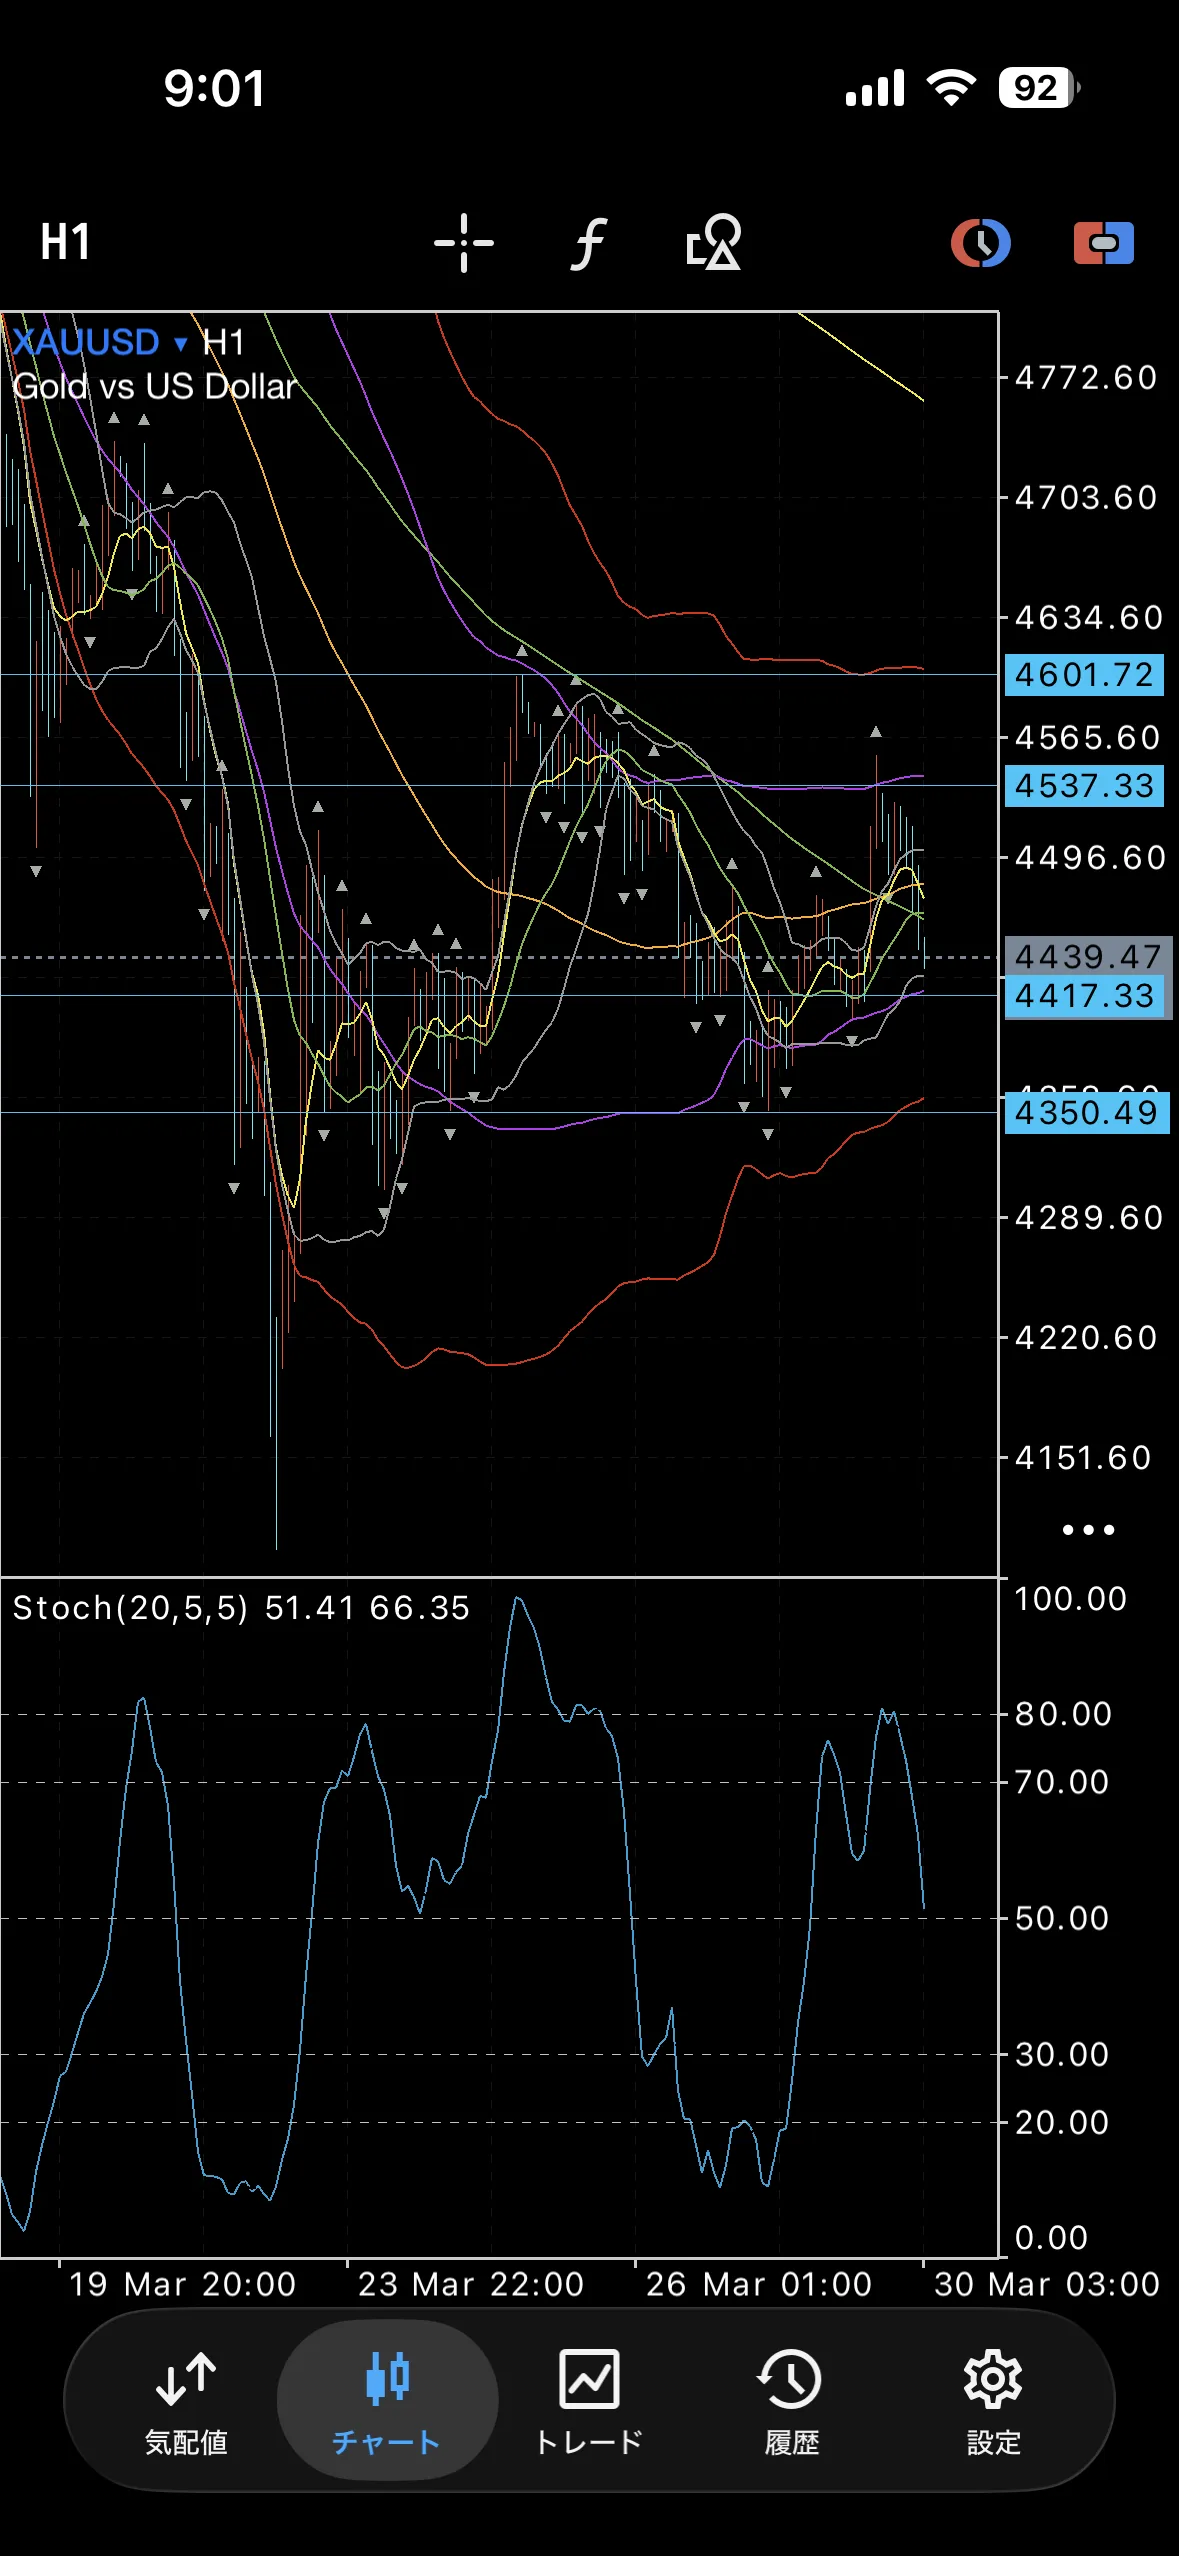
・1-hour chart
Because the 4-hour BB is parallel, it is in a range pattern
【Key price levels】
4601
4537
4517
4734