
What will gold be like on March 30 (Monday)?
Trade method using candles and volume only
You can view the full text on the product introduction page!
There are many things going on in the world, and since it’s Monday, I’ll observe and share a rough forecast. It’s closing exactly at a resistance level.
Considering the near future, on Monday it wouldn’t be surprising to open with a large gap up from above…
As I’m technically oriented, if I stick to a straightforward analysis, there are two near-term reversal points. Unless the conditions are very favorable, I won’t target from Monday. I’ll wait and see.
I found a trend reversal pattern on Friday, so I’ll analyze it.
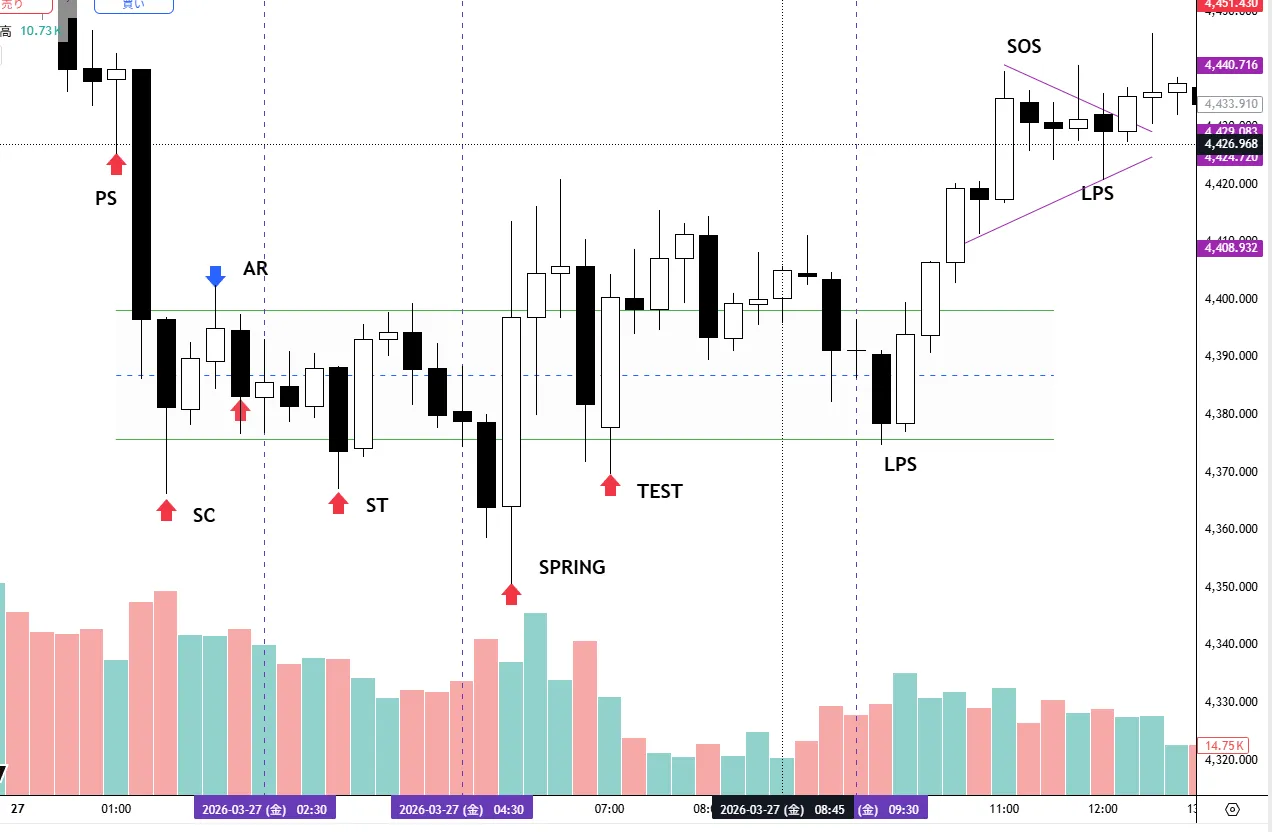
↓ 15-minute chart
↓ 5-minute chart
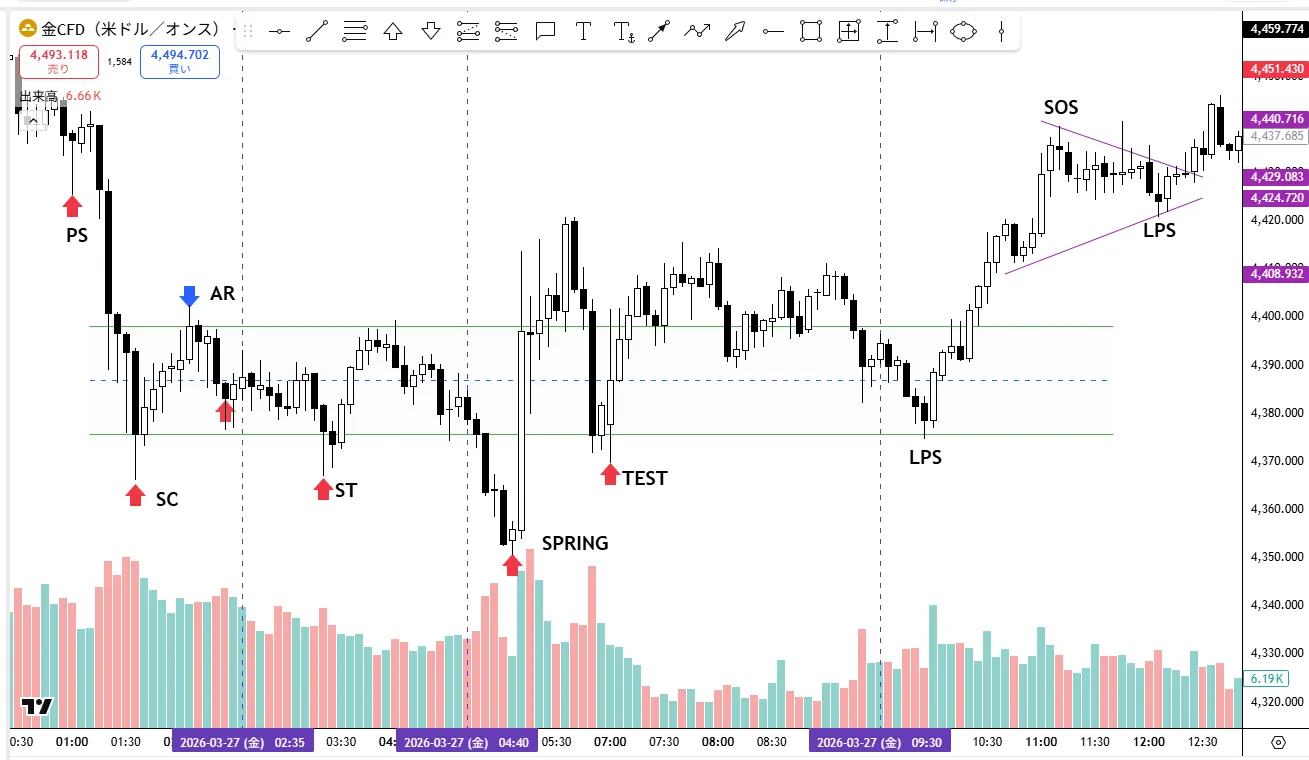
The 15-minute chart has a cleaner shape, but the 5-minute chart makes the details easier to understand.
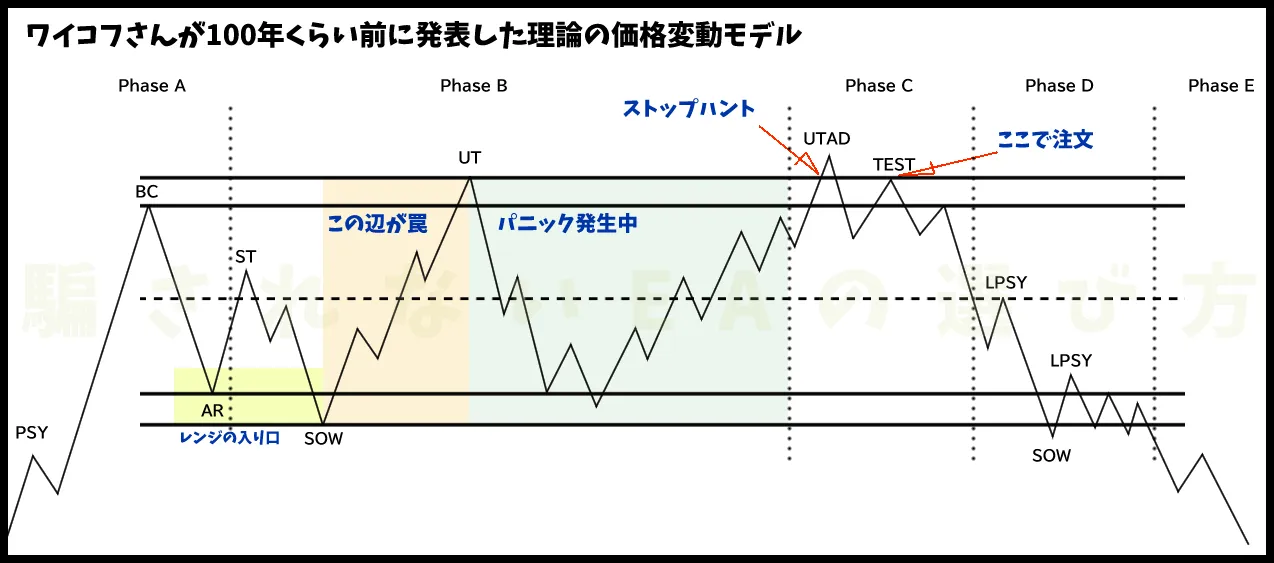
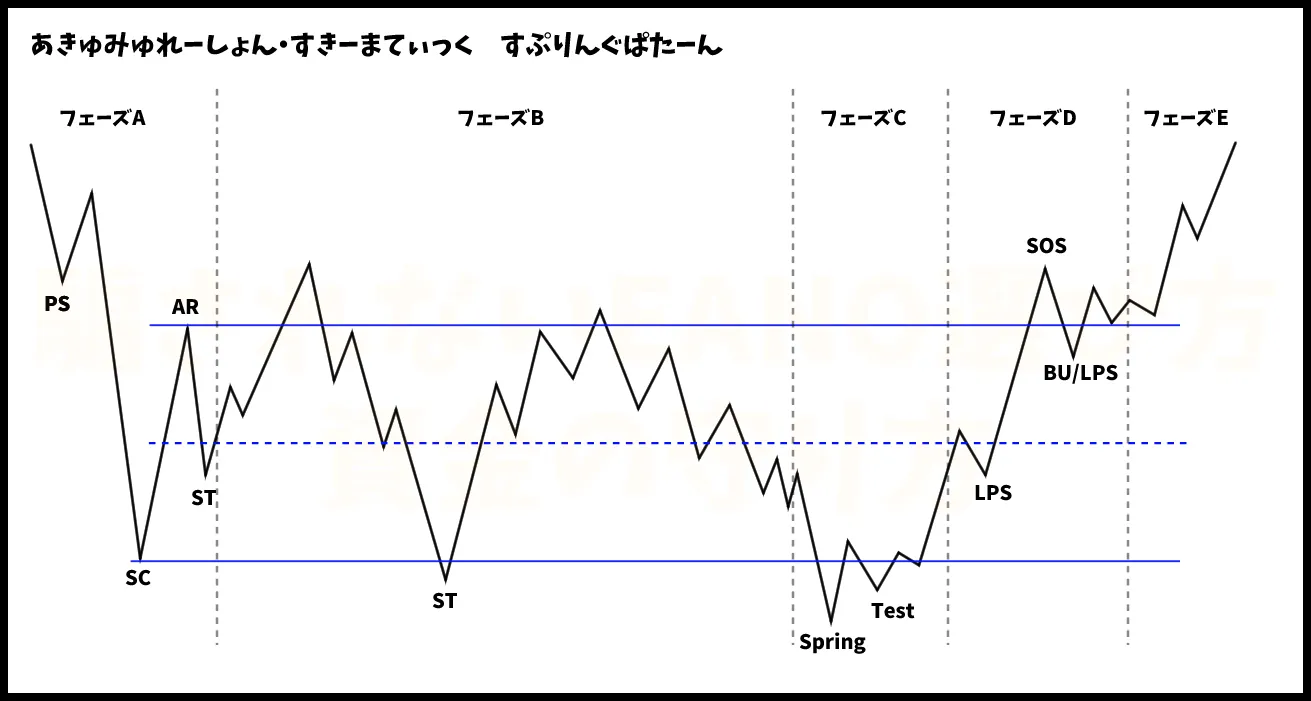
It doesn’t perfectly match 100%, but it’s a common spring reversal pattern.
At first I assigned the roles of each pattern from the 15-minute chart, but when looking at the details on the 5-minute chart, I can see there is a misalignment.
If I were to trade in real time, it’s a nonessential part, but I will correct it.
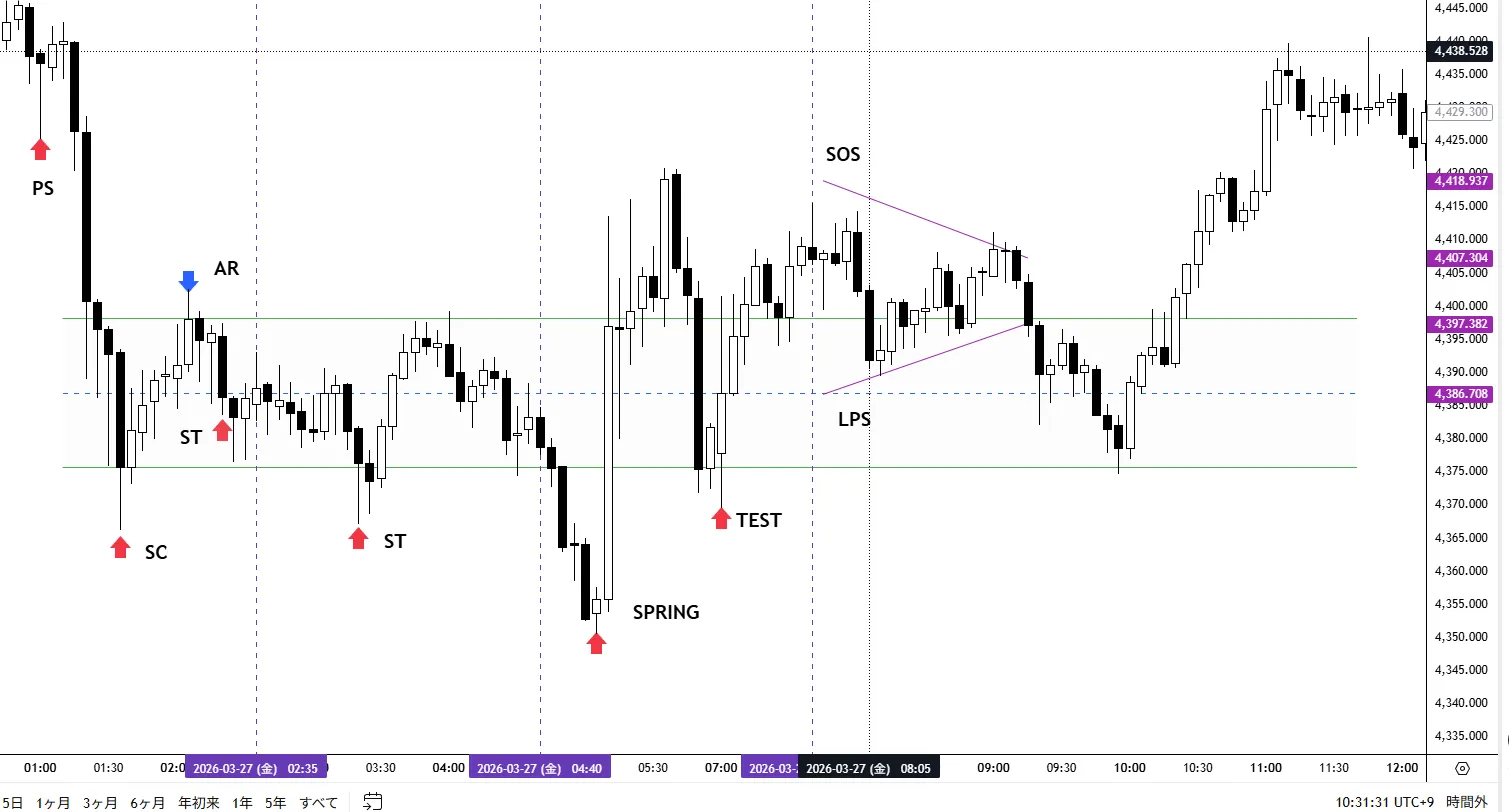
In this pattern, if trading in real time, I would be cautious because the ST in Phase B did not break the SC in A.
Looking at the PS, it is dropping vigorously, so if I view the tail as “noise,” I can see that the body is indeed lowering the price.
ST → SPRING shows a divergence.
However, in this case the drop from the PS was large, and AR did not react much, so I would be cautious and skip the TEST (assuming I were doing it in real time!).
If I can confirm a proper rise during TEST,
I would wait for it to come back and place a limit order at the body of the bullish candle, setting a trailing stop behind the wicks for the test.
Trade method using candles and volume only,
You can view the full text on the product introduction page
I wrote a book titled “How to Choose a Non-Deceptive EA and Protect Your Funds.” In the details page here, I 소개 a simple method using EMA and the earlier Wyckoff pattern indicator’s primary information shown on an actual chart. If you’re interested, please take a look!