

Explanation: Capturing the rebound from the pre-market low not by feel but by “shape” for TradingView Japanese stock intraday indicator【DaytreNAVI】
What is the most difficult moment in day trading Japanese stocks?
It is not the moment when you chase rising stocks,“After the morning selling has run its course, will the price realmente reverse?”but the moment to determine that.
Right after the market opens, price movements are fast, and news, supply and demand, themes, and expectations from the previous day are all rapidly priced in. The Tokyo Stock Exchange cash market starts the first half-day from 9:00 to 11:30, with the opening price determined by order book closings, followed by price formation in the continuous session. In other words, morning is the time when orders concentrate most, and the imbalance of supply and demand tends to show up in price movement.
That led to the creation of a TradingView-style indicator for Japanese stock day tradingDaytreNAVI.
TradingView specification: Daytrading indicator for Japanese stocks [DaytreNAVI] Morning low × RSI rebound — don’t miss the winning “buying opportunity”!
As shown on GogoJungle’s sales page, DaytreNAVI integratesvisualization of the pre-market low line, BUY detection by RSI reversal, EXIT decision by take-profit and pullback, and alertsinto one indicator focused on the pre-market. By default, pre-market hours are 9:00–10:30, BUY determination RSI defaults to 30, and EXIT is designed to be judged from both take-profit probability and pullback rate.
What DaytreNAVI targets is only the “morning low” and the first move after reversal
This indicator is not intended to signal everything all at once.
The aim is clear.
To capture only the initial move when a stock sold in the morning finds support near the morning low and reverses with RSI reversal.
On GogoJungle’s page, DaytreNAVI’s essence is summarized as“focus only on the morning low and the initial reversal”. It visualizes the reversal after selling and the battle around the low in a reproducible way.
Common mistakes in day trading include:
Buying too early before a downtrend has ended
Missing the initial rebound and chasing higher prices
Unable to take profits after a rally and getting pulled back
These three are the main ones.
DaytreNAVI reduces these mistakes by
“the morning low that is likely to act as support today”and
“the RSI reversal that is likely to trigger a reversal”displayed consistently on the same chart.
Why target the top-capitalization turnover ranking stocks
This is an important point to make DaytreNAVI even more practical in real trading.
What I find particularly effective is
to limit entry targets to “top stocks by market cap and turnover ranking”.
This “turnover ratio by market cap” is calculated as
turnover ÷ market cap, and it is a way to see how strongly funds are concentrating on a stock relative to its market cap for that day. Turnover is commonly used as a liquidity indicator (how active trading is) by dividing trading value by market cap.
What matters here is that I do not view this merely as “finding high-volume stocks.”
1. Stocks with concentrated funds tend to have their morning low function effectively
Stocks with high turnover relative to market cap are not just being traded;they have market participants’ interest focused on a single point.
Therefore, after the morning low forms, it tends to become a “watched price.”
The watched price tends to function as a support line.
If it functions as support, the initial rebound tends to be straightforward.
DaytreNAVI’s morning-low line is well-suited to visualize such “standards that market participants are aware of.”
2. Strong theme stocks tend to attract funds back even if bought in the morning
Top-ranked stocks often have some theme, catalyst, or supply-demand imbalance on the day.
In other words, even if there is profit-taking or shakeouts in the morning,there are buyers waiting in the wings.
For this type of stock, once the morning low is reached and the price stops falling,
“buy the dip”
“funds that didn’t get in at the open”
“short-term players re-entering”
tend to coincide, strengthening the rebound quality.
3. Because there is movement, EXIT rules work more reliably
DaytreNAVI not only shows BUY signals,it also visualizes EXIT via take-profit reachandpullback from the high.
This EXIT works best for stocks that move a reasonable range after a rebound.
For stocks with weak fund concentration, even if they rebound, they tend to drift sideways without much movement.
On the other hand, top market cap ranking stocks tend to have larger price moves in a short time.
That is why DaytreNAVI’s design of “buying on strength or cutting losses if not” fits well.
TradingView specification: Daytrading indicator for Japanese stocks [DaytreNAVI] Morning low × RSI rebound — don’t miss the winning “buying opportunity”!
In short, DaytreNAVI is powerful when combined with stock screening
DaytreNAVI is not万能.
Rather than applying it the same way to every stock,it tends to be more accurate when used on stocks with clear fund concentration.
My practical approach is simple.
Look at that day’stop stocks by market cap and turnover ranking.
After the morning selling, observe whether the price near the morning low holdsand confirm.
Wait for BUY signal on RSI reversal.
With this flow, the questions of “what to buy,” “where to buy,” and “where to exit” become organized.
The hardest part of day trading is being whipped around in the moment with unclear criteria.
DaytreNAVI can significantly reduce that ambiguity.
Chart Case 1: Fujikura (5803)
【Pre-market 1-minute chart on March 24, 2024】
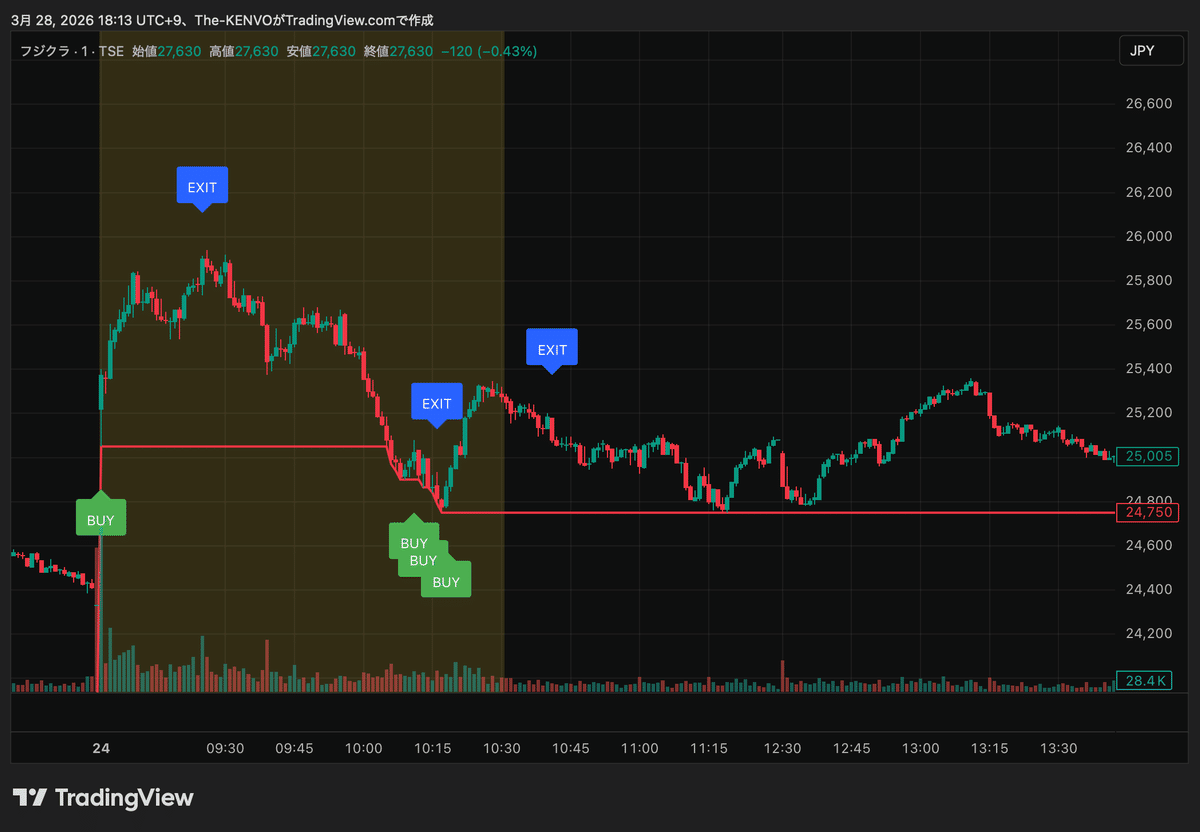
In Fujikura’s chart, after the morning selling,the morning-low line signals light up BUY multiple times near the morning low.
What this pattern indicates is not merely a contrarian move.
Even after a large sell-off, buyers come back in the lower price band, and RSI reverses.
In other words,fundamentals aren’t collapsing; they’re being absorbed as a pullback.
Moreover, thereafter the reversal occurs, and EXIT signals are clearly displayed.
This kind of chart makes DaytreNAVI’s target very easy to understand.
Especially for a stock near the market’s center like Fujikura,
the morning low becomes not just a low but a point where short-term funds reflowback into the stock tends to occur.
Therefore the reversal initial move has meaningful signals.
Chart Case 2: Kobelco Steel Works (5801)
【Pre-market 1-minute chart on March 24, 2024】
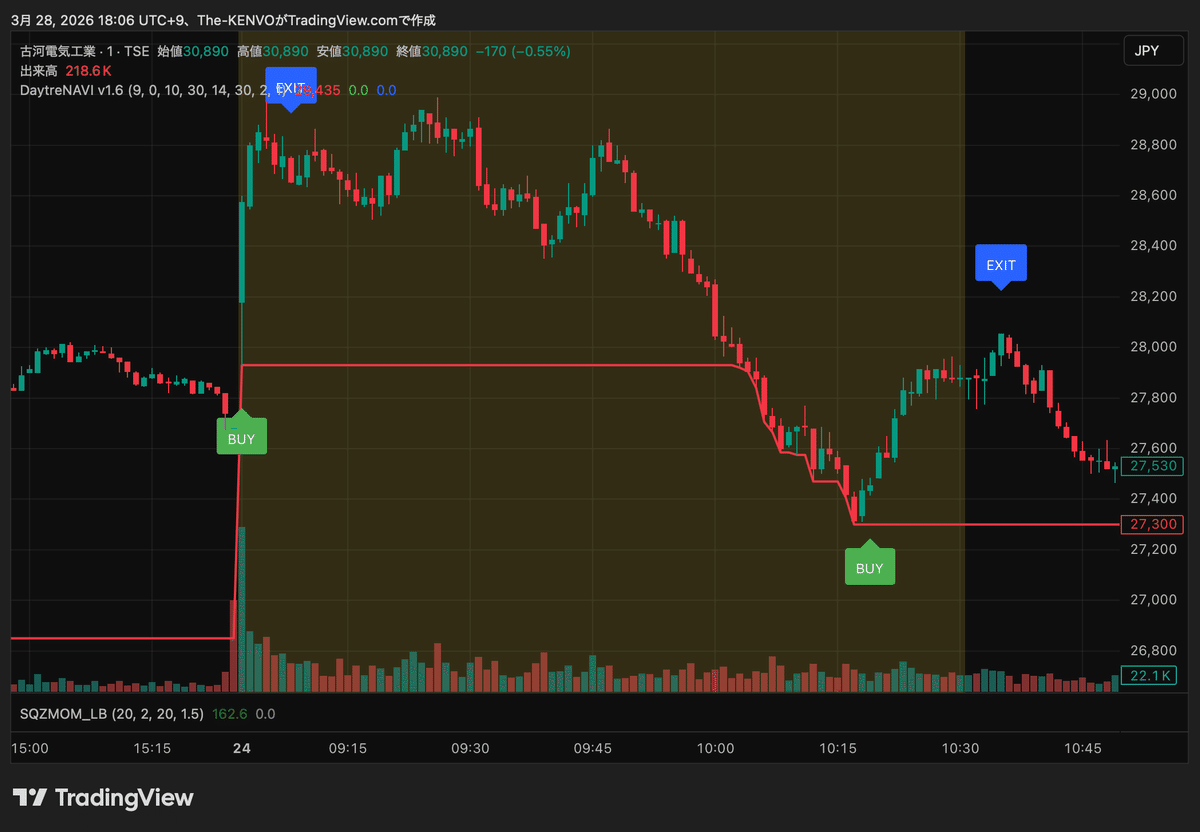
In Kobelco Steel Works as well, after the initial strong move after the open,BUY near the morning low → EXITflow is visualized.
What to note in this chart is that even when prices fall in the morning,
there are moments when signs of reversal appear at the low zone instead of continuing to drop.
Such stocks often have theme and fund concentration behind them, so even when they look like they’re going down, they can actually be undergoing “funds reflow,” not “panic selling.”
DaytreNAVI’s role is to organize this with
Morning Low Line + RSI reversal + EXIT rules
on a single framework.
DaytreNAVI is suited for people like
People who trade Japanese stocks mainly in the morning window
People who tend to catch a falling knife while trying to buy on dips
People who struggle more with EXIT decisions than with entry
People looking for a simple Japanese stock tool usable in TradingView
People who want to monitor high-fund-concentration stocks efficiently in a short time
As noted on GogoJungle’s sales page, DaytreNAVI is provided as arestricted-access scriptfor TradingView; after purchase, sending your TradingView username grants access. It supports mobile app and BUY/EXIT alerts, which are convenient for in-market use.
Finally
Day trading isn’t just about stock selection.
Signals alone aren’t enough.
What matters is to capture“stocks with funds concentrated” × “morning low” × “first reversal move”simultaneously.
And I myself think to take this further by
restricting use to top market cap turnover ranking stocksto make it even more practical in real trading.
Stocks at the market’s center don’t just move violently. They concentrate funds, which makes rebounds from the morning low carry more “meaning.”
For those who want to capture the key morning points with concrete evidence rather than vague intuition.
If you are trading Japanese stocks on TradingView, DaytreNAVI offers a very usable answer.
TradingView specification: Daytrading indicator for Japanese stocks [DaytreNAVI] Morning low × RSI rebound — don’t miss the winning “buying opportunity”!
[Disclaimer]
This article is based on the author’s analysis and views and does not recommend or solicit the purchase or sale of any specific stock.
While every effort is made to ensure the accuracy and completeness of the information contained herein, no guarantee is provided, and the author assumes no responsibility for any losses arising from the use of this information.
Stock investing and day trading involve price volatility and may lead to principal loss. Final investment decisions should be made at your own risk and judgment.
Additionally, the indicator “DaytreNAVI” described herein signals based on past price movements and a certain logic and does not guarantee future price increases or profits. Market conditions and stock characteristics may cause it not to function as expected.
This article may contain affiliate links. If you purchase products through these links, the author may receive compensation, but this does not influence the content or assessment.