
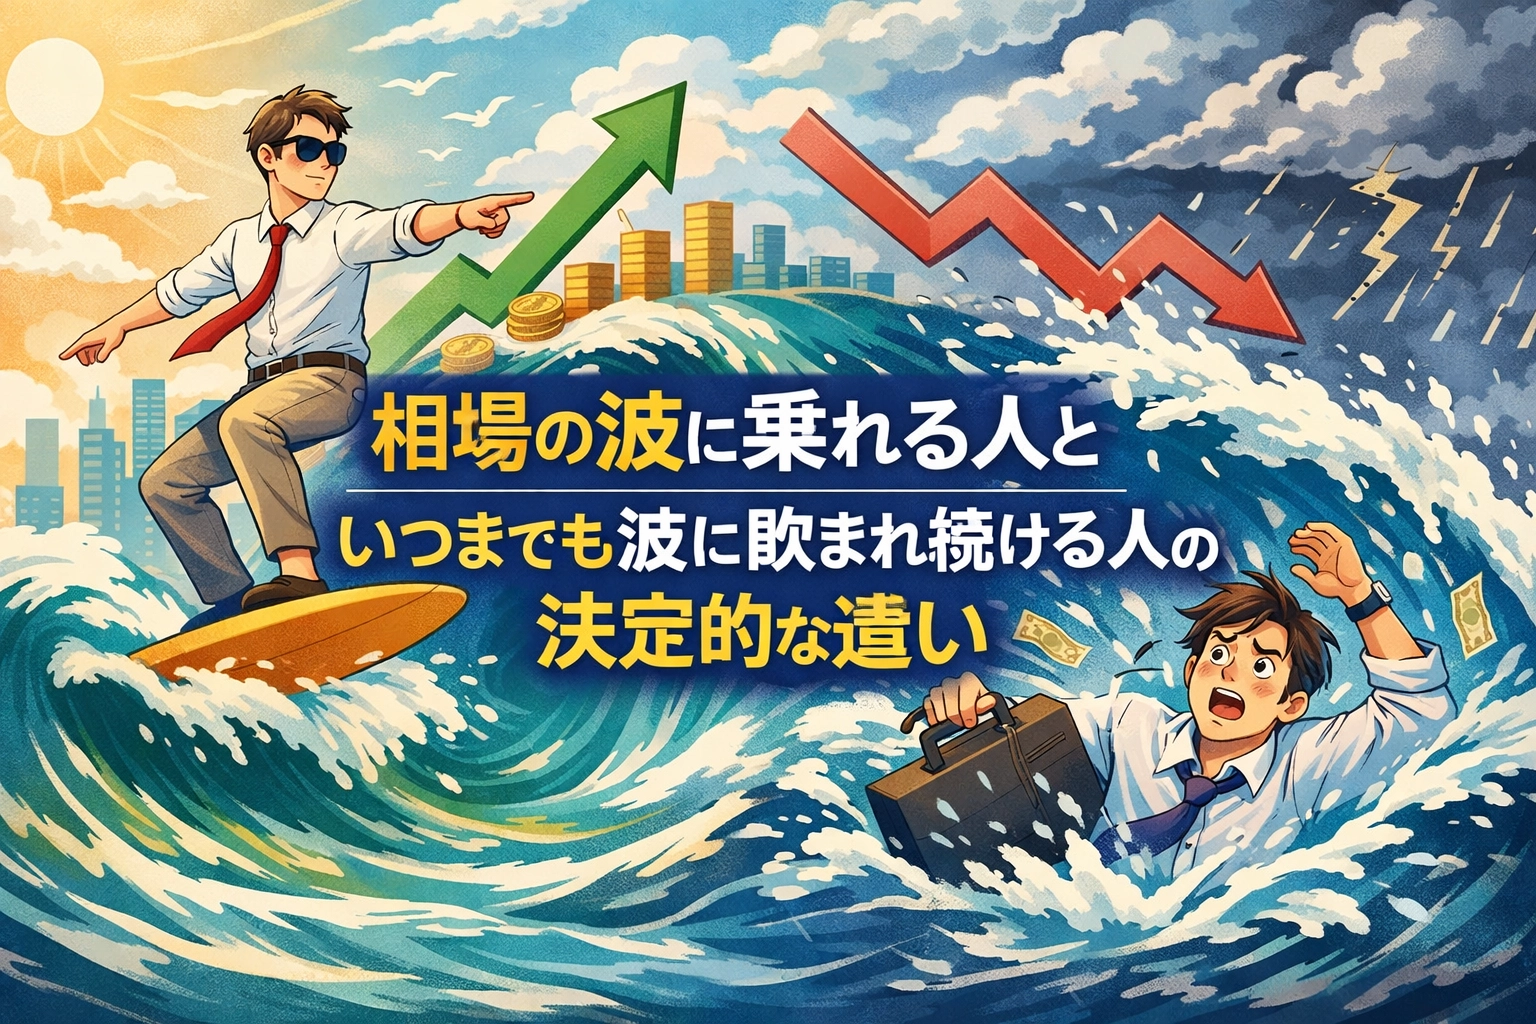
The decisive difference between people who can ride market waves and those who are forever overwhelmed by them
The decisive difference between people who can ride the market waves and those who are swallowed by the waves forever
When you continue stock investing, you notice a mysterious phenomenon. Even though you’re looking at the same chart, some people consistently make profits while others repeatedly incur losses. Even with the same information and the same stocks, the results can be completely different. Where does this difference come from?
Many beginners who start learning technical analysis initially spend a lot of time watching charts, memorizing indicators likeMACDandRSIand other metrics. However, after several months, many experience that their assets don’t increase and often decrease. They have more knowledge, yet no results. The reason isn’t a lack of understanding of technical analysis itself; it’s the way they face the essence of the market.
What I’m going to discuss this time is not about a particular buy/sell signal or which indicator is superior. It’s about what it means to read the waves of the market, the essential meaning, and the thinking framework needed to put it into practice. By the end, your view of charts will probably change.
Everyone participating in the market buys and sells with their own motives and emotions. Both institutional and individual investors, high-frequency trading by AI, all intersect on one stage: the market. All of these actions are visualized in charts.AIThus, technical analysis is not just pattern recognition using indicators or formulas; it is the act of reading the collective psychology of market participants. When moving averages are headed up, that is not merely a string of numbers. It indicates that many investors are bullish on this stock, and the buying power outweighs selling power, continuing.
Whether you can adopt this view is the first branching point between those who master technical analysis and those who do not. Instead of seeing charts as “records of past prices,” see them as “aggregate current human psychology.” This shift in perception is the starting point of everything.
Stock prices move not by the intrinsic value of a company but by the sum of people’s expectations about that company. Many know this in their heads, but in actual trading they tend to forget. Even good earnings can cause stock prices to fall; bad news can cause prices to rise. This isn’t because the market is wrong; either the price already reflected those expectations, or new expectations have formed.
The original purpose of learning technical analysis is to detect changes in these “expectations” as early as possible. Even if a company has strong fundamentals, its stock price can fall when market expectations collapse. Conversely, even if performance is poor, stock prices can rise when an expectation to recover grows. The waves of the market are the phenomenon of these shifts in expectations spreading in a chain reaction.
Many investors become disappointed with technical analysis because they memorize patterns too much. If you buy when a golden cross appears and sell when a death cross appears, you won’t understand the market’s essence. The market isn’t so simple that the same pattern always yields the same result.
Take the golden cross as an example.25day moving average crossing above the75day moving average suggests, this pattern can indicate the continuation of an uptrend. However, if there is no accompanying volume, it may just be an overextension in price. In a market in a downtrend, a golden cross may indicate only a retracement sell signal.
What matters is not the pattern itself but the context in which the pattern occurs. The same signal can have completely different meanings depending on the larger trend. Here, the concept of multi-time-frame becomes essential.
If you only look at daily charts, you focus on the movement in front of you. By cross-checking with weekly and monthly charts, you can place current movements within a larger flow. If a stock is in a long-term uptrend on the monthly chart but in a corrective phase on the weekly chart, it may look like a decline on the daily chart, but that could be a buying opportunity on dips. Conversely, a stock in a downtrend on the monthly chart may show a rebound on the daily chart as a potential selling opportunity.
Follow the larger time-frame trend while planning entry timing on smaller time frames. Mastering this principle dramatically changes the meaning of patterns.
One of the most fundamental concepts in technical analysis is support and resistance. This is not merely a price level where price previously bounced; it is a price level where investor psychology is condensed.
For example, if a stock repeatedly bounces around the level of2000yen, that price range has special significance. Investors who bought at that level may have experienced unrealized losses as the stock later fell. When the price approaches2000yen again, those investors may sell with the psychology of “I can finally cut losses” or “the price has returned to its rightful level, so I’ll sell.” This accumulation creates resistance.
Conversely, when the price repeatedly rebounds around1800yen, many investors believe “it’s cheap enough here, so I’ll buy.” This crowd psychology forms a support line.
The importance of this concept is not the price itself, but understanding the investor psychology embedded in that price, which improves the accuracy of predicting the next move. When a strong support fails, it’s not just a numerical change. It means investors who believed in that level are forced to cut losses all at once, selling begets more selling, leading to further declines. This chain explains the phenomenon of a sharp fall after a support breaks.
When you understand this psychological mechanism and look at charts, price movements look completely different. It’s no longer just lines rising or falling; it appears as a scene of tens of thousands of investors’ emotions and judgments tugging at a rope.
Volume is the chart’s evidence. It is perhaps the most important supplementary information to judge how reliable price movements are.
When prices rise and volume increases, it means many investors are actively buying the stock. Demand is rising, so the uptrend is likely to continue. On the other hand, if prices rise while volume declines, it indicates sellers are thinning out, and price increases are not backed by stronger buying power. Such movement can be read as a sign that the uptrend is losing momentum.
Volume during a downtrend is the same: after a sharp drop with large volume, if volume wanes and the decline continues slowly, it signals diminishing selling pressure. The phenomenon known as a selling climax occurs when there is very high volume and price falls rapidly; once sellers have dumped their shares, selling pressure dries up and the price reverses upward.
However, relying on volume alone to judge can be dangerous. When large institutional players accumulate at a specific price range, volume can swell without much price rise. This is called accumulation, and can precede a major move upward. Conversely, when heavy volume occurs at high price levels, it can indicate distribution, where large holders dump their stock.
Reading market waves is about interpreting these unseen forces through two pieces of information: price and volume.
Up to this point, I’ve shared the essential way of thinking in technical analysis, but even understanding only this won’t reliably produce stable profits. The biggest enemy in the market is not the market itself but one’s own emotions.
The human brain is wired in a way that’s not suited for investing. This is not metaphor; behavioral economics has repeatedly shown this fact. There is a psychological phenomenon called loss aversion bias. People feel the pain of a loss more strongly than the pleasure of an equal gain, by about22to2.5times.
This psychology damages investing by making it hard to cut losses. When a unrealized loss occurs, selling locks in the loss. If you don’t sell, the loss remains unrealized. The brain’s strong aversion to realizing losses leads to clinging to hope that “it’ll come back if I wait a little longer,” and as prices fall further, the losses that could have been small become irrecoverable.
Conversely, when profits are growing, there’s a tendency to realize them quickly. Because of the fear of losing these gains, even if there’s still room to rise, one may sell early. This creates the opposite of the “loss-minimizing, gain-maximizing” principle—an even worse pattern where losses overwhelm gains.
Confirmation bias also makes investing difficult. People gather information that supports what they already believe and ignore information that contradicts it. After buying a stock, they actively seek positive news and consciously overlook negative news, leading to biased judgments and staying invested when they should exit.
Technical analysis and emotional management are the two wheels of a car. They do not function with only one of them. So how can we achieve investment decisions that aren’t swayed by emotions?
The answer is a simple yet crucial one: “make rules and follow them.” But this simplicity is extremely difficult in practice. The difficulty lies not in the complexity of the rules themselves, but in the emotional resistance to following them.
First, cultivate a habit of cutting losses in advance before buying. Decide in advance, “If this stock falls below 1700 yen, I’ll cut losses,” and mechanically follow that rule. It’s important to base the loss-cutting threshold on technical analysis rather than a vague “if it falls by 10%.” For example, “If it breaks 1700 yen, a key near-term support level, that level no longer functions as support, and the trend has likely changed; hence cut losses at 1700 yen.”1700円を割ったらといった根拠のあるラインを設定する。
If you have a justification, you’ll find it easier to execute the line mechanically when it’s reached. Lines without justification tend to be defeated by emotional resistance like “maybe it will come back a bit longer.”
Position sizing, i.e., how much capital to allocate to a single trade, is also deeply tied to emotional management. If you put a large portion of your assets into one trade, you’ll be emotionally shaken by its movement. Even with correct analysis, you may not endure temporary price swings and may exit at an inopportune time. Keeping a fixed percentage of assets per trade, for example5510%, helps you stay calm during temporary reversals.
This is not merely about money management. Keeping a calmer position size also prevents technical analysis judgments from being distorted by emotions, a matter of psychological management.
There are two major market states: trend and range. Distinguishing these correctly is a crucial condition for stable performance.
A trend market is one where price moves in one direction for a period. In an uptrend, both highs and lows advance. As long as prices continue to surpass the previous high and do not break the previous low, the uptrend is considered to continue. A downtrend is the opposite: highs and lows both move lower.
A range market is when price moves back and forth within a certain width. It repeats movements where price faces resistance when moving up and is supported when moving down.
Misjudging these two states is a major source of losses. In a trending market, assuming a range and trading against the trend leads to losses. In a range market, assuming a trend and trading with it leads to quick reversals and repeated losses.
One method to determine the current market state is the indicator ADX.ADXquantifies the strength of a trend, with25 or higher indicating a trend market, and20 or lower suggesting a higher likelihood of a range market. However, this is not an absolute rule; it’s essential to judge from multiple perspectives, such as Bollinger Band width and how far price has deviated from moving averages.
In a trend market, the basic strategy is to enter on pullbacks or retracements in the direction of the trend. In a range market, mean-reversion strategies—buy near support and sell near resistance—are effective. Adapting strategies to market conditions is a powerful tool.
The Japanese stock market is not driven only by domestic factors. Global macro factors such as US market trends, currency fluctuations, crude oil and commodity prices, and geopolitical risks interact in complex ways.
In particular, US stock market trends and exchange rates greatly affect Japanese stocks.NYDow andS&P500fall sharply, and the next day the Japanese market often declines in tandem. This is due to the global flow of funds being interconnected. The term risk-off describes a situation where risks materialize somewhere in the world; investors then sell risky assets like stocks and buy safe assets such as US Treasuries, gold, and the yen. This causes Japanese stocks to suffer a double blow of a stronger yen and lower stock prices.
Incorporating this external environment into technical analysis improves signal reliability. Even if the technical signal is strong, its reliability falls when the US market is highly unstable. Conversely, when the external environment is stable and technical signals are strong, you can enter with high conviction.
It’s also important to keep track of indices like the Nikkei 225 andTOPIX. No matter how good an individual stock is, if the overall market falls, most stocks fall with it. Always compare the market’s direction with the individual stock’s movement to connect macro and micro viewpoints.
After many years of investing, I’ve come to feel that those who achieve stable market performance are, without exception, “people who can wait.”
When you master technical analysis, every chart tempts you to look for trading opportunities. You try to find patterns in every movement and justify entries. But truly good opportunities do not occur that frequently. It’s rare to have a perfect setup several times a month.
Yet many investors continue trading. The reason is the urgency and anxiety about not acting. The feeling of “If I don’t act now, I’ll miss out” or “I would regret passing this up” leads to baseless entries.
As Warren Buffett said, “The good investor makes time to do nothing,” meaning that the value of investing lies not only in what one does but also in what one does not do. Not trading when conditions aren’t right is a legitimate investment decision.
To practice this “waiting,” keeping a trading journal is effective. Record the rationale for entries, loss-cut lines and their basis, expected take-profit levels, actual results, and reflections. Over time you’ll see patterns and weaknesses in your trading style. You might notice commonalities in emotional entries or patterns where judgments consistently go awry in certain situations. This self-analysis builds a more disciplined investment approach.
Reading market waves is not about predicting the future. This is a crucial shift in perspective.
Many investors try to predict “how high it will go next” or “when it will drop.” But the market’s future cannot be known with certainty, no matter how refined your analysis. Even professional traders are said to have an accuracy of about5050to60percent. The remaining40to50%will miss.
So why can professionals still be profitable? Because they create asymmetry: they win big when right and lose small when wrong. If you make ten trades, win six times, and lose four, but the profits from the wins exceed the losses from the losses by a margin of two to one, you come out ahead overall.
The true role of technical analysis is twofold: to identify probabilistically favorable conditions and to limit losses. Neither alone is sufficient. It’s meaningless to cut losses if you can’t enter only in favorable conditions, and it’s unhelpful to enter only in favorable conditions if you can’t cut losses properly.
Riding market waves means repeatedly cycling into the larger trend at probabilistically favorable timings and exiting quickly when signs of trend breakdown appear. You don’t need to ride the waves perfectly. It’s enough to catch only the central portion of the wave. Buying at the bottom and selling at the top leads to many failures.
Finally, I want to emphasize that mastering technical analysis is not about acquiring a single skill but about a continuous process of deepening your understanding of the market and yourself.
When you first look at charts, you might only see upward- and downward-sloping lines. With study, you begin to see trend reversals, the meaning of support and resistance, and later you can imagine the movements of large players behind changes in volume and price quality.
More importantly, you’ll learn your own emotional patterns through the market. When you lose composure, when you become greedy, or when fear dulls your judgment, understanding these patterns will most influence your long-term investment performance.
Charts look the same to everyone. But what you read from them and how you act depends greatly on your cognitive framework and emotional control. A person who can read market waves isn’t someone who can predict wave movements exactly, but someone who can stay aligned with their own rules without being swallowed by the waves.
The market always sends some message. Using technical analysis to interpret that message while continuing to face the other challenge of your own emotions, I believe, will lead to a long-lasting relationship with the market as an investor.