

2026/03/27 Gold analysis
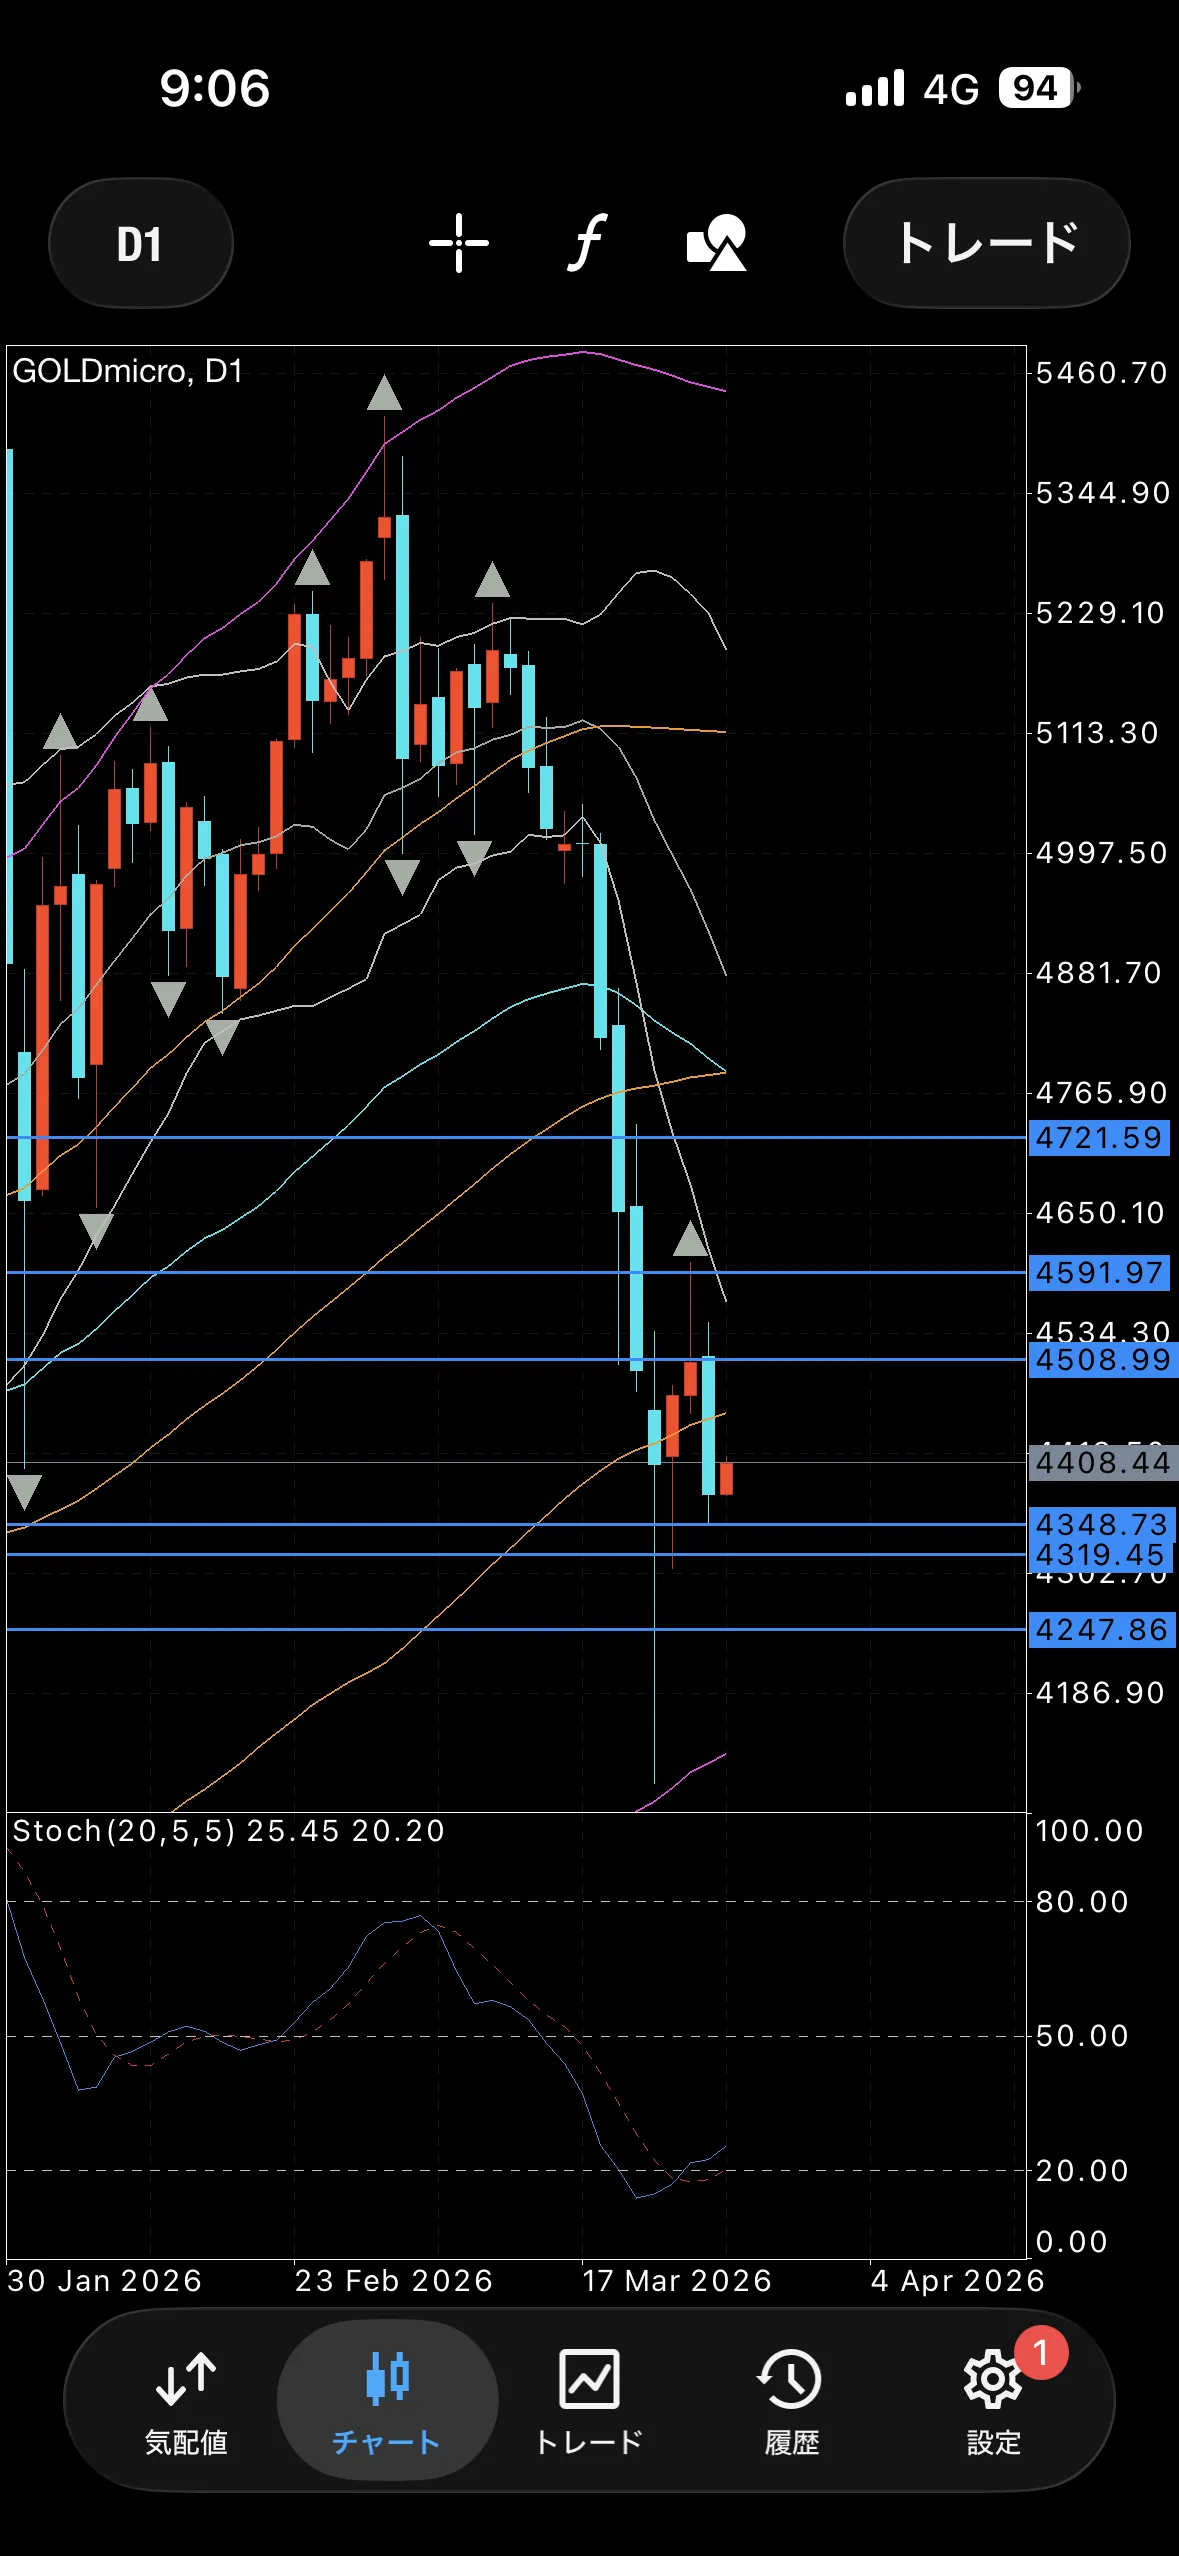
【Yesterday's daily chart】
Bearish candle
【Outlook】
・MA / Oscillator
Daily downtrend ↓ / ↓
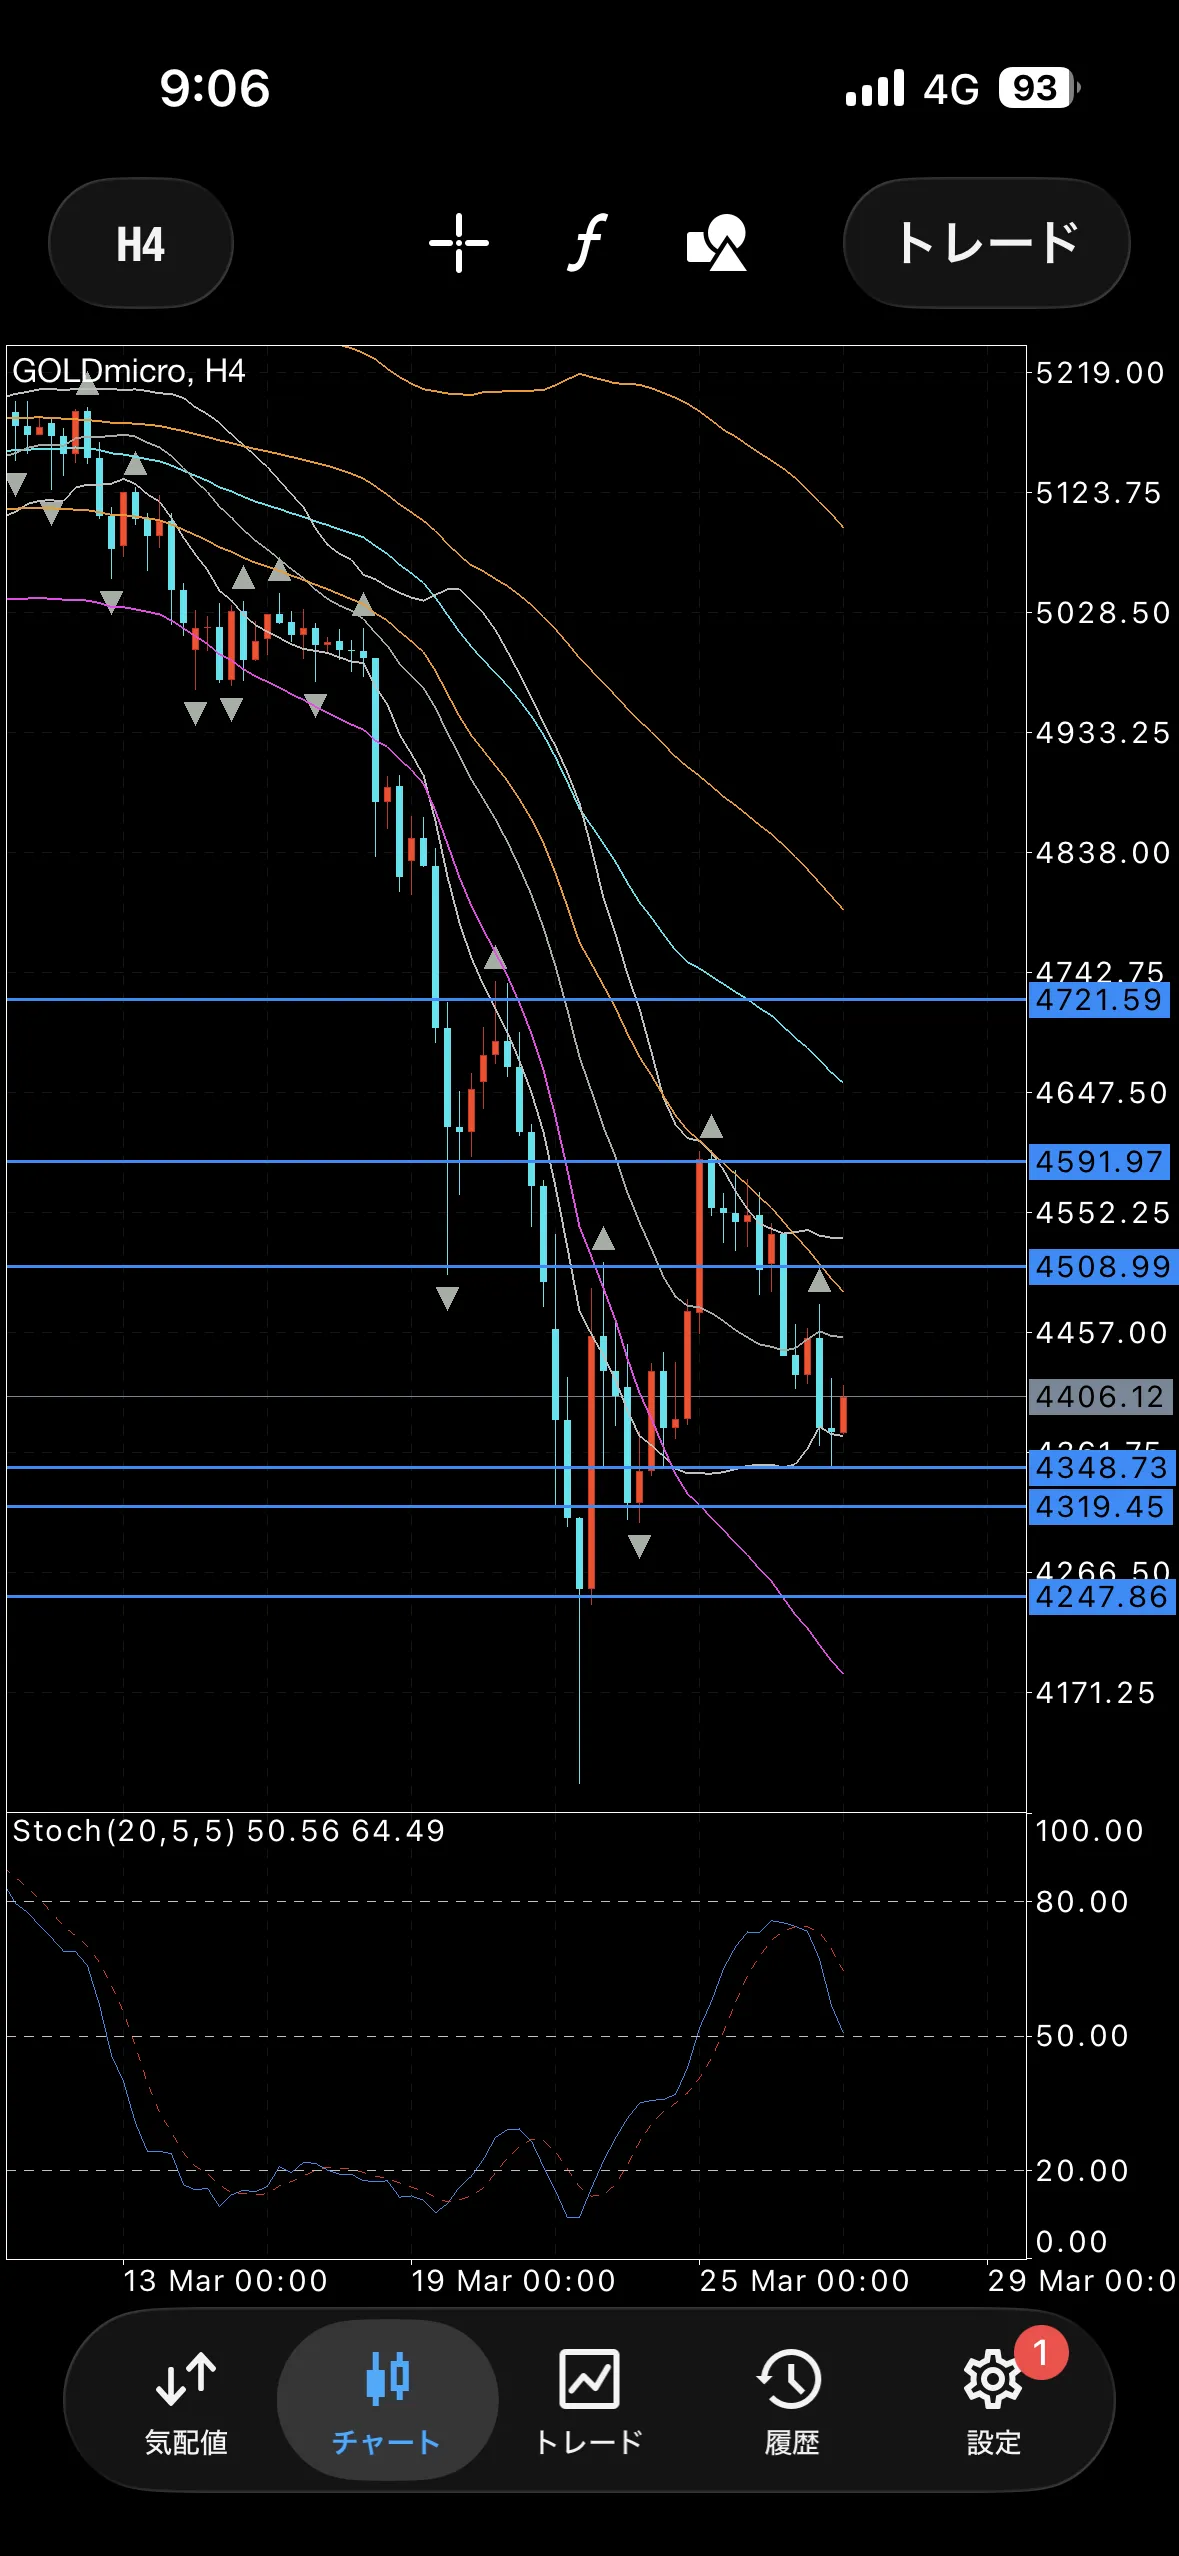
4-hour down ↓ / ↑
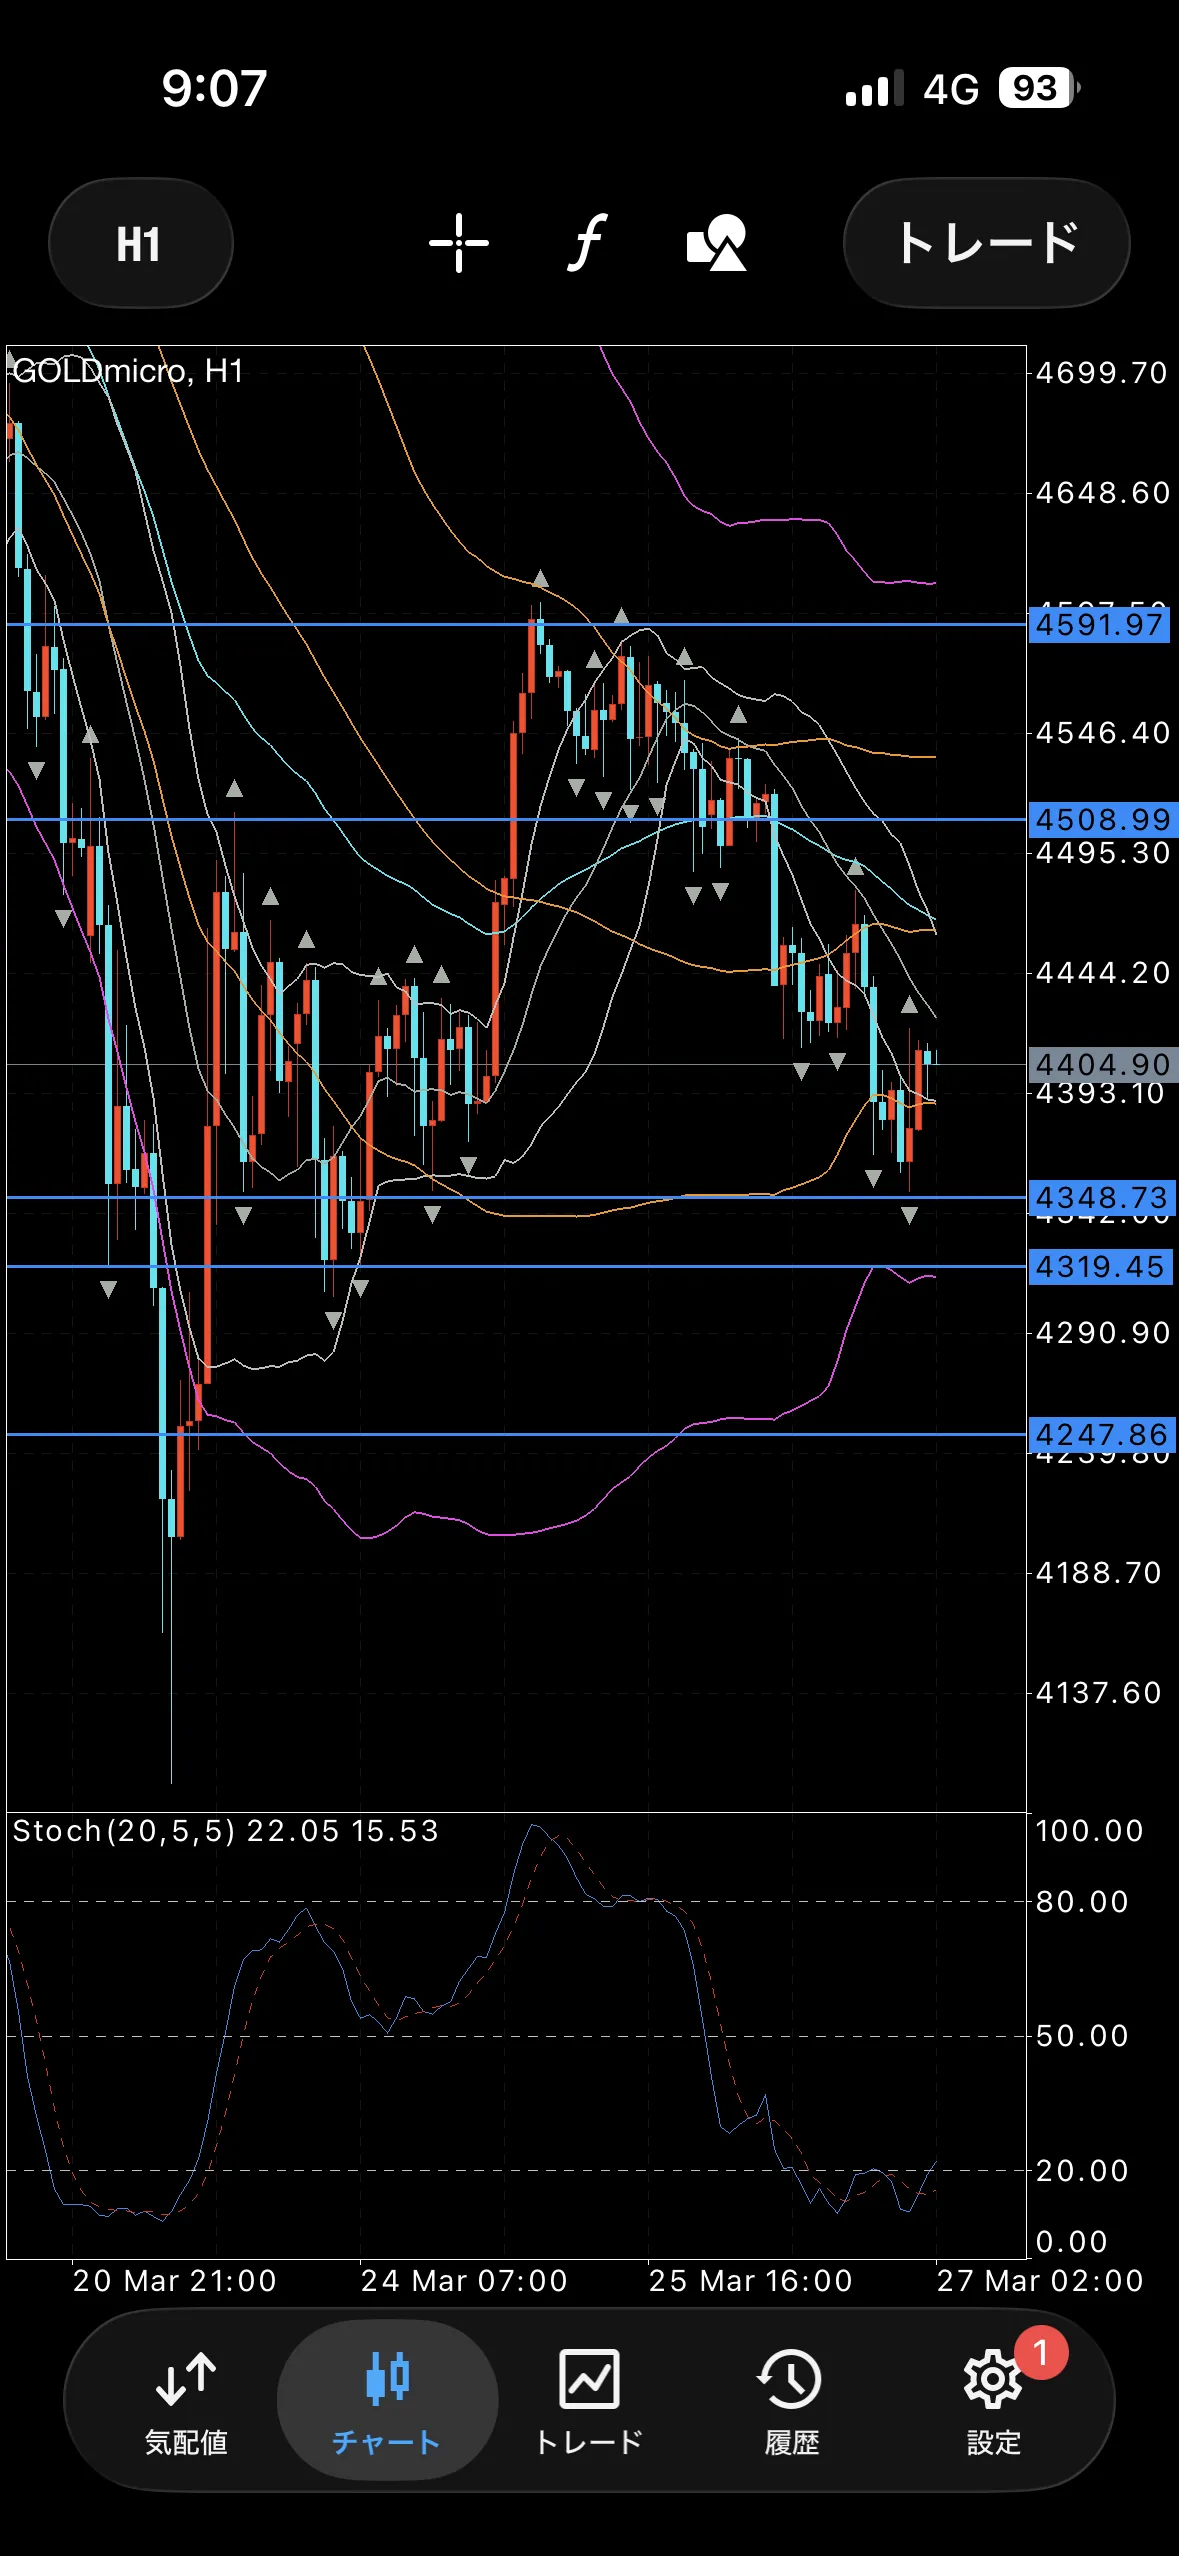
1-hour down ↓ / ↓
【Impression】
・Daily chart
Until the starting point of the bearish candle at 4508–91 is exceeded, the trend remains bearish
Since bands are walking, go easy on long positions
・4-hour
Direction is downward, but BB is flat, so buying from the bottom is possible
However, if being sold from above, there is a high possibility of being broken out, so if buying, set entries from below the range
・1-hour
This morning it is near the lower bound, so it is reasonable to buy in small increments each time an outside bar forms, but there is a possibility of selling from around 75
【Key price levels】
4595
4484
4348
4319
4247
× ![]()