

GOLDMATRIX Today's Report 2026/03/26
Today as well, a nice timing signal!!
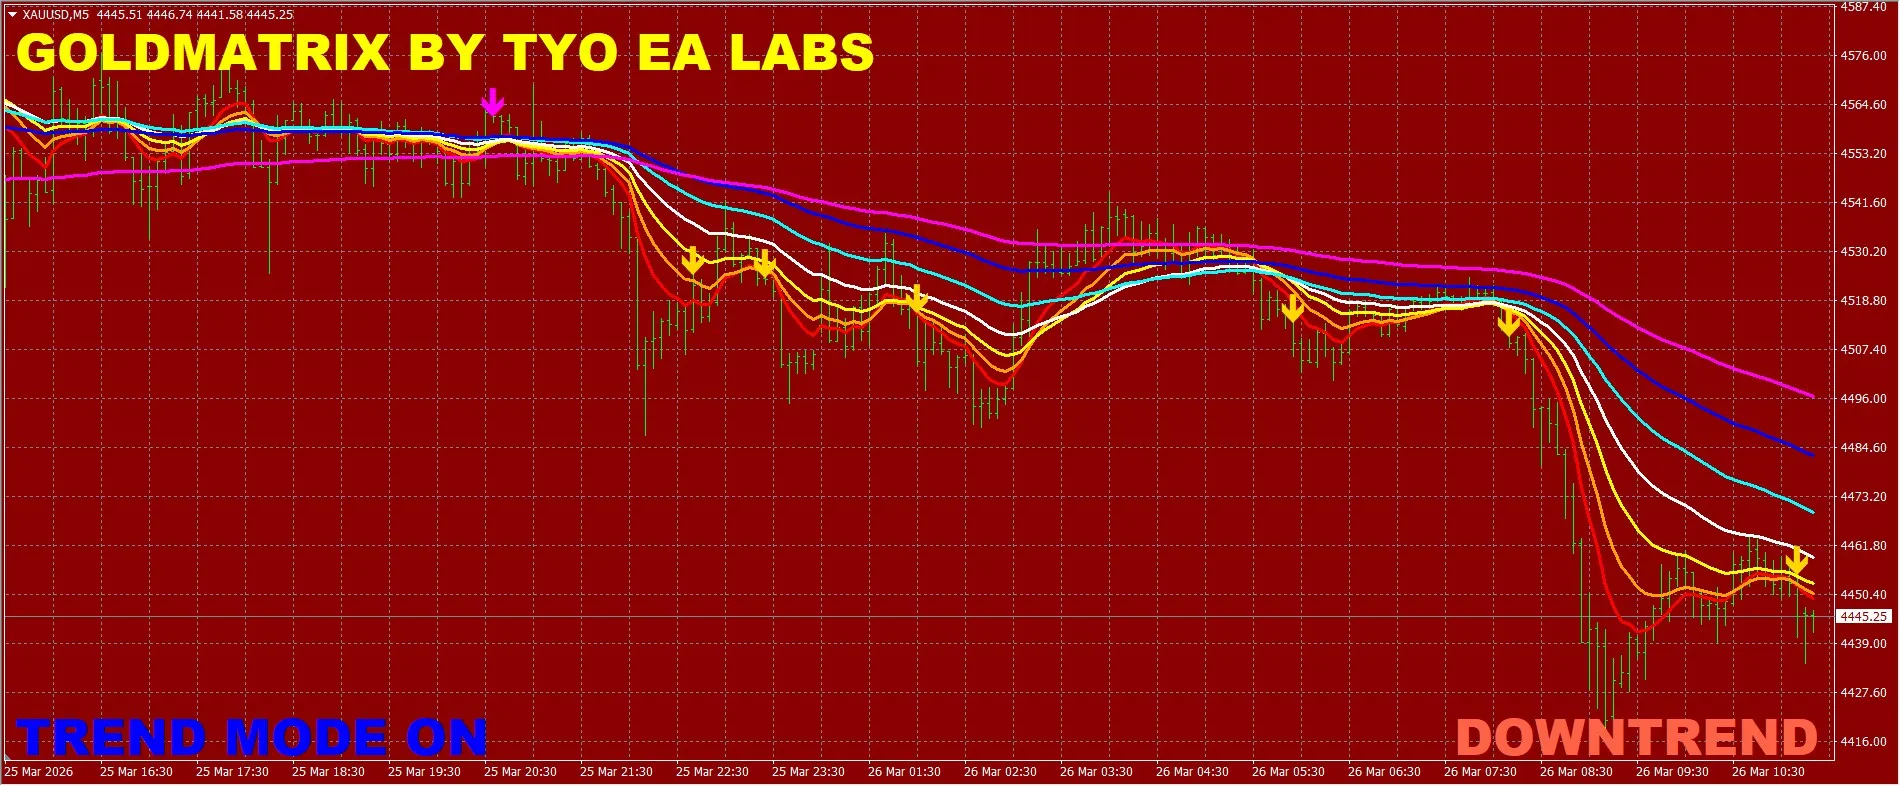
The downtrend is continuing
Since the euro opened,
it seems to be a quite favorable market for opportunities.
Gold Market Report (Based on M5 analysis)
Today’s gold price (XAUUSD) shifted from an early-range movement to a clear downtrend during the European to NY hours. In particular, the transition from convergence to divergence of short-term moving averages and the resulting sequence of selling signals serve as a clear sign of a trend reversal.
■ Early Stage: Range to Weak Trend
In the early part of the chart, price generally trades in a range around 4445–4455. Several moving averages are packed together, indicating a lack of market direction. In this phase, buying and selling are balanced, and no clear trend has formed.
However, the highs gradually begin to decline, and the resistance at the upper level becomes noticeable. At this point, short-term selling pressure appears to be predominant.
■ Turning Point: Strong Downside Trigger Occurs
Around 9:30 PM, a sharp drop with a long bearish candle occurs. This single move completely breaks down the previous range and shifts into a clear trending market.
At the same time,
- Short- to mid-term moving averages turn downward
- Price sinks below all moving averages
- Sell signals (arrows) appear sequentially
forming a typical “trend initial movement pattern.”
This point can be judged as the most importantinitial short-entry pointfor day trading.
■ Mid Phase: Continued Pullback Selling
After the sharp drop, a temporary rebound occurs, but this remains a short-term correction,
- Moving averages act as resistance
- Highs keep making lower highs
- Sell signals re-ignite
and the pullback selling continues.
In particular, when price touches the yellow or red short-term lines and falls again, it becomes a classic trend-following selling zone.
■ Later Stage: Trend Acceleration Phase
After 7:30, another large drop occurs, accelerating the trend.
In this phase,
- widening divergence of moving averages
- nearly one-way decline
- volatility expands rapidly
confirming a complete “trend market.”
In this phase, counter-trend trading was difficult to work, and only trend-following (selling on retracements) carried high risk otherwise.
■ Current Situation: Signs of Downside Pause
In the chart’s late stage,
- increase in lower wicks
- convergence of short-term lines
- slightly ranging price
suggesting a temporary pause in the downtrend in the short term.
However,
- mid- to long-term moving averages remain downward
- the overall trend structure has not broken
thus, at this point it is reasonable to regard this as a temporary correction within a downtrend.
■ Today’s Summary
Today’s gold market shows
- Range → Sharp drop → Pullback selling → Trend acceleration
an extremely textbook example of a falling-trend market.
Key points include:
- Initial break (most important entry)
- Pullback selling into moving averages
- Avoiding risky contrarian trades within the trend
■ Trade Strategy Review
In markets like today’s,
✔ Do not chase in range
✔ Enter in the direction after the breakout
✔ Wait for a pullback and sell again
these three points were a highly effective pattern for a typical day.
■ Points for Tomorrow
- Depth of pullback (how far it retraces)
- Recontact with moving averages
- Whether selling resumes
? “Continuation of the pullback or trend end”
This discernment will be crucial.