⭐️ Today (March 25) Ginkan (銀漢) 【Winning Form】
Today (March 25) in Ginkan【Winning Form】
(USDJPY1 minute chart)
(USDJPY1 minute chart)
(Click image to enlarge)
(Click image to enlarge)
FX, Binary Options, and Nikkei 225 support for all!
Boasting an 85–95% win rate (Trading history is listed at the bottom of the page)
Latest Metatrader (MT4) indicator
Ginkan(銀漢)

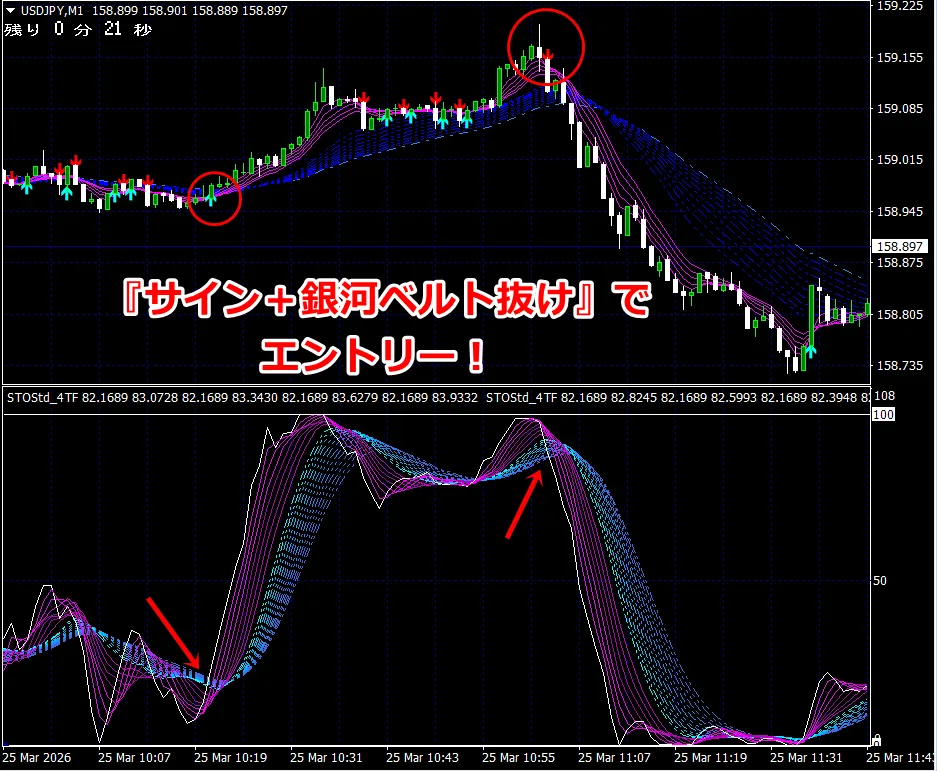
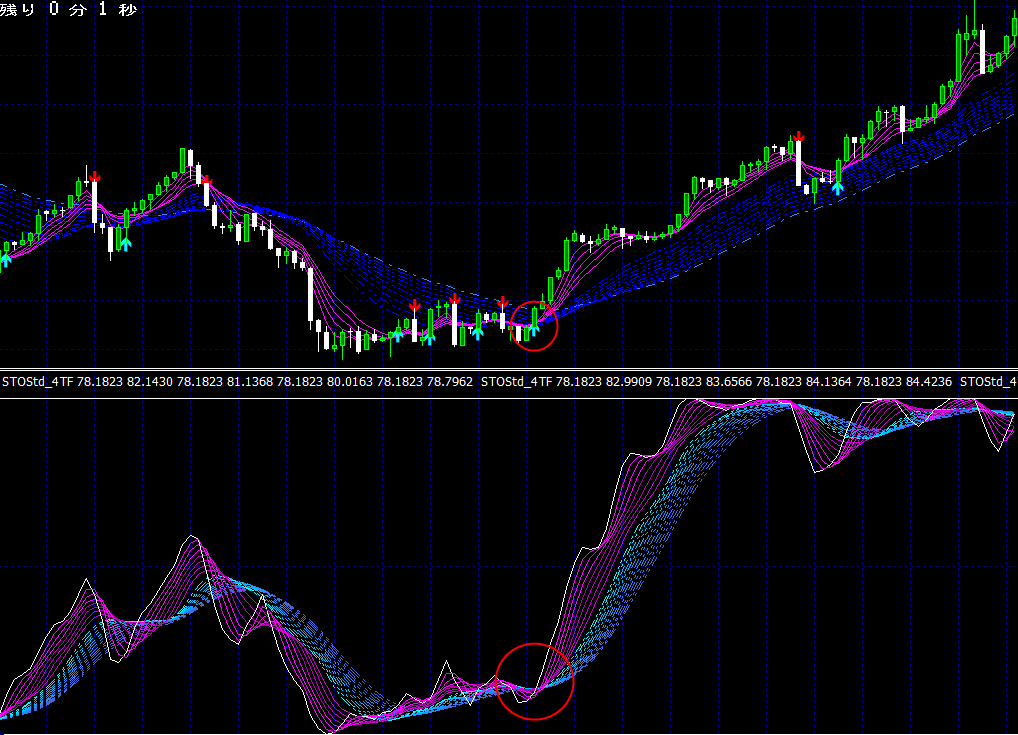
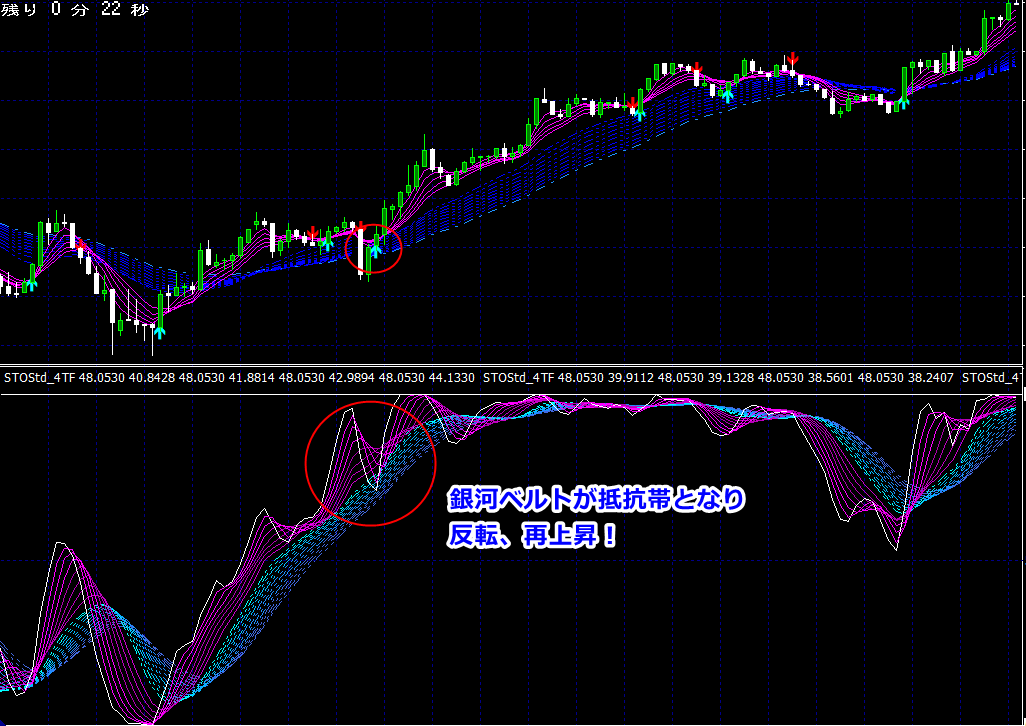
Ginkan(銀漢) means the Milky Way (galaxy). The basic logic of this indicator is to describe that curved band as the galaxy belt, and treat the point where the galaxy belt is broken as the entry point.
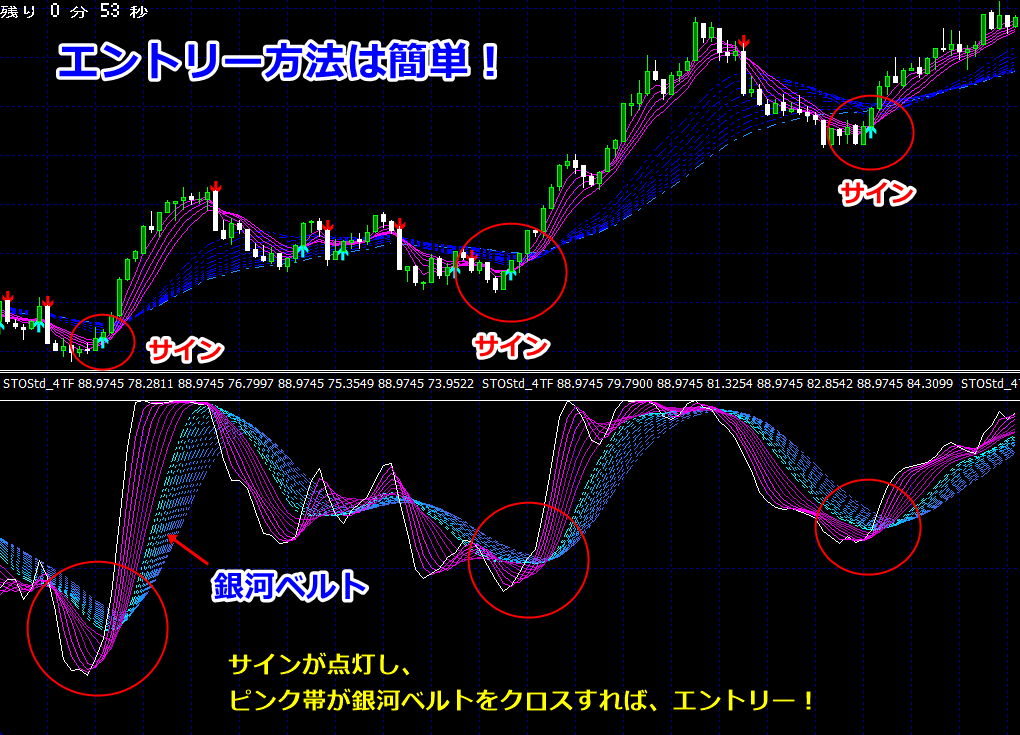
The pink band and the galaxy belt on the chart alternate convergence and dispersion, changing above/below.
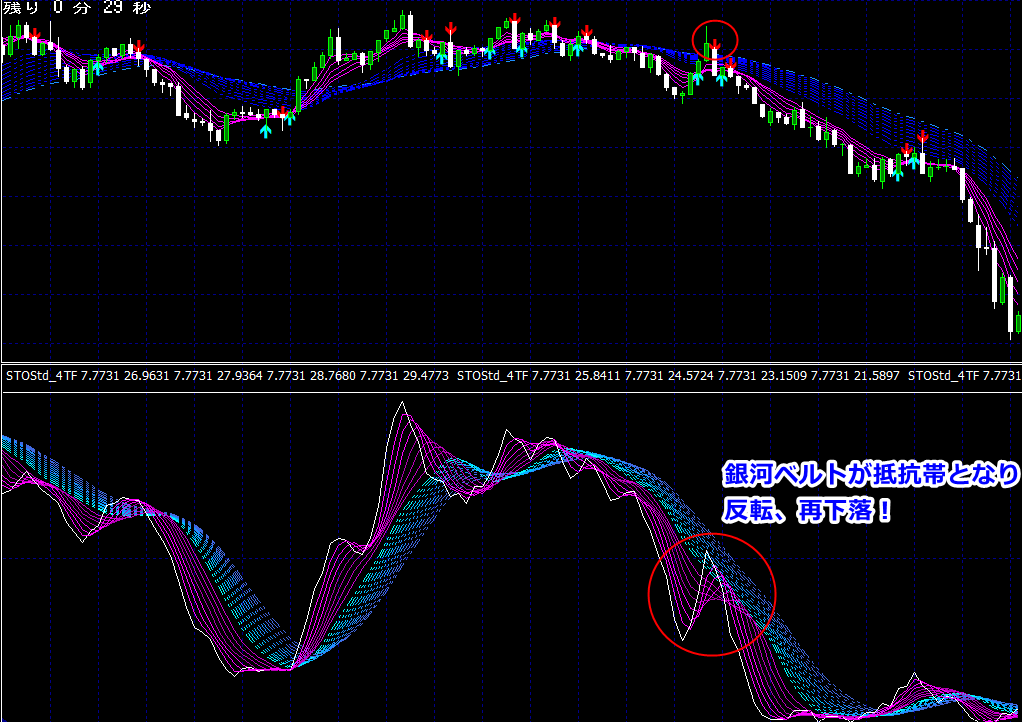
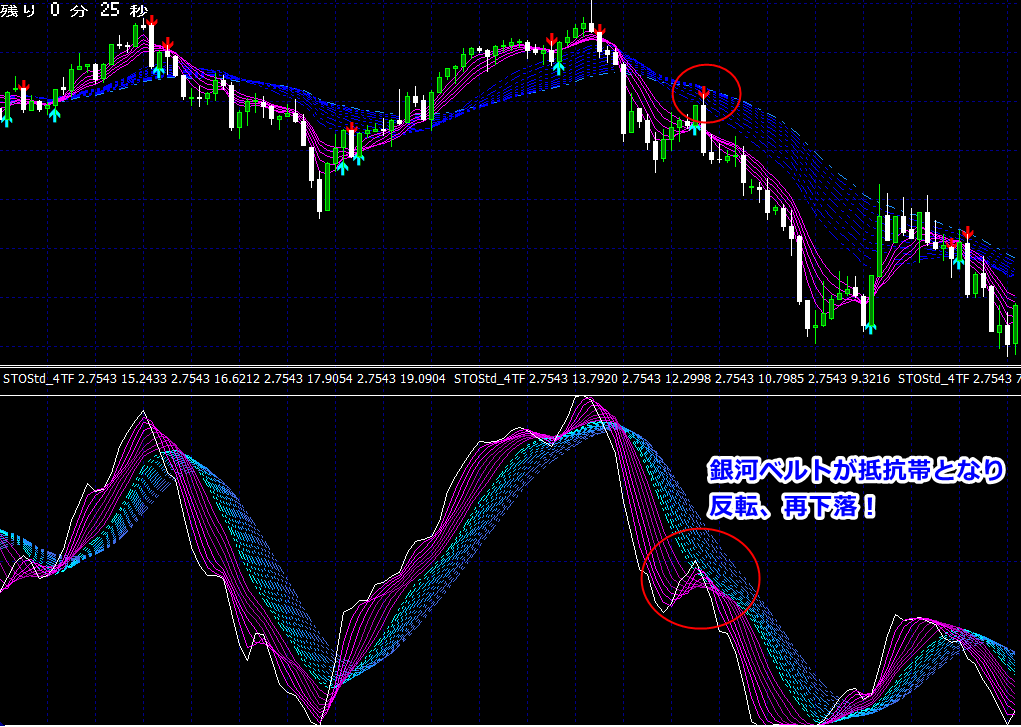
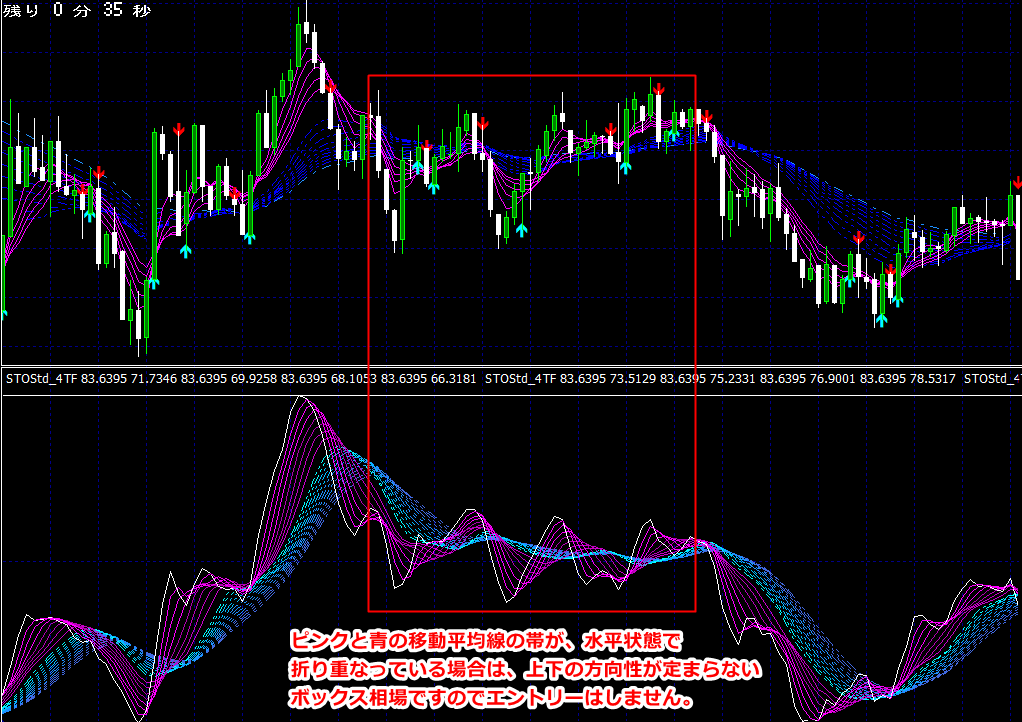
When the pink band is above the galaxy belt, it's an uptrend,when the pink band is below the galaxy belt, it's a downtrend.This switching point, i.e.,the crosspoint of the pink band and the galaxy belt marks a turning point.As a basic entry method, as shown above,“Signal lights up, pink band crosses the galaxy belt”the point becomes the entry point.【Chart screen description】【Top window】◆ Candlestick chart with moving averages・Pink and blue form the moving average bands.If the pink band is above the blue band, it's an uptrend; if pink is below blue, it's a downtrend.・ displays remaining time to the current candle close at the top-left of the screen◆ Arrow signals・Light up in real time at potential turning points.・If conditions are not met before candle closes, it fades. No repainting.・Signal on does not equal entry.If the pink band crosses the galaxy belt at the moment of signal lighting,that is best..【Sub Window】◆ Indicator・Composed of pink band and galaxy belt.・If pink band is above galaxy belt, uptrend; if pink is below, downtrend.【Entry Method】Trading method:・FX, Nikkei 225 etc., supports from scalping to swing trading・Binary optionsPairs:All pairs(※ Compatible with all currency pairs visible on your MT4, with commodities, CFDs, and cryptocurrencies)Chart timeframes:・FX, Nikkei 225 etc., support all timeframes!・Binary options 1 minute (supplementally 5 minute)< Entry Example ><Up pattern>Signal lights up,From the lower band, the pink belt rises to cross the galaxy belt from belowin a scooping motionand crosses,at the point of breaking aboveentry.Rising Example ①Rising Example ②Rising Example ③Rising Example ④Rising Example ⑤Rising Example ⑥Rising Example ⑦<Falling pattern>Signal lights up,From the upper, pink band covers the galaxy belt from aboveas if covering itand crosses,at the point of breaking belowentry.Downtrend Example ①Downtrend Example ②Downtrend Example ③Downtrend Example ④Downtrend Example ⑤Downtrend Example ⑥Downtrend Example ⑦<Re-rise and re-fall patterns>During rising or falling phases, pullbacks and retracements occur.In such cases,After a pullback, the galaxy belt acts as a support line,and from there, it reverses and rises again.Alternatively, after a retracement, the galaxy belt acts as resistance and a subsequent fall occurs.When the signal lights up,Entry occurs at the point where pink band lifts above/below the galaxy belt in opposite directionto the galaxy belt.Rising Example ①Rising Example ②Rising Example ③Rising Example ④Rising Example ⑤Downfall Example ①Downfall Example ②Downfall Example ③Downfall Example ④Downfall Example ⑤<Avoid entry situations>Do not enter during a box-range market where direction is unclear..<Overall entry flow>Supports all timeframes, so please adapt to your trading style.‘Enter when the signal lights up + break of the galaxy belt!’【Trading history】Binary options (3-minute trades) with clear win/loss records.26 wins 3 losses (win rate 89.6%)15 wins 1 loss (win rate 93.7%)19 wins 3 losses (win rate 86.3%)26 wins 4 losses (win rate 86.6%)16 wins 2 losses (win rate 88.8%)For details and purchase of the indicator,here!Ginkan (銀漢)when the pink band is below the galaxy belt, it's a downtrend.
This switching point, i.e.,
the crosspoint of the pink band and the galaxy belt marks a turning point.
As a basic entry method, as shown above,“Signal lights up, pink band crosses the galaxy belt”
the point becomes the entry point
.
【Chart screen description】
【Top window】
◆ Candlestick chart with moving averages
・Pink and blue form the moving average bands.
If the pink band is above the blue band, it's an uptrend; if pink is below blue, it's a downtrend.
・ displays remaining time to the current candle close at the top-left of the screen
◆ Arrow signals
・Light up in real time at potential turning points.
・If conditions are not met before candle closes, it fades. No repainting.
・Signal on does not equal entry.
If the pink band crosses the galaxy belt at the moment of signal lighting,that is best..
【Sub Window】
◆ Indicator
・Composed of pink band and galaxy belt.
・If pink band is above galaxy belt, uptrend; if pink is below, downtrend.
【Entry Method】
Trading method:・FX, Nikkei 225 etc., supports from scalping to swing trading
・Binary options
Pairs:All pairs
(※ Compatible with all currency pairs visible on your MT4, with commodities, CFDs, and cryptocurrencies)
Chart timeframes:・FX, Nikkei 225 etc., support all timeframes!
・Binary options 1 minute (supplementally 5 minute)
< Entry Example >
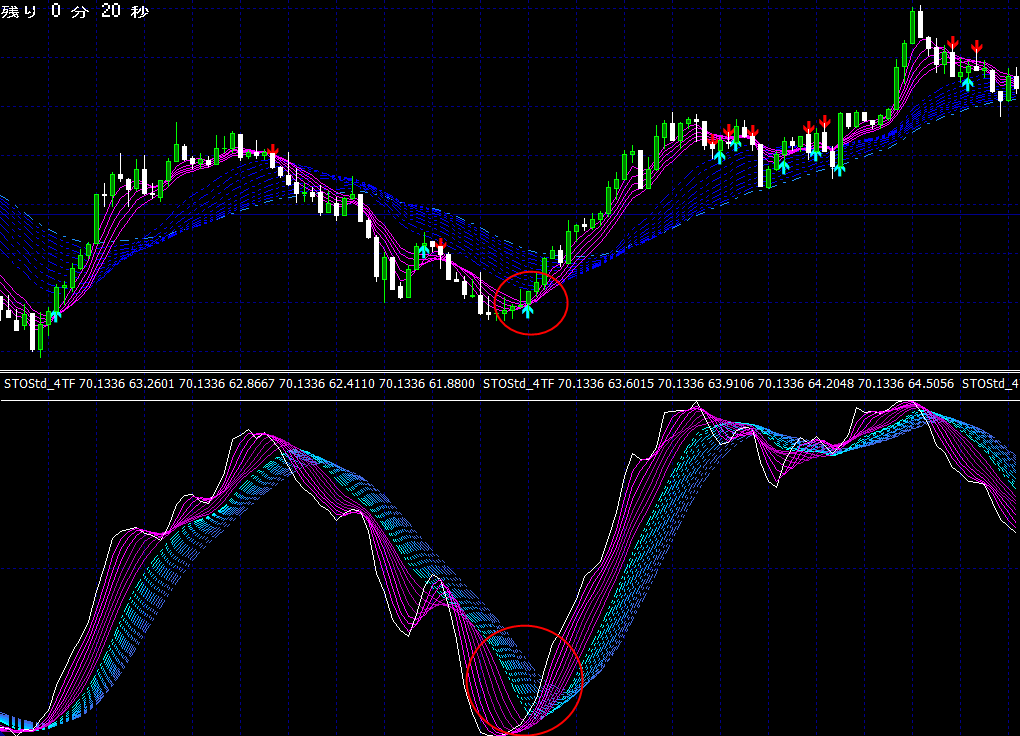
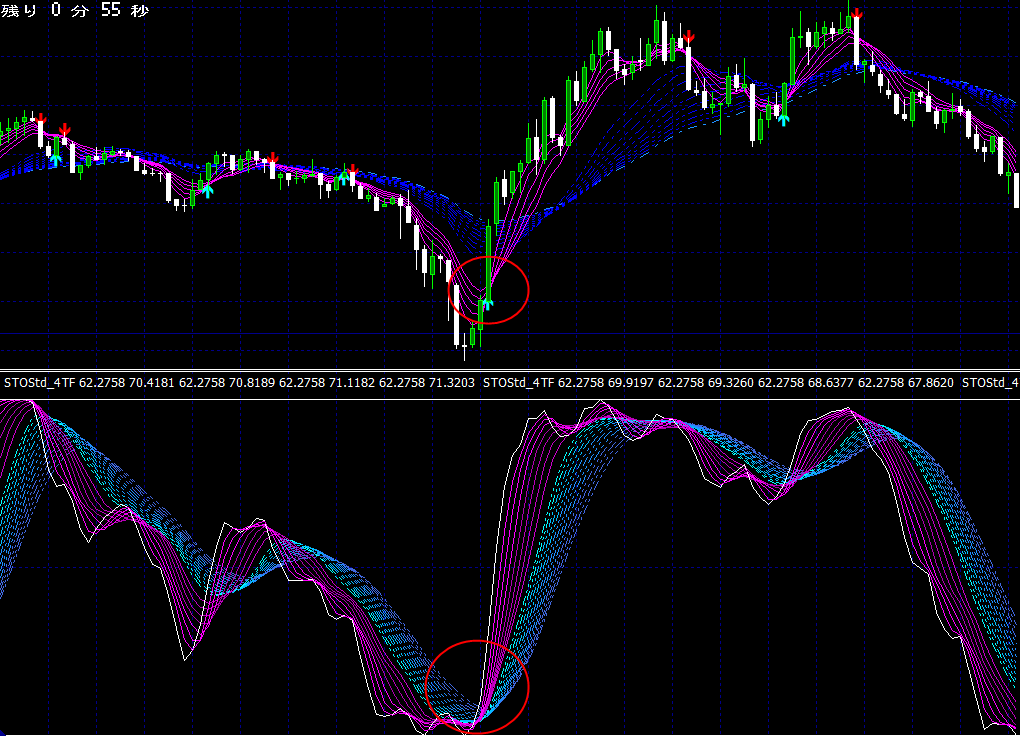
<Up pattern>
 Rising Example ②
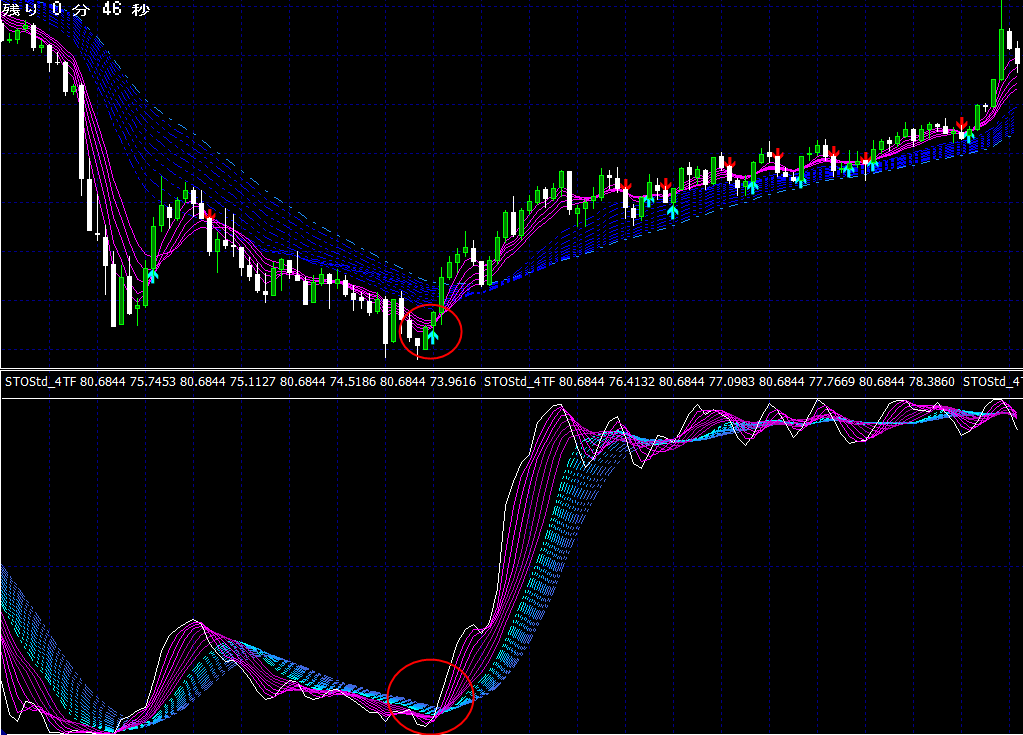 Rising Example ③
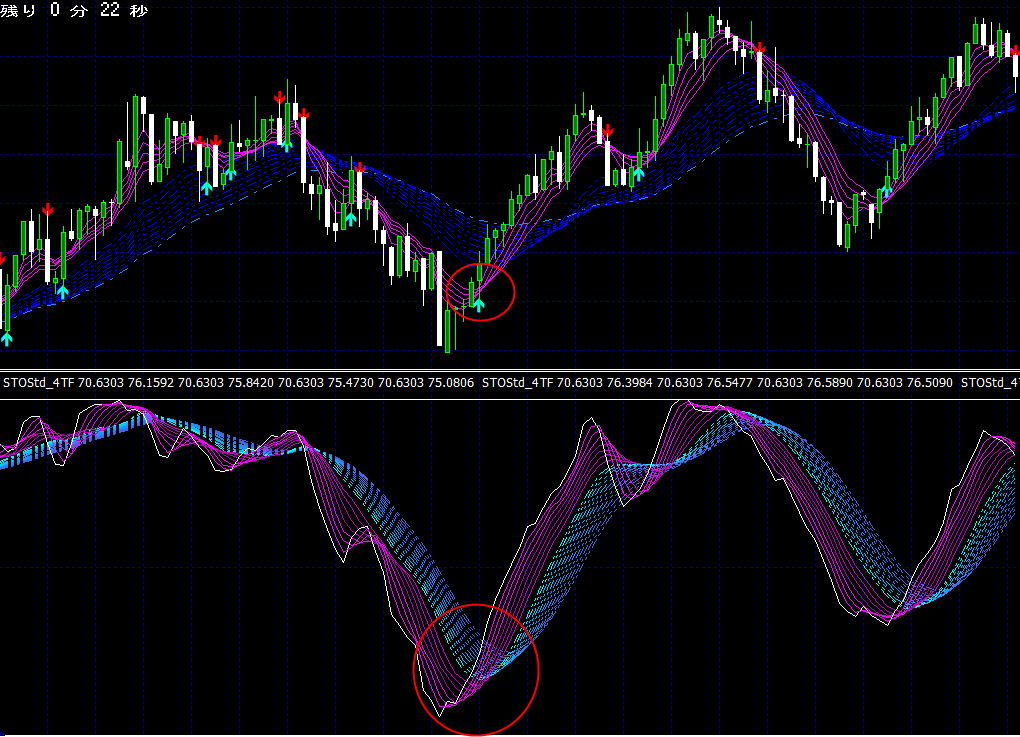 Rising Example ④
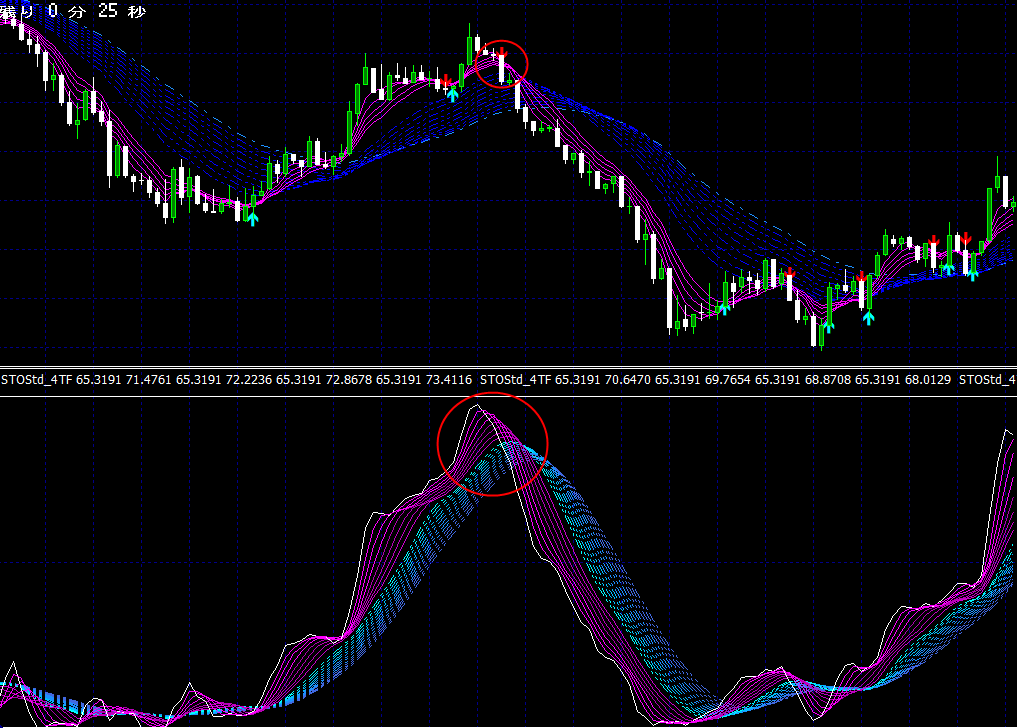
<Falling pattern>
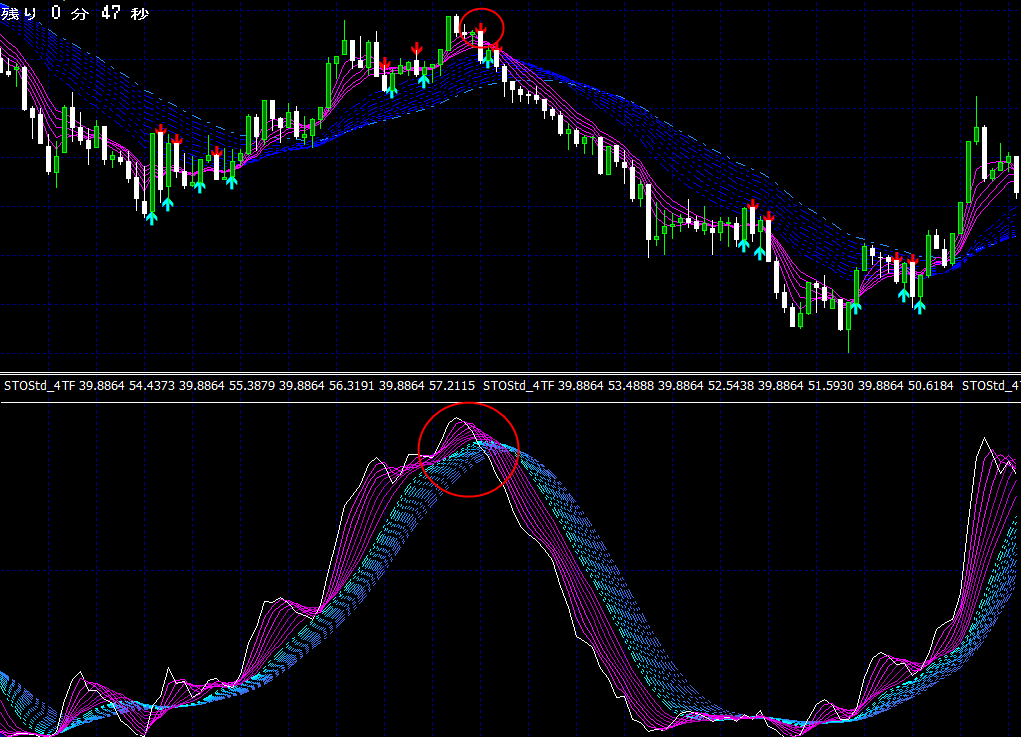 Downtrend Example ①
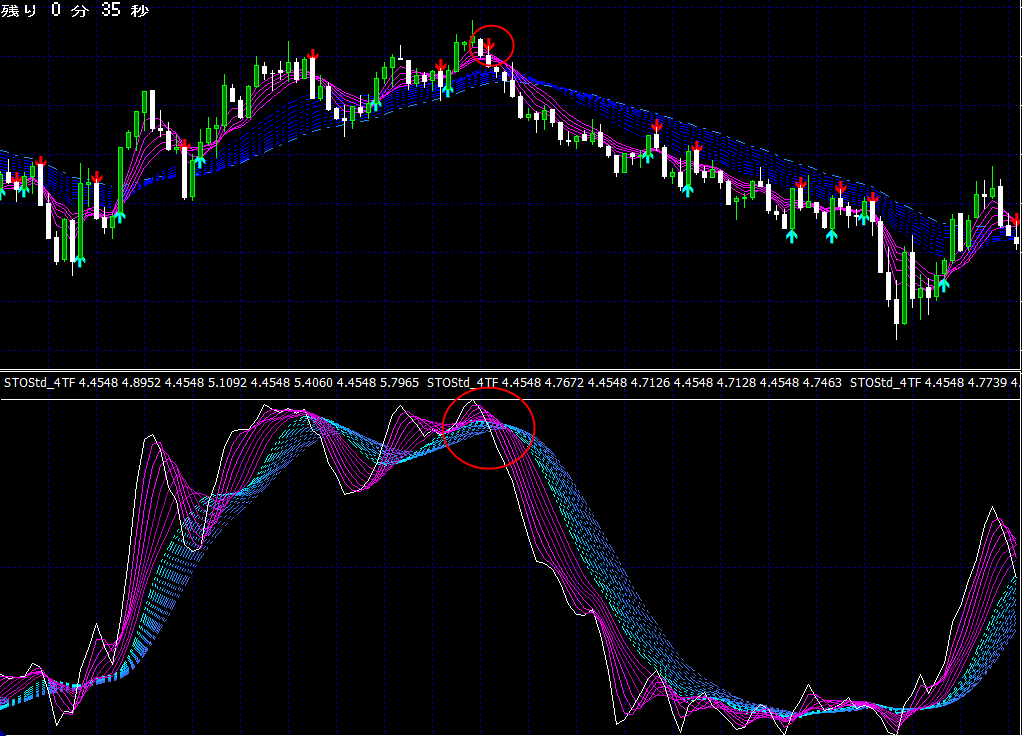 Downtrend Example ②
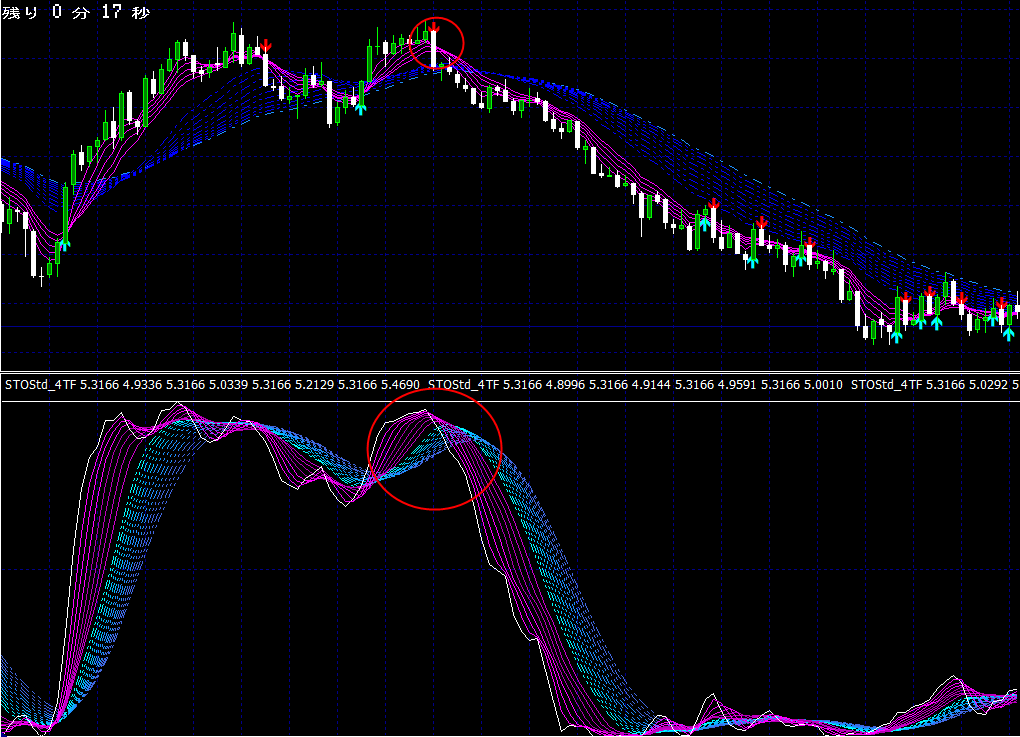
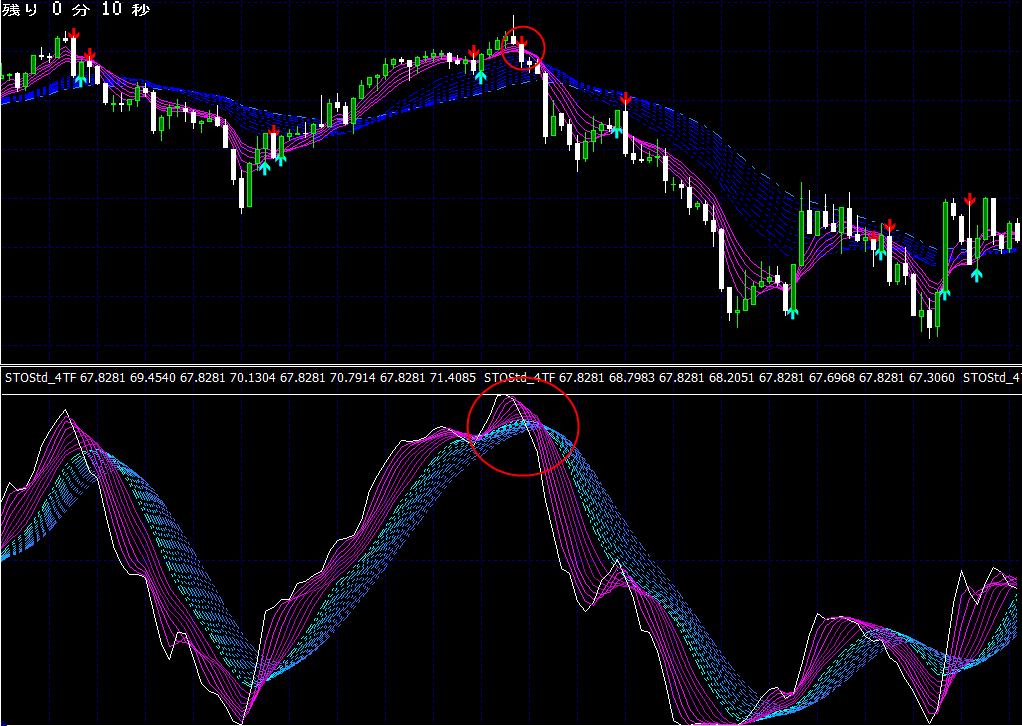 Downtrend Example ⑤
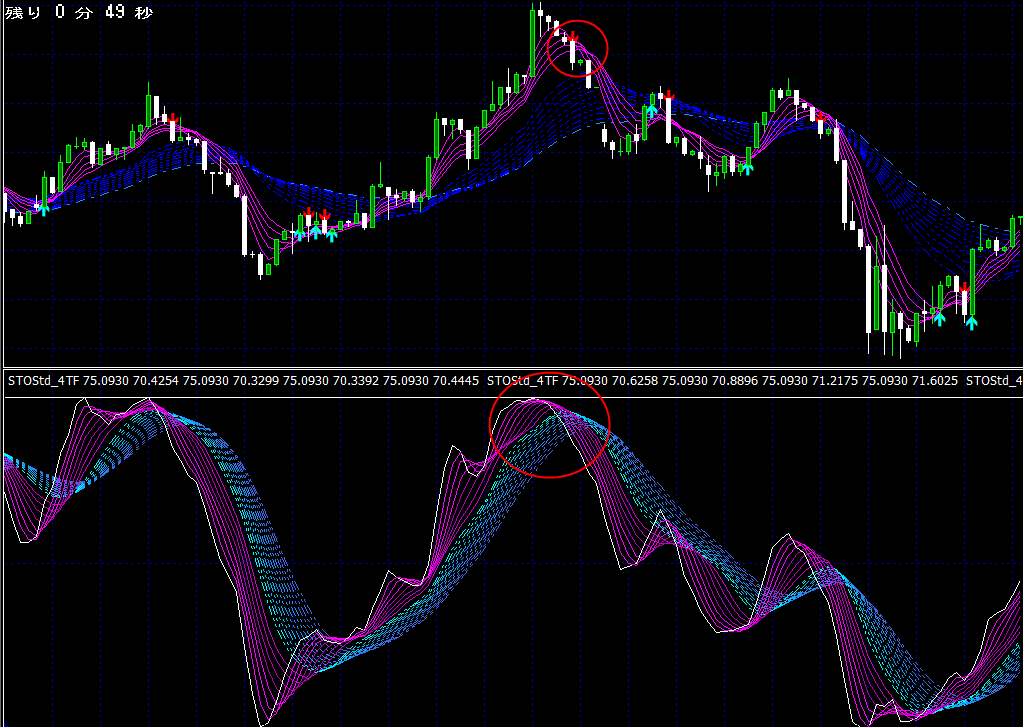 Downtrend Example ⑥
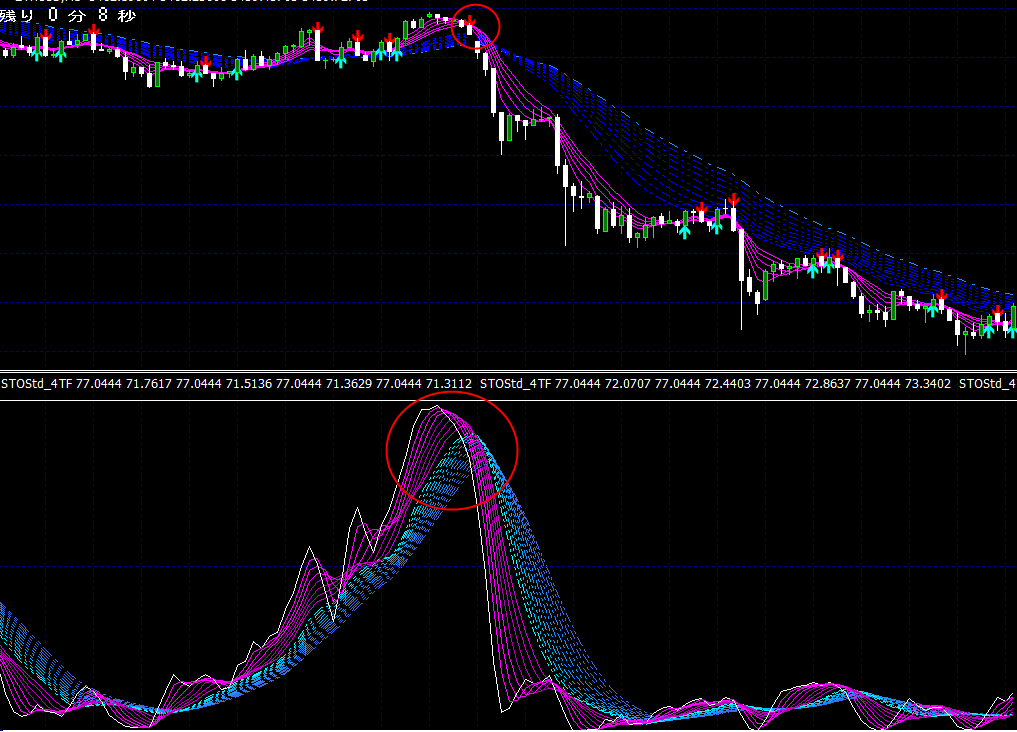 Downtrend Example ⑦
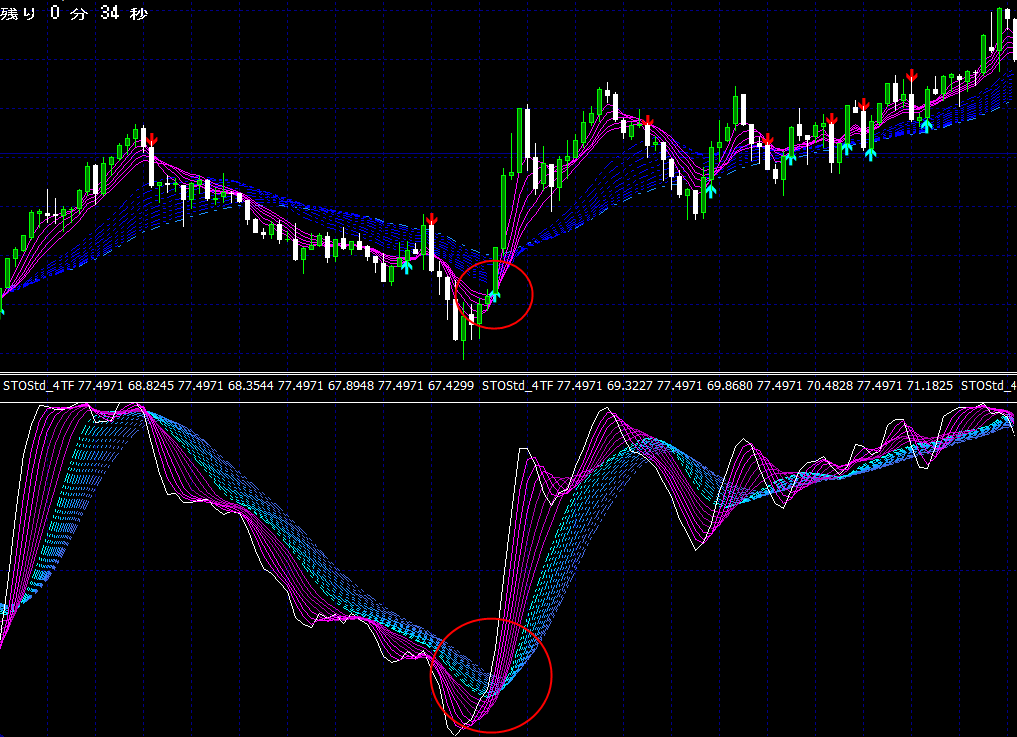
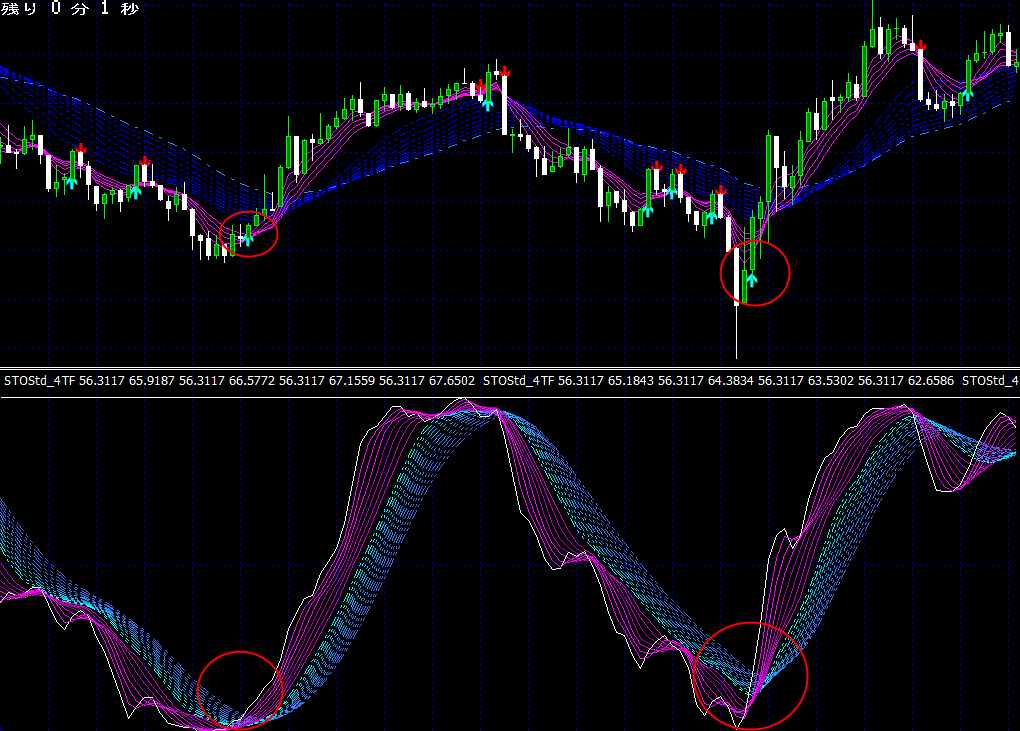
<Re-rise and re-fall patterns>
 Rising Example ①
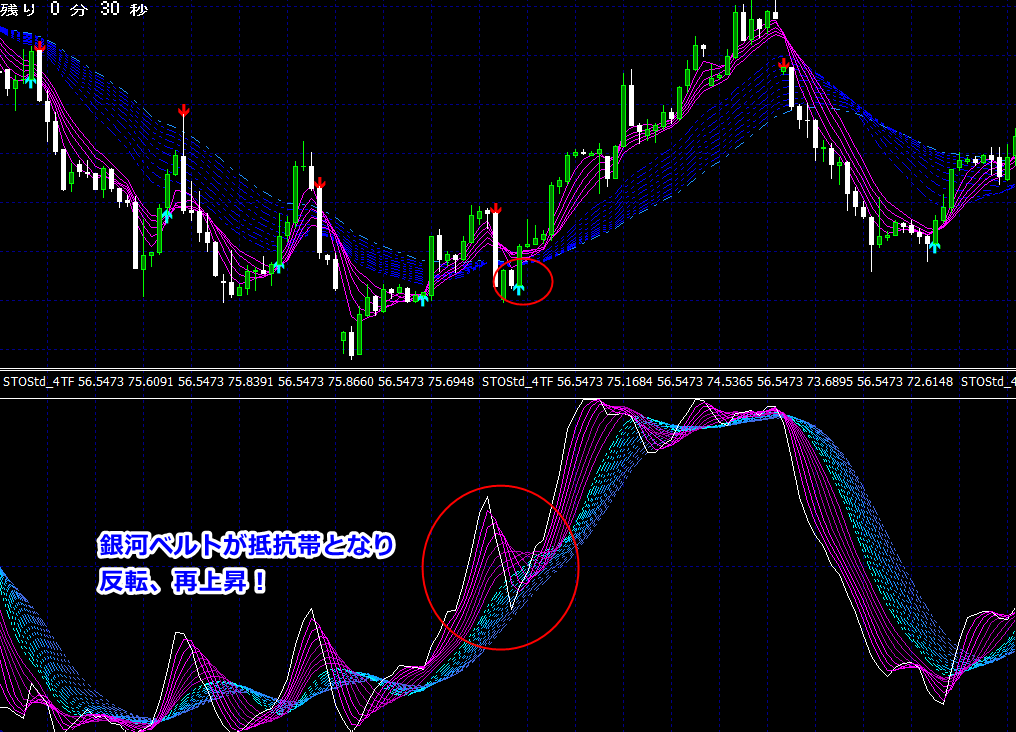 Rising Example ②
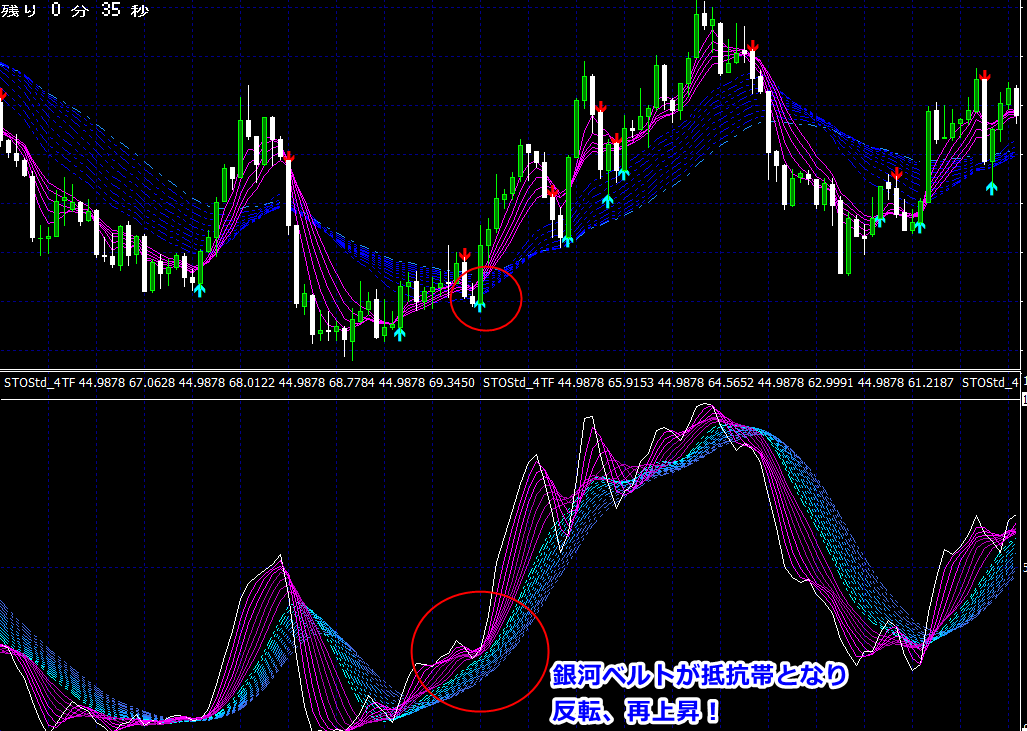 Rising Example ③
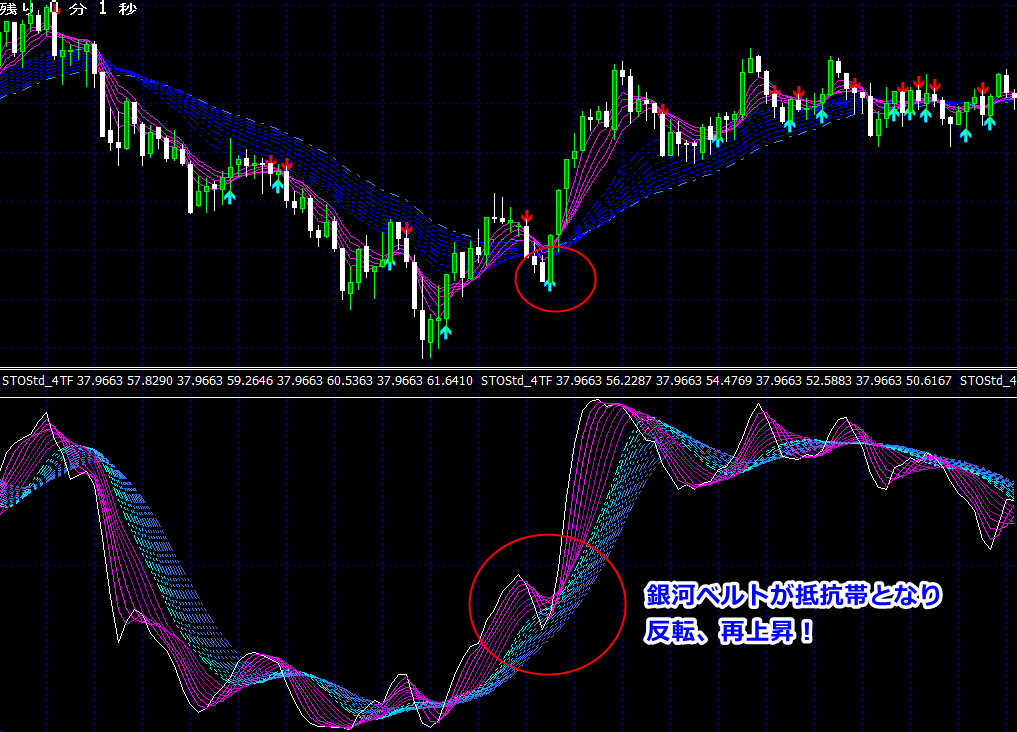 Rising Example ④
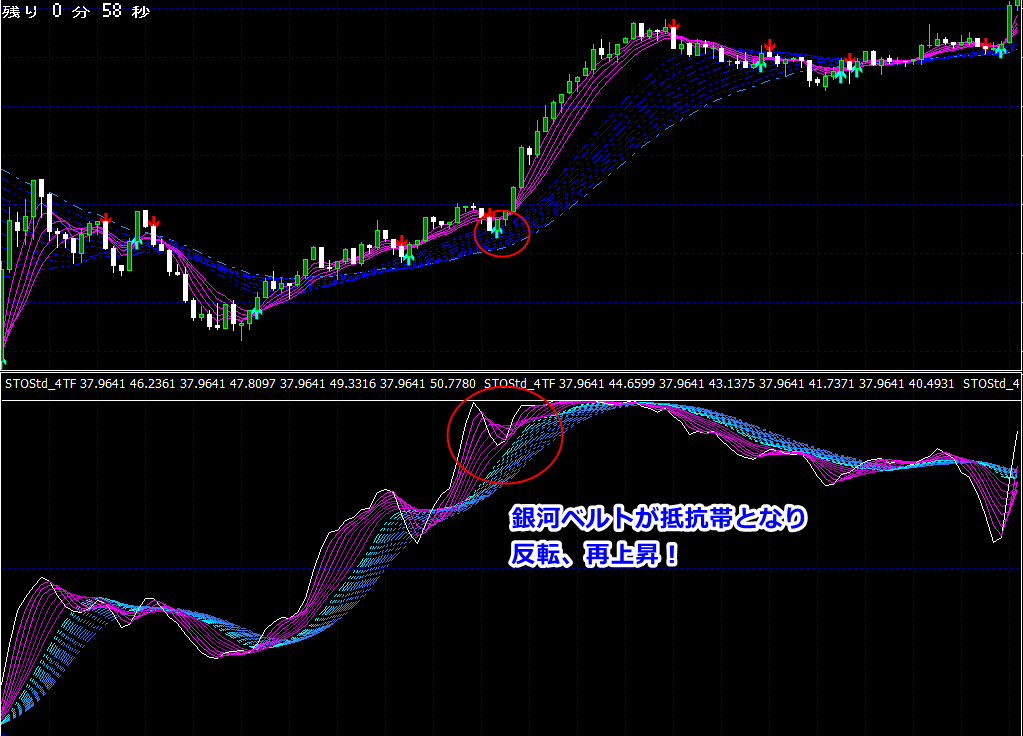 Rising Example ⑤
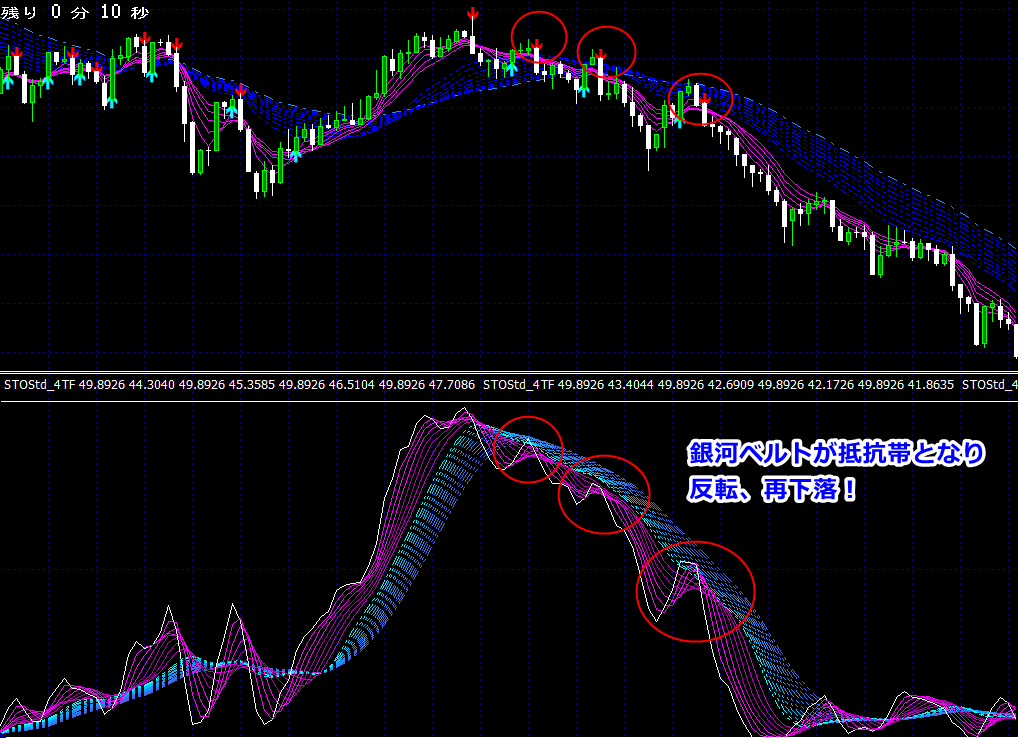
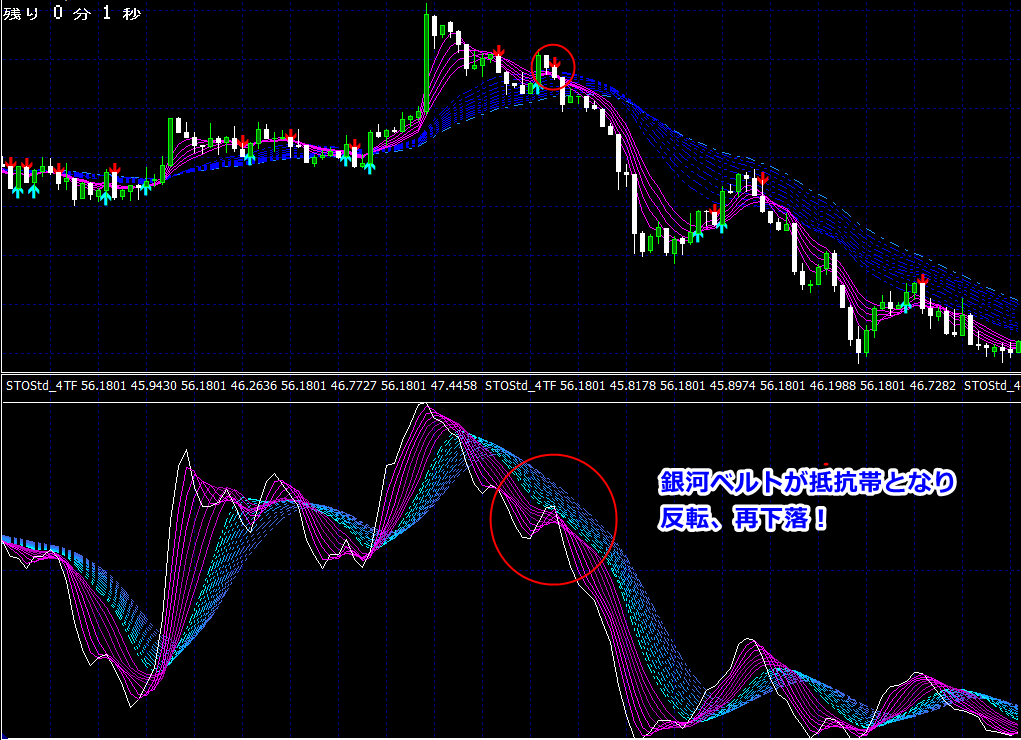 Downfall Example ②
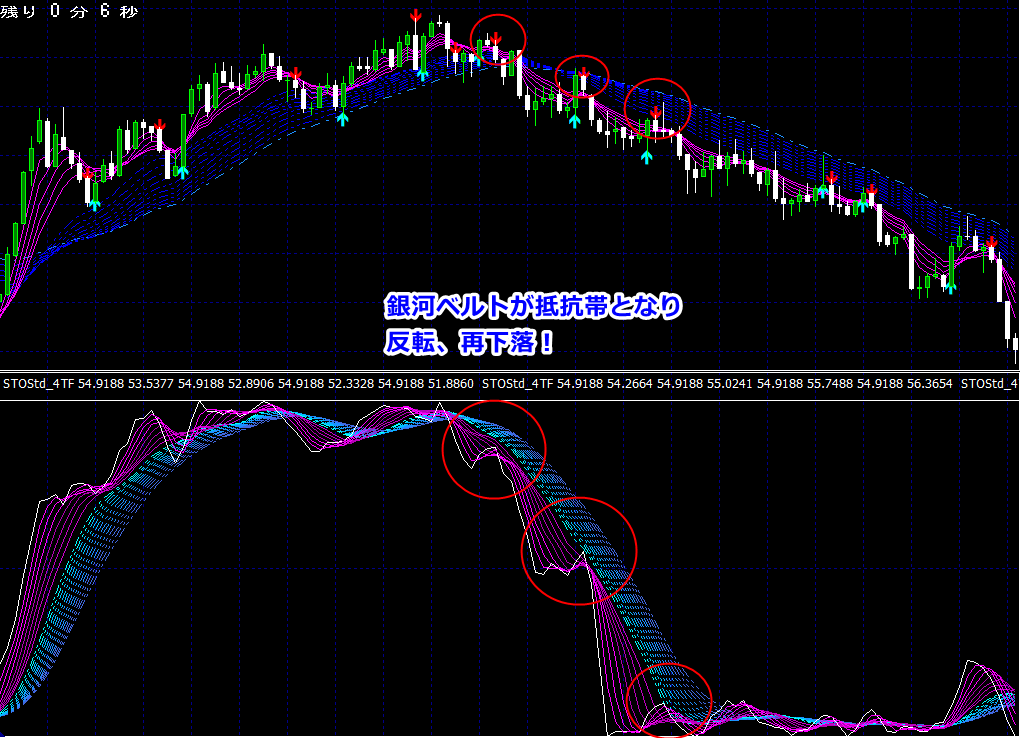
<Overall entry flow>Supports all timeframes, so please adapt to your trading style.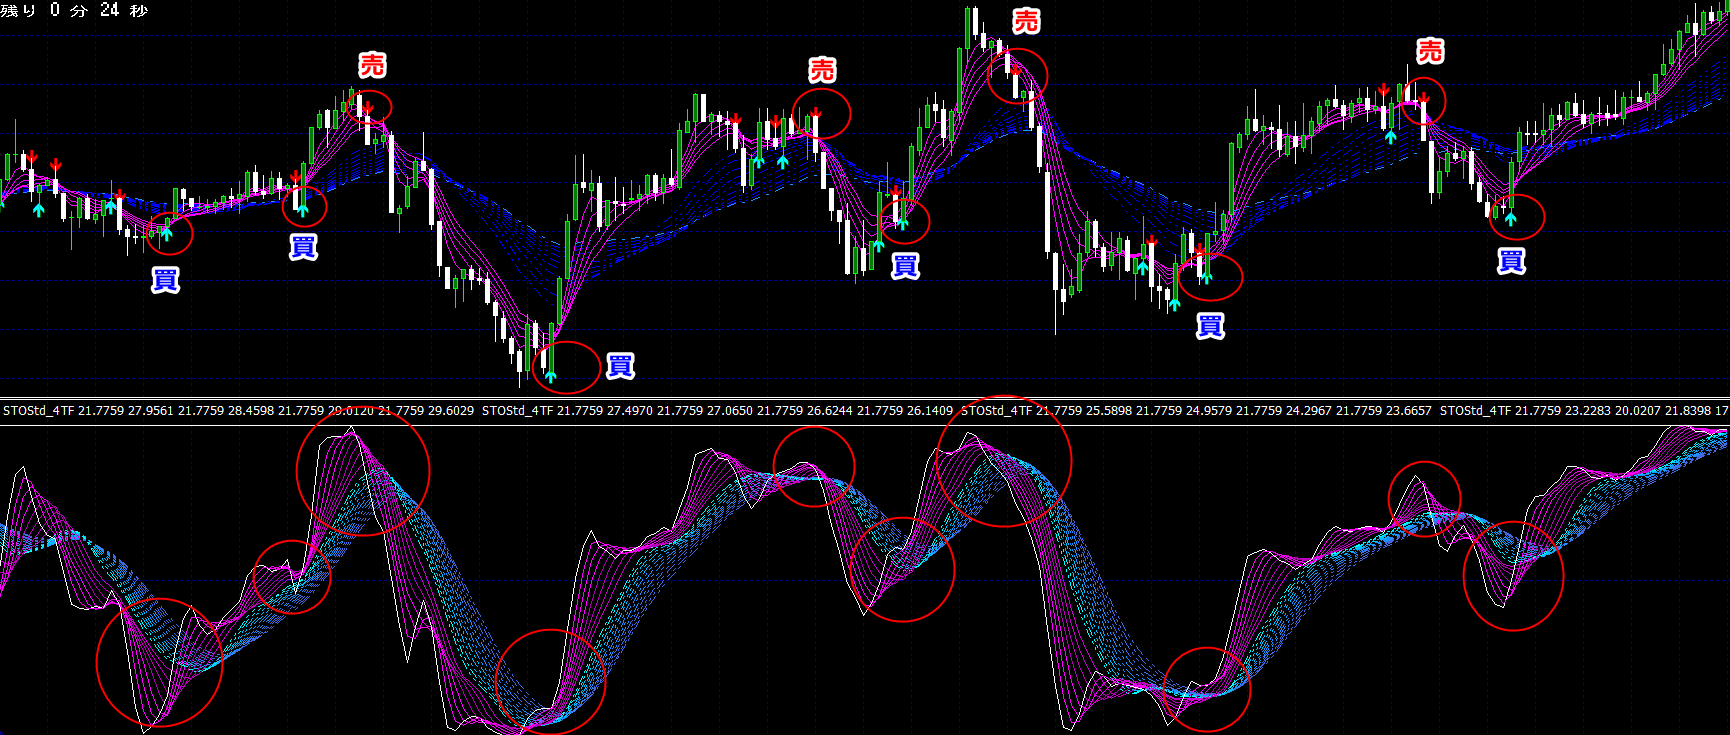 ‘Enter when the signal lights up + break of the galaxy belt!’
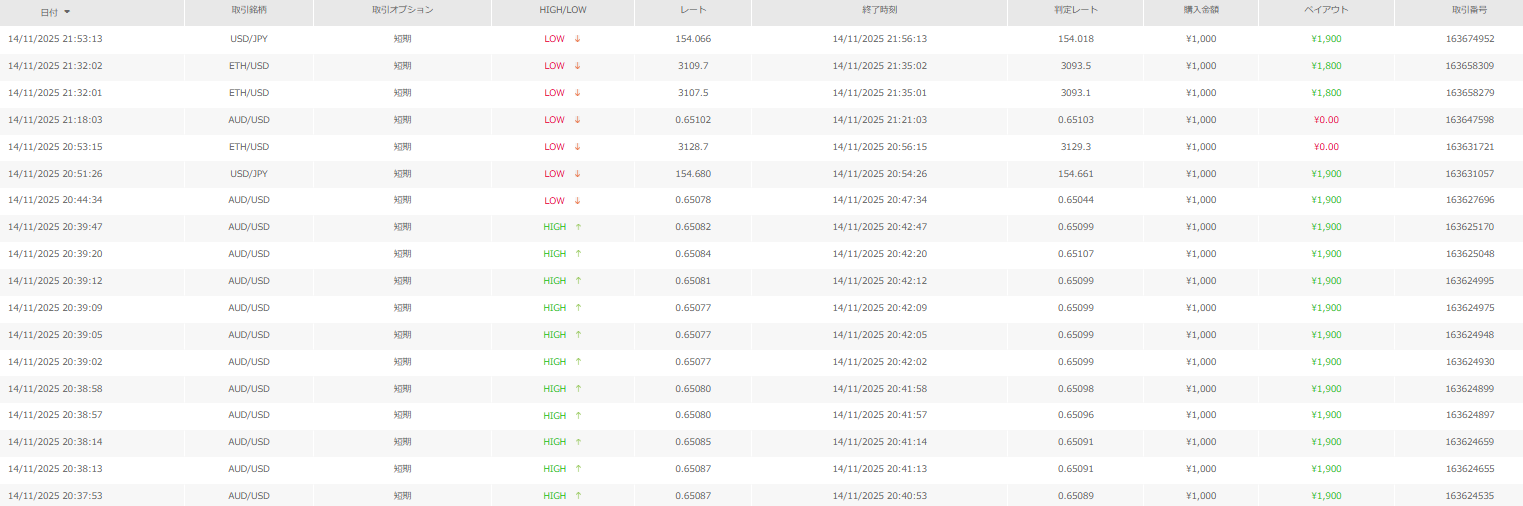
【Trading history】
26 wins 3 losses (win rate 89.6%)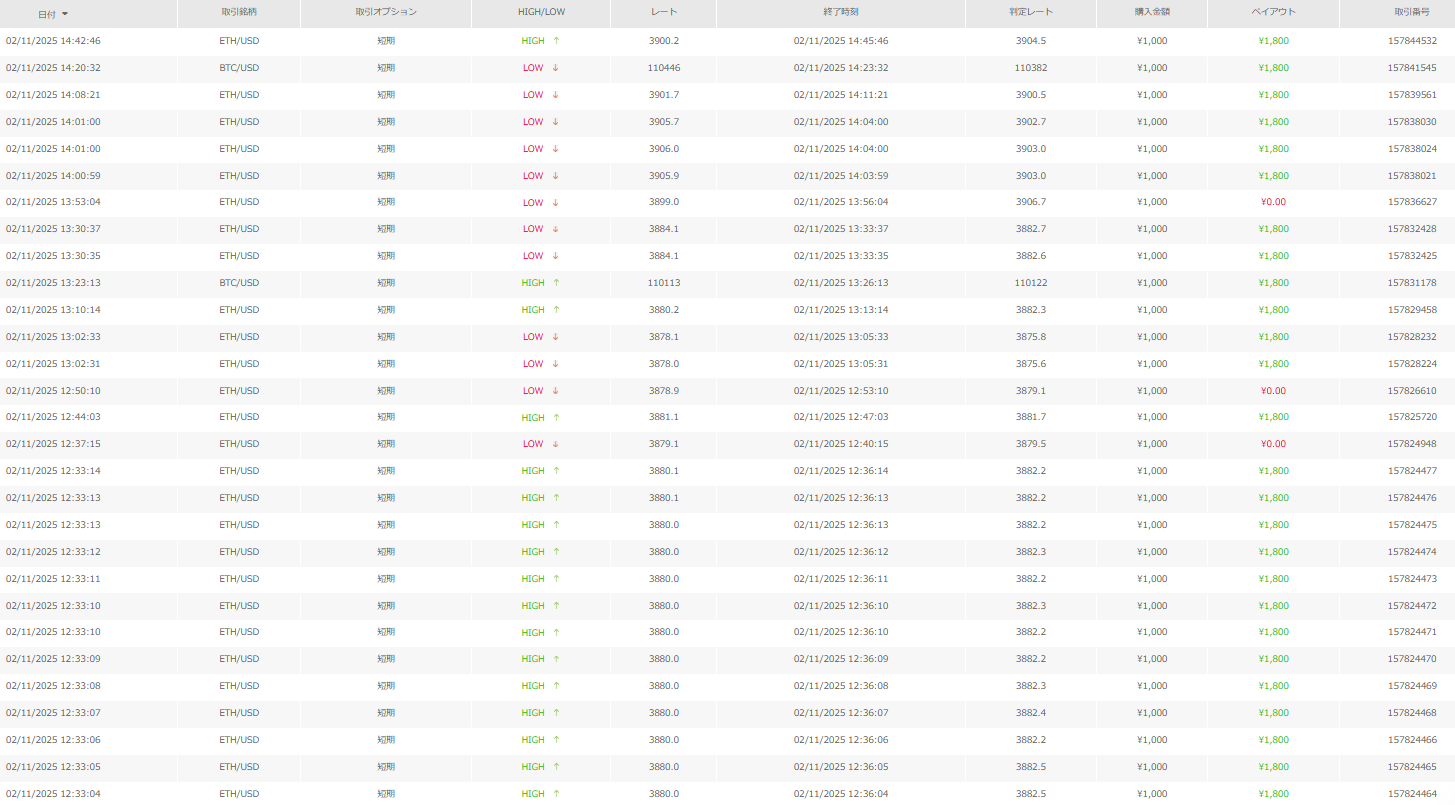
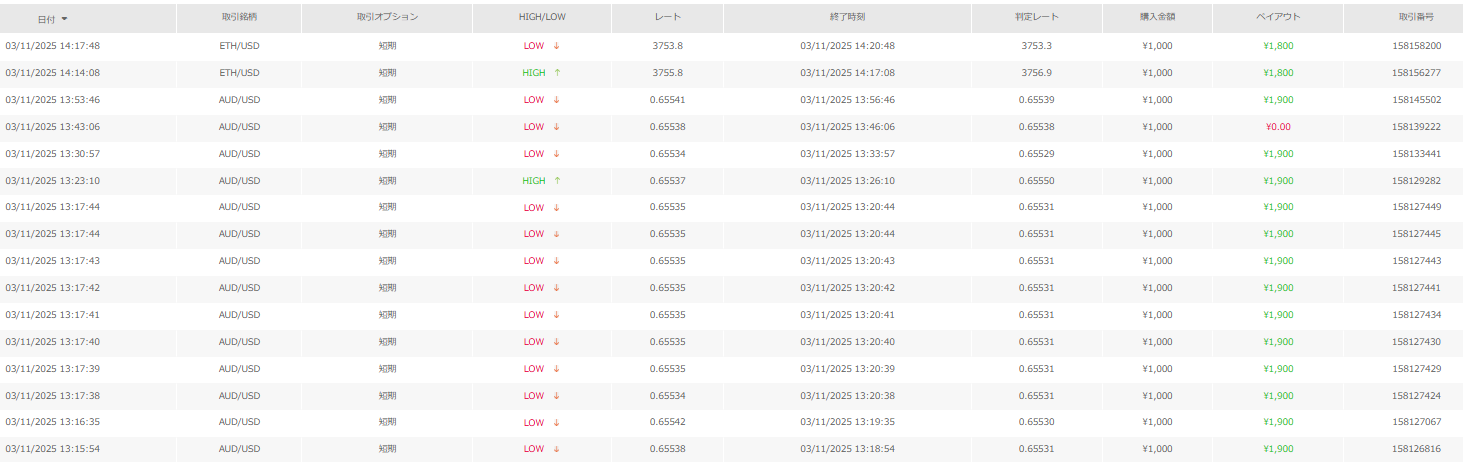
19 wins 3 losses (win rate 86.3%)
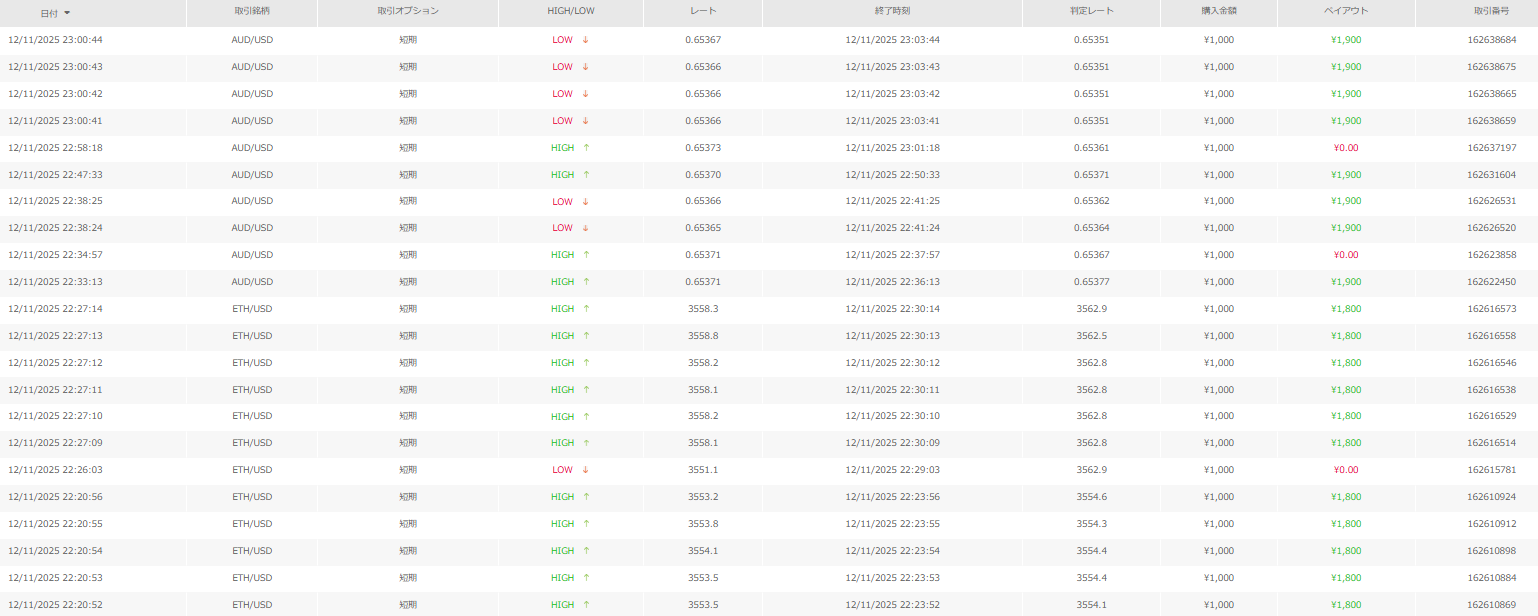
26 wins 4 losses (win rate 86.6%)
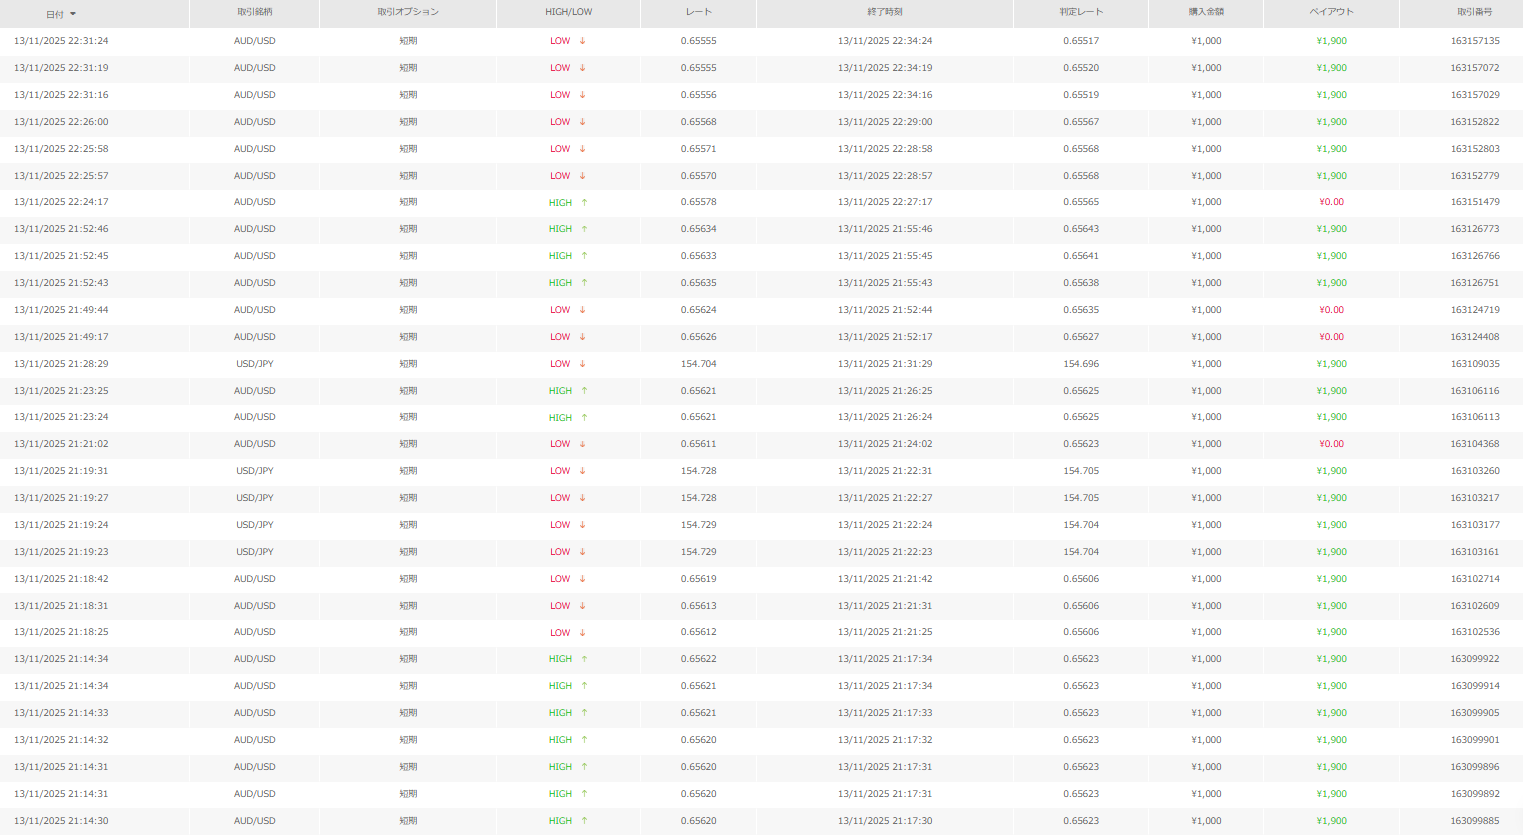
16 wins 2 losses (win rate 88.8%)
For details and purchase of the indicator,here!