

? GOLD Market Analysis Report 2026/03/24|Explanation of the Essence of the Retracement Sell Strategy and Entry Points
 GOLD Market Analysis Report
2026/03/24|Explanation of the essence of selling on rallies and entry points
GOLD Market Analysis Report
2026/03/24|Explanation of the essence of selling on rallies and entry points
Today's gold (XAUUSD) shows a continuing clear downtrend based on the latest price action, and the overall market structure remains in a “sellers’ advantage” state.
In this chart, it is not merely a decline but price action at a highly important point where a trendline coincides with a horizontal resistance, creating an extremely textbook and practical trading opportunity.
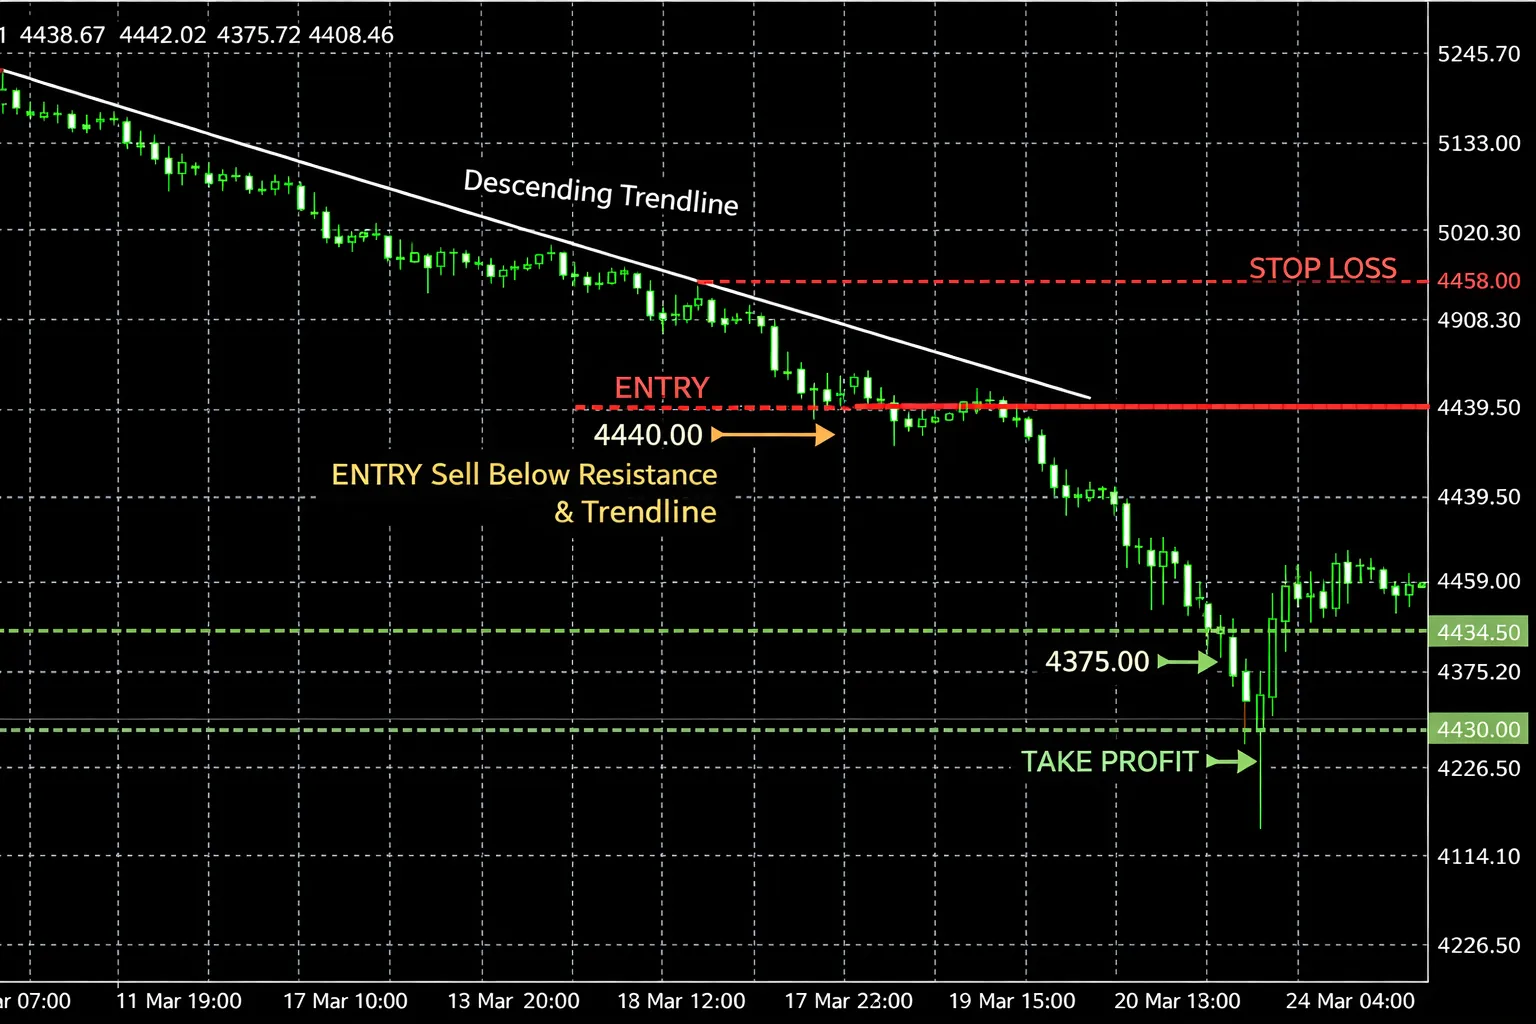
■ Current market structure: continuation of the downtrend First and foremost, the essence of this chart is the “downward trend.” From the structure of lower highs and lower lows, it is clear that the majority of market participants have a bearish view. In such a situation, what matters is not “where to sell” but “how far to pull back before selling.” Why? Because entering blindly within a trend invites quick stop-outs due to short-term reversals. Therefore, professional traders wait for a pullback and only build positions at high-probability points. ■ Meaning of the entry point (around 4440) In this chart, the entry point is set around the 4440 dollar level. This point is not just a price level but a “zone” formed by multiple overlapping factors. Specifically: - Contact with the downward trendline - Horizontal resistance line - Resistance-turned-support from past support (support turned resistance) These overlaps make this price band a place where selling tends to occur. In other words, this is not merely a technical point but a liquidity zone where market participants’ sell orders tend to concentrate. ■ The essence of selling on rallies This trade strategy is what is known as “selling on rallies.” But more importantly, it is not just any pullback selling, but a pullback selling based on structure. The flow is simple: 1) Confirm the downtrend 2) Price rises once (pullback) 3) Reaches resistance zone 4) Enter short Among these, the most important is step 3, the “resistance zone.” Selling here allows risk to be limited while maximizing potential return. ■ Take Profit point The take profit point is set around 4375. This is not just a random position but a target based on recent lows. Markets tend to move with awareness of past lows and highs, so take-profit orders tend to cluster at such points. Also, the essence of selling on rallies is “taking a part of the trend continuation,” so it is important to realize profits at a clear target rather than being greedy. ■ Stop Loss point The stop loss is set around 4458. This is a very rational level and corresponds to the trend-ending line. If this line is broken upward, it implies: - break of the trendline - breakthrough of resistance - collapse of the sell scenario In other words, “a place where one should admit defeat if surpassed.” By clearly defining the stop loss like this, trading becomes a probability game rather than mere gambling. ■ This trade’s edge The setup’s merit can be summarized in three points: 1) Aligns with the trend direction 2) Entry at a point where multiple grounds converge 3) Clear risk-reward Of these, the second is especially important. Not a single indicator alone, but the convergence of: - Trendline - Horizontal line - Market structure creates an edge. ■ Risks to be aware of However, even trades with high edge carry risks: - Reversal near the end of the trend - Sudden moves from indicators - False breakouts Gold’s volatility is high, so position size and stop loss settings are essential. ■ Summary The essence shown by this chart is very simple: “In a downtrend, sell on any rise.” And more importantly: “Don’t sell anywhere. Only sell at locations with an edge.” This mindset is the biggest difference between beginners and pros. Trading is not a game you participate in every time. Pick only favorable situations, limit risk, and accumulate profits. That is the only way to win in the long run.
× ![]()