

Gold Analysis on 2026/03/24
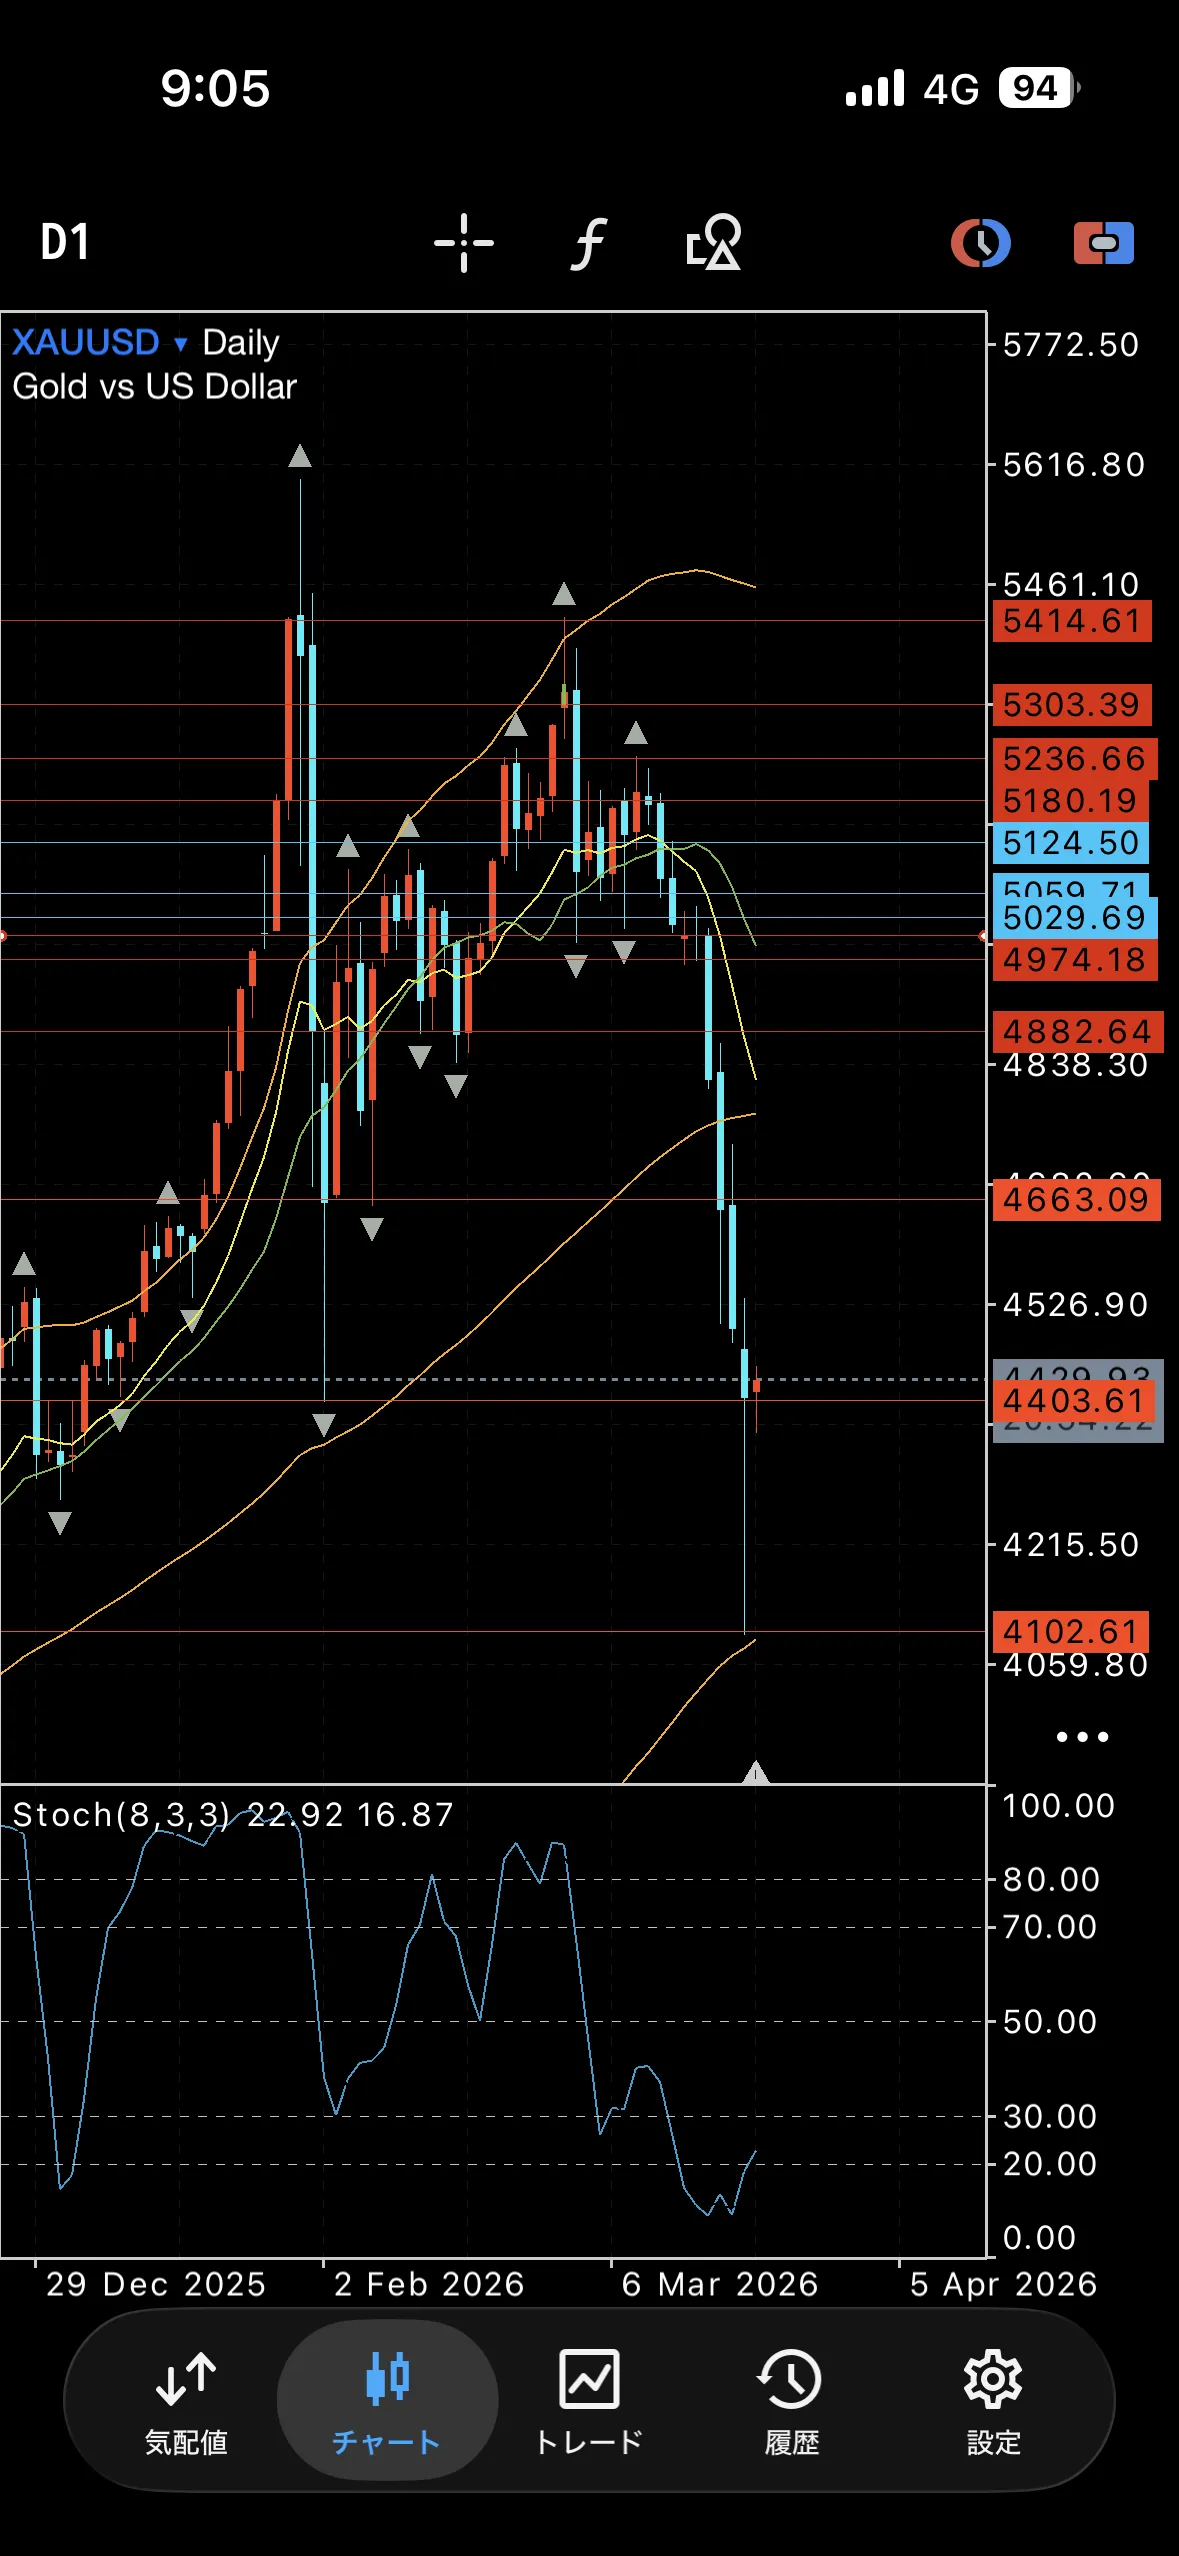
【Yesterday's daily chart】
Bearish spike
【Daily oscillator】
Lower bound
【Perspective】
Long-term up
Short-term down
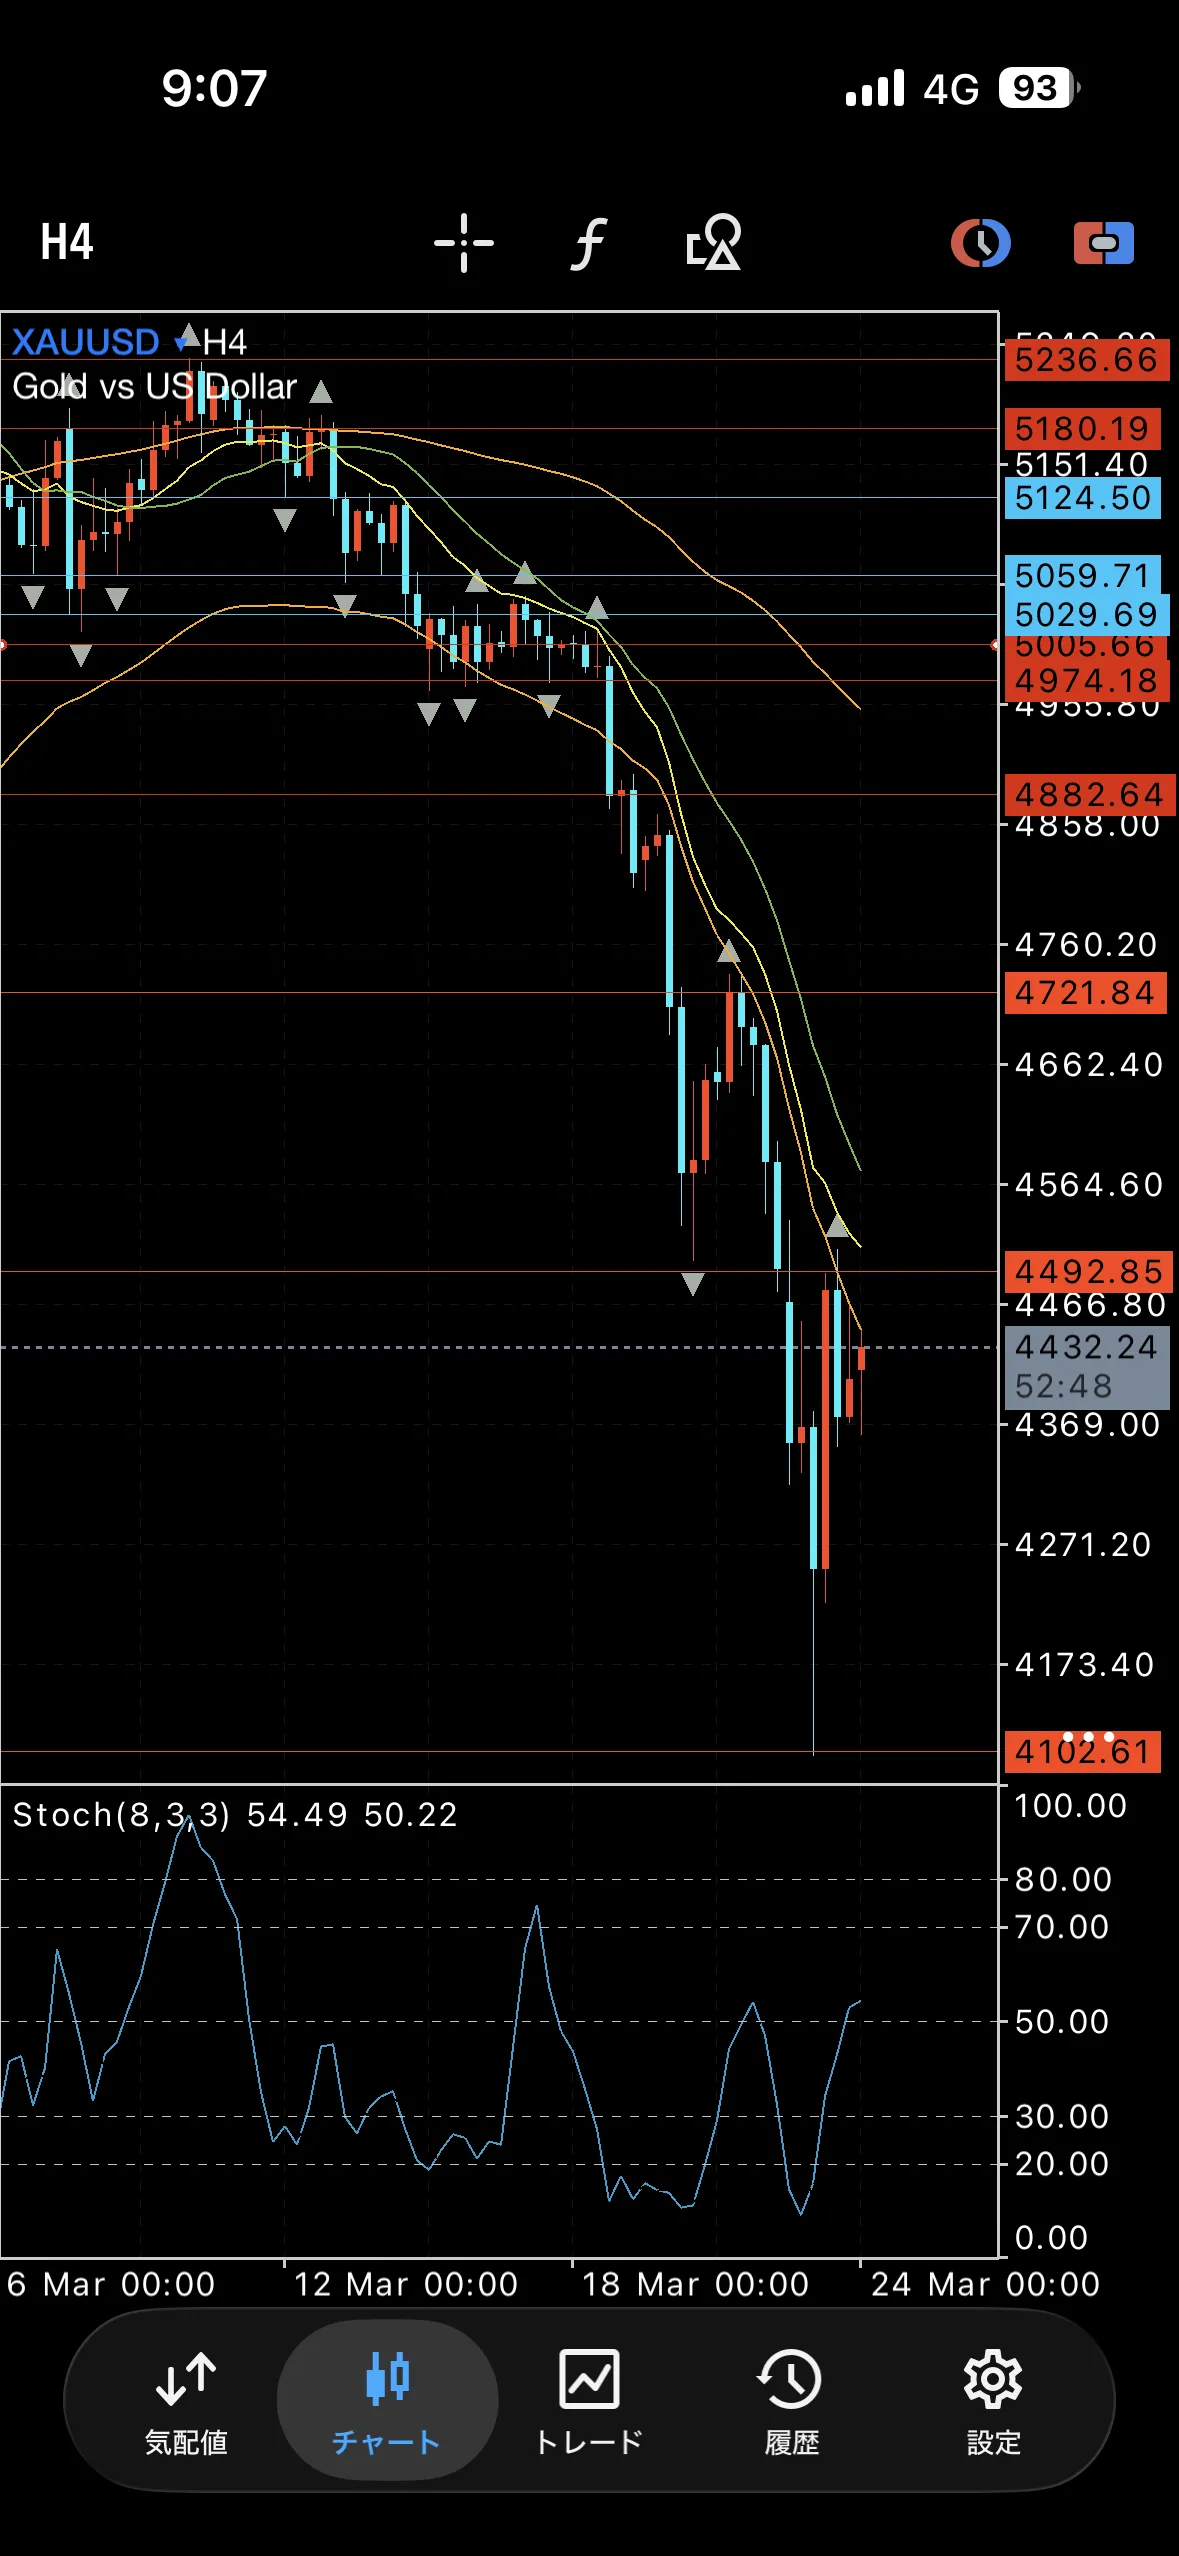
【Impressions on the 4-hour chart / short-term perspective】
Because a relatively large bullish outside appears, the outlook remains bullish until the price breaks below the starting area around 4253–4100 on the 4-hour chart or smaller timeframes
However, since the Dow is down, it is clear that selling pressure is high; waiting for a second bottom is the standard approach.
【Indicators in focus】
Near 1-hour 20MA
【Other regularly behaving indicators / brief thoughts on the short-term chart】
As of this morning, the 1-hour chart has broken near the 20MA and is also crossing with the short-term MA, so the outlook is bullish up to around the 4-hour middle area
This morning, the 4492 horizontal level held, and whether the price drops as per Dow or breaks above here will be one of the key points
Yesterday, 800 pips moved in a single 15-minute candle
Since there is a limit to low lot sizes, there is also the option to stay patient until volatility decreases
【Key horizontal support/resistance levels (all around these zones)】