

Dashboard Harmonics_v9 three strengths
Introduction
In FX trading, the “harmonic patterns” boast high reversal probabilities.
However, there are barriers that many traders face.
“It's hard to spot patterns and I end up missing them.”
“It's physically impossible to monitor multiple currency pairs.”
“Fibonacci calculations are cumbersome.”
To solve these concerns all at once,Dashboard_Harmonics_v9was developed. This article詳しく解説します
Three strengths of Dashboard_Harmonics_v9
1. Multi-currency and multi-timeframe monitoring in one view
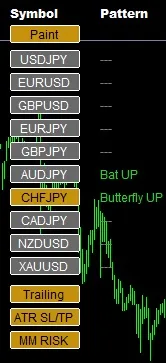
The main feature of this tool is,the ability to list the pattern detection status for all currency pairs and all timeframes on a single chart.
Efficiency:There is no need to open and close dozens of charts.
Visualizing opportunities:When a pattern forms, you are immediately notified on the dashboard.
2. An interface optimized for visibility and operability
In v9,操作が直感的になりました。→ In v9, operations have become even more intuitive.
| Function | Content |
| One-click display | Click the currency name on the dashboard to instantly switch to the corresponding chart. |
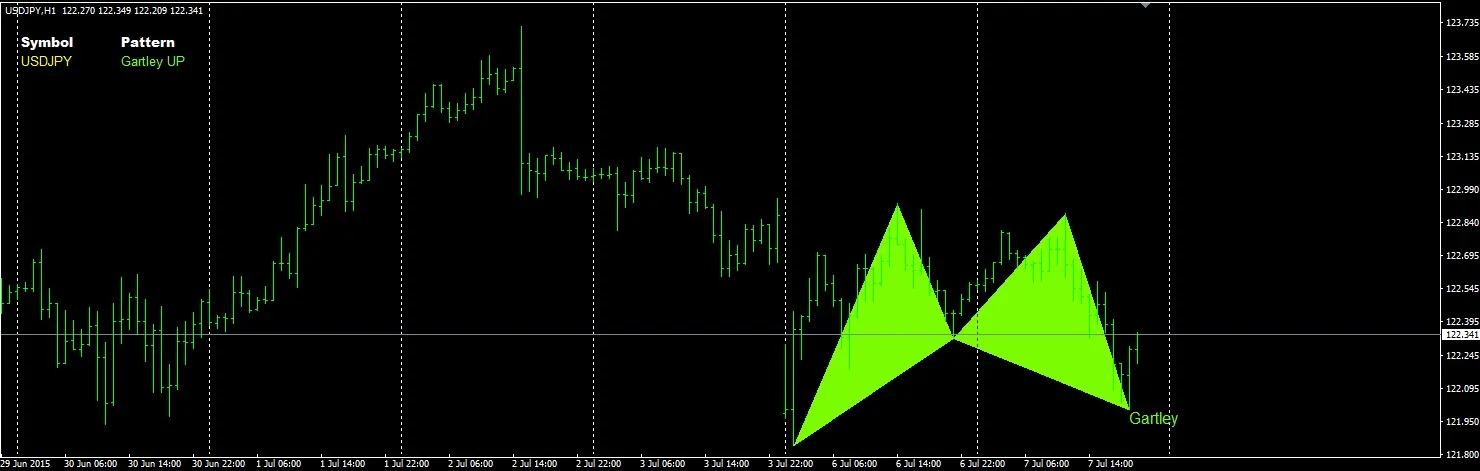
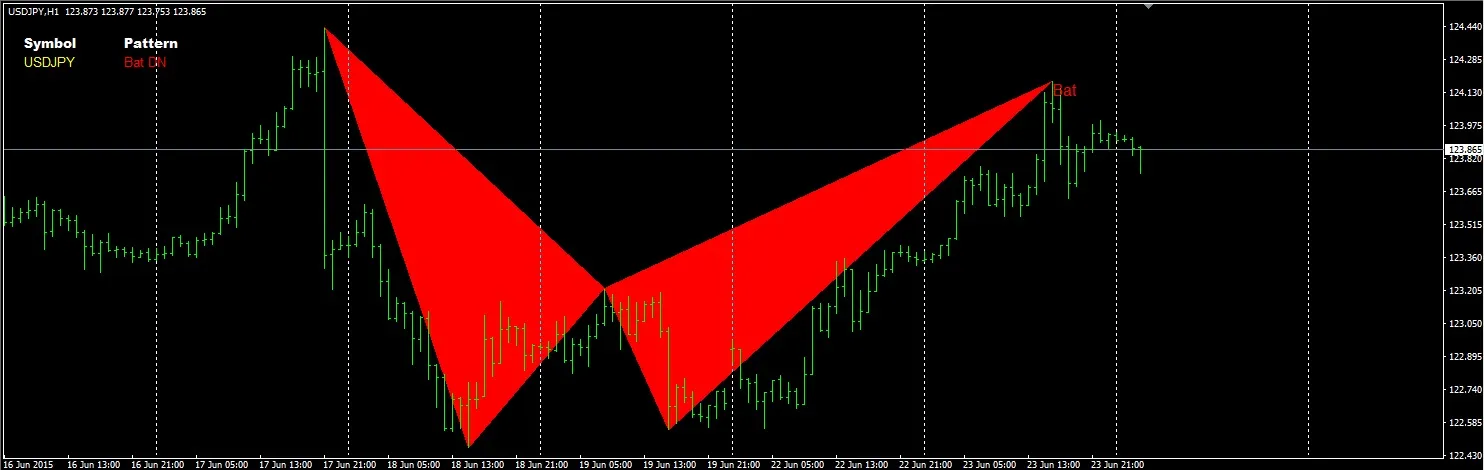
| Refined drawing | Encapsulates major patterns such as Gartley, Bat, Butterfly, Crab, Shark, etc. |
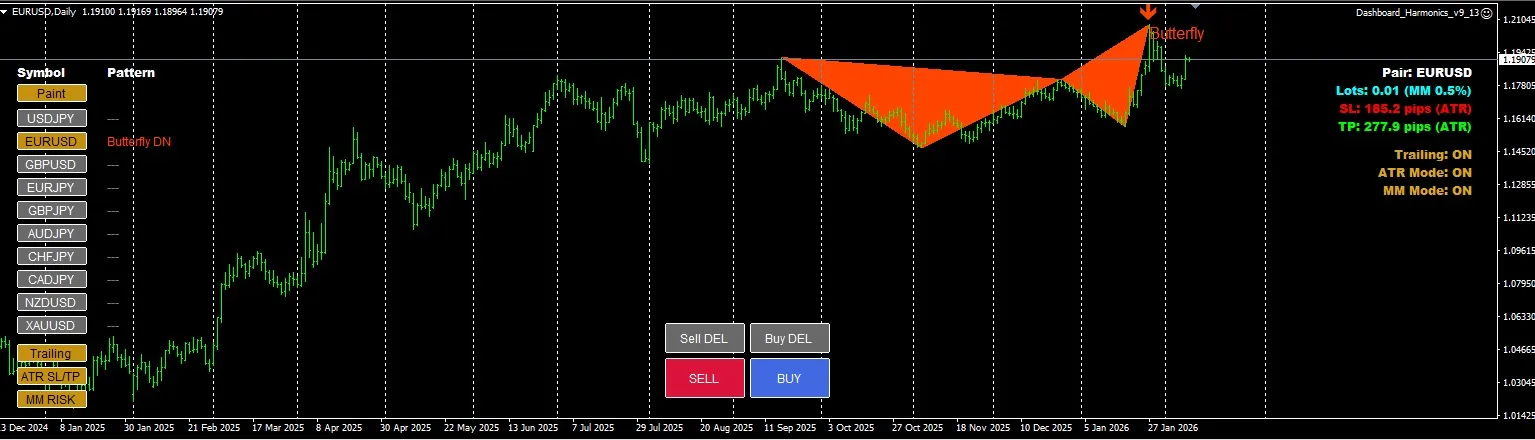
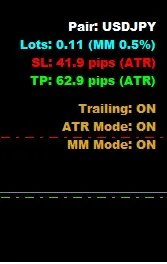
| Target display | Automatically plots entry, stop-loss (SL), and take-profit (TP) targets. |
Actual trading usage image
Harmonic patterns target reversals at the PRZ (Potential Reversal Zone). With Dashboard_Harmonics_v9, you can engage in smart trading like the following.
Alerts occur:Confirm pattern completion on the dashboard.
Environment awareness:Check if it aligns with the higher timeframe trend direction.
Entry:Place orders based on the drawn SL/TP targets.
Summary: For those who want to balance “time efficiency” and “precision” in trading
It is impossible to monitor the market 24 hours a day. However,Dashboard_Harmonics_v9will have the system monitor the market around the clock on your behalf.
Want to improve the precision of discretionary trading.
Want to reduce monitoring time and gain more free time.
Want to know evidence-based entry points.
If so, please try introducing this ultimate dashboard to your charts.
▼ Product page is here
https://www.gogojungle.co.jp/tools/indicators/75768