

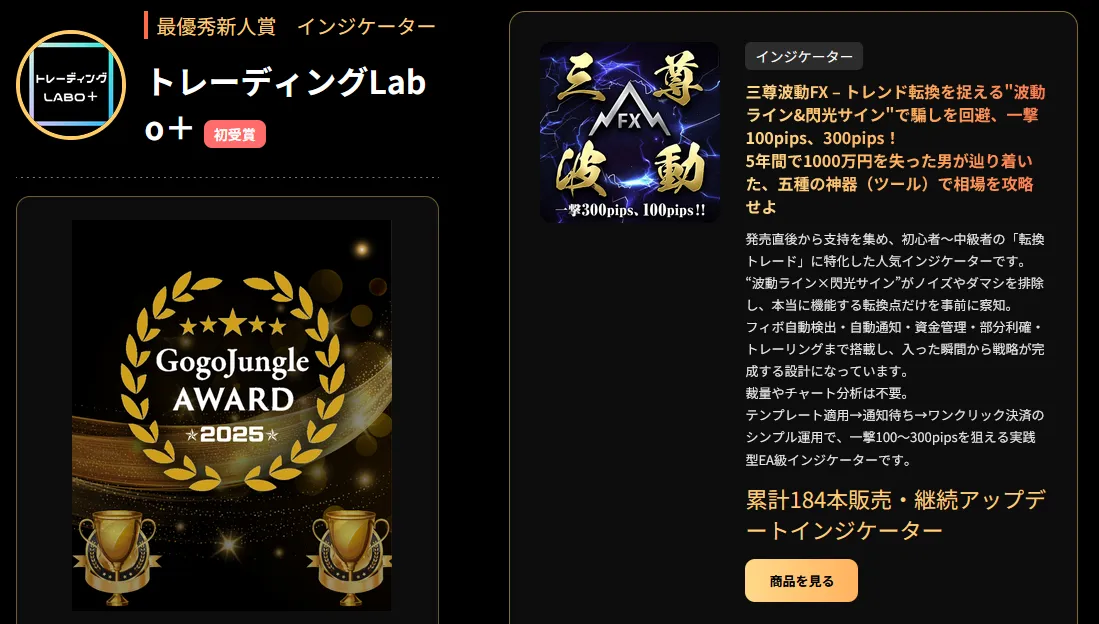
Why Three-Wave FX Uses 15-Minute Chart
▼Details page for Sansonhōdō FX is here
https://www.gogojungle.co.jp/tools/indicators/65204?via=users_products
This is SEI of Trading Labo+.
Thank you for always taking a look.
Today’s topic is “Why does Sansonhōdō FX use a 15-minute chart?”
◆ Why the 15-minute chart?
In FX, there are various timeframes.
1-minute, 5-minute, 15-minute, 30-minute, 1-hour, 4-hour, daily...
Different traders have different preferences for timeframes.
Scalpers prefer the 1-minute or 5-minute charts, while swing traders prefer the 4-hour or daily charts.
Then why does Sansonhōdō FX adopt the 15-minute chart?
The answer is simple.
Because the method is easiest to perform this way.
And the 15-minute chart offers many benefits to traders.
This time, we’ll explain in detail why Sansonhōdō FX uses the 15-minute chart.
1. The method is the easiest to use
First, the most important reason.
The 15-minute chart is the timeframe that best utilizes Sansonhōdō FX’s method.
Characteristics of Sansonhōdō FX
Sansonhōdō FX is a method that captures waves and patterns.
It identifies turning points in the market and enters at points with high edge.
To use this method, a certain amount of price movement is required.
On the 1-minute or 5-minute charts, there is too much noise, making the real wave difficult to see.
Conversely, on the 1-hour or 4-hour charts, there are too few entry opportunities.
The 15-minute chart offers the best balance.
The 15-minute chart combines the speed of short-term charts with the reliability of medium-to-long-term charts.
1-minute & 5-minute: fast but noisy and less reliable
15-minute: moderate speed and sufficient reliability
1-hour & 4-hour: high reliability but fewer opportunities
The 15-minute chart maximizes the effectiveness of the Sansonhōdō FX method.
2. Better capital efficiency
Trading on the 15-minute chart greatly improves capital efficiency.
What is capital efficiency?
Capital efficiency is a measure of how efficiently you can trade with the same capital.
For example, trading on the daily chart may take several days to weeks per trade.
During that time, your capital is tied up in the position.
However, on the 15-minute chart, one trade finishes in several hours to half a day.
With the same capital, you can gain more trading opportunities.
Comparison with numbers
For example, assume 100,000 yen in capital.
Daily chart trading:
One trade takes about a week
About 4–5 trades per month
15-minute chart trading:
One trade finishes in a few hours
About 20–30 trades per month
Even with the same capital, the 15-minute chart yields vastly more opportunities.
That’s capital efficiency.
3. The number of trades is just right
The 15-minute chart has the major advantage that the number of trades is just right.
What if there are too few trades?
Trading on the 4-hour or daily chart yields too few opportunities.
Only 1–2 times per week, or even a few times per month.
This makes it hard to gain experience and slows growth.
Also, too few opportunities can create urgency to chase a chance and lead to impulsive entries.
What if there are too many trades?
On the 1-minute or 5-minute charts, opportunities are abundant.
Dozens of entries per day can exhaust you.
Too many trades can lead to a counting-pots syndrome (always being in a position).
You need to be in a position constantly, which is very dangerous.
The 15-minute chart is just right
With the 15-minute chart, opportunities come a few times in 1–2 days.
Not too many and not too few; an appropriate frequency.
Since opportunities are moderate, you can aim for high-edge points without rushing.
And with appropriate rests, you can maintain focus without fatigue.
4. You can accumulate experience at a moderate speed
Growing as a trader requires accumulating experience.
And to accumulate experience, you need an appropriate number of trades.
Growth is slow on daily charts
With daily chart trading, you can trade only a few times a month.
That’s only about 50 trades in a year, very slow growth.
Growth speed becomes very slow.
On the 1-minute chart, quality is low
Trading on the 1-minute chart allows dozens of trades per day.
But most are low-quality trades driven by noise.
Even with high quantity, it’s hard to accumulate meaningful experience.
The 15-minute chart allows moderate speed with high-quality experience.
With the 15-minute chart, you can make about 20–30 trades per month.
That’s about 200–300 trades in a year.
And each trade is a high-quality trading experience.
Trades that are not swayed by noise and that properly capture waves.
With moderate speed, you accumulate high-quality experience.
This is a major strength of the 15-minute chart.
5. Stop loss and take profit widths are just right
The 15-minute chart has the feature that stop loss and take profit widths are just right.
Problems with 1-minute and 5-minute charts
Trading on 1-minute or 5-minute charts makes stop-loss widths very narrow.
For example, about 5–10 pips.
This means a little noise can hit your stop loss.
Also, take profit widths are narrow, worsening risk-reward.
Problems with daily and 4-hour charts
Conversely, trading on daily or 4-hour charts makes stop losses very wide.
For example, 100–200 pips, sometimes over 300 pips.
With one stop loss you can lose a large amount of capital.
Mentally, it is also a heavy burden.
The 15-minute chart is just right
On the 15-minute chart, stop loss widths of about 20–40 pips are common.
Not too wide, not too narrow; a just-right width.
It is less susceptible to noise and keeps the amount of loss per trade within a tolerable range.
Take profit widths can also target about 50–100 pips, making it easier to secure a risk-reward ratio of 1:2 or better.
Stop loss and take profit can be set without forcing.
That is a major advantage of the 15-minute chart.
6. Bad habits are less likely to form
This is often overlooked but very important.
The 15-minute chart is a timeframe where bad habits are less likely to form.
Bad habits formed on 1-minute and 5-minute charts
Trading on the 1-minute or 5-minute charts tends to foster the following bad habits.
Potsu-potsu disease:
Never feel settled unless you are in a position; you'll enter even without a genuine opportunity.
Impatience:
Fast price movement makes you rush into entries, clouding judgment.
Overtrading:
Trading dozens of times per day, causing fatigue and more mistakes.
Overreaction to noise:
Overreacting to small price changes and closing positions prematurely, limiting profits.
Once these bad habits form, they’re hard to break.
Good habits formed on the 15-minute chart
Trading on the 15-minute chart cultivates the following good habits.
Patience:
You learn to wait for opportunities.
Calm decision-making:
Moderate speed allows you to decide calmly without rushing.
Planned trading:
A habit of analyzing thoroughly and planning before entering.
Ability to grow profits:
You don’t need to close too quickly like a short-term chart; you can train to extend profits.
If you cultivate good habits on the 15-minute chart, you can apply them to any timeframe.
However, if bad habits form on the 1-minute chart, they will affect other timeframes as well.
That’s why we recommend starting with the 15-minute chart from the beginning.
Summary
Do you now understand why Sansonhōdō FX adopts the 15-minute chart?
If you are unsure which timeframe you should trade on, we strongly recommend starting with the 15-minute chart.
Gentle for beginners and sufficiently profitable for experienced traders.
That is the 15-minute chart.
We know many of you have other logics besides Sansonhōdō FX; especially for scalping-type strategies that aren’t performing well, try trading on the 15-minute chart.
◆ “Sansonhōdō FX” is perfect for people like this.
・People whose trading time is limited due to night shifts or irregular work
・People parenting and cannot stay glued to charts
・People working FX as a side job as office workers
・People who are not good at complex analyses and want to trade simply
・People who find it troublesome to look at dozens of indicators・People lacking confidence in chart pattern judgments
・People who want to target large pips efficiently in little time・People who prefer swing trading to scalping
・People who get tired from watching price movements up and down・People who struggle with deciding stop-loss levels and hold a position too long
・People who tend to become a knowledge collector (overly focused on collecting notes)・People who buy signal tools but still can’t win


◆ Participation in Sansonhōdō FX is here ↓ ↓ ↓
https://www.gogojungle.co.jp/tools/indicators/65204?via=users_products