

Utilization of the "Visualization Indicator" (Part 243)
“Visible Indicator” usage(that243)
1. Evolution of “USD Currency Pair List Indicator” into a more advanced indicator,
“8CP Visible Indicator” for CADJPY chart
“8CP Visible Indicator” includes Oceania version, London version, NewYork version AnyCP, version., we used the NewYork version.
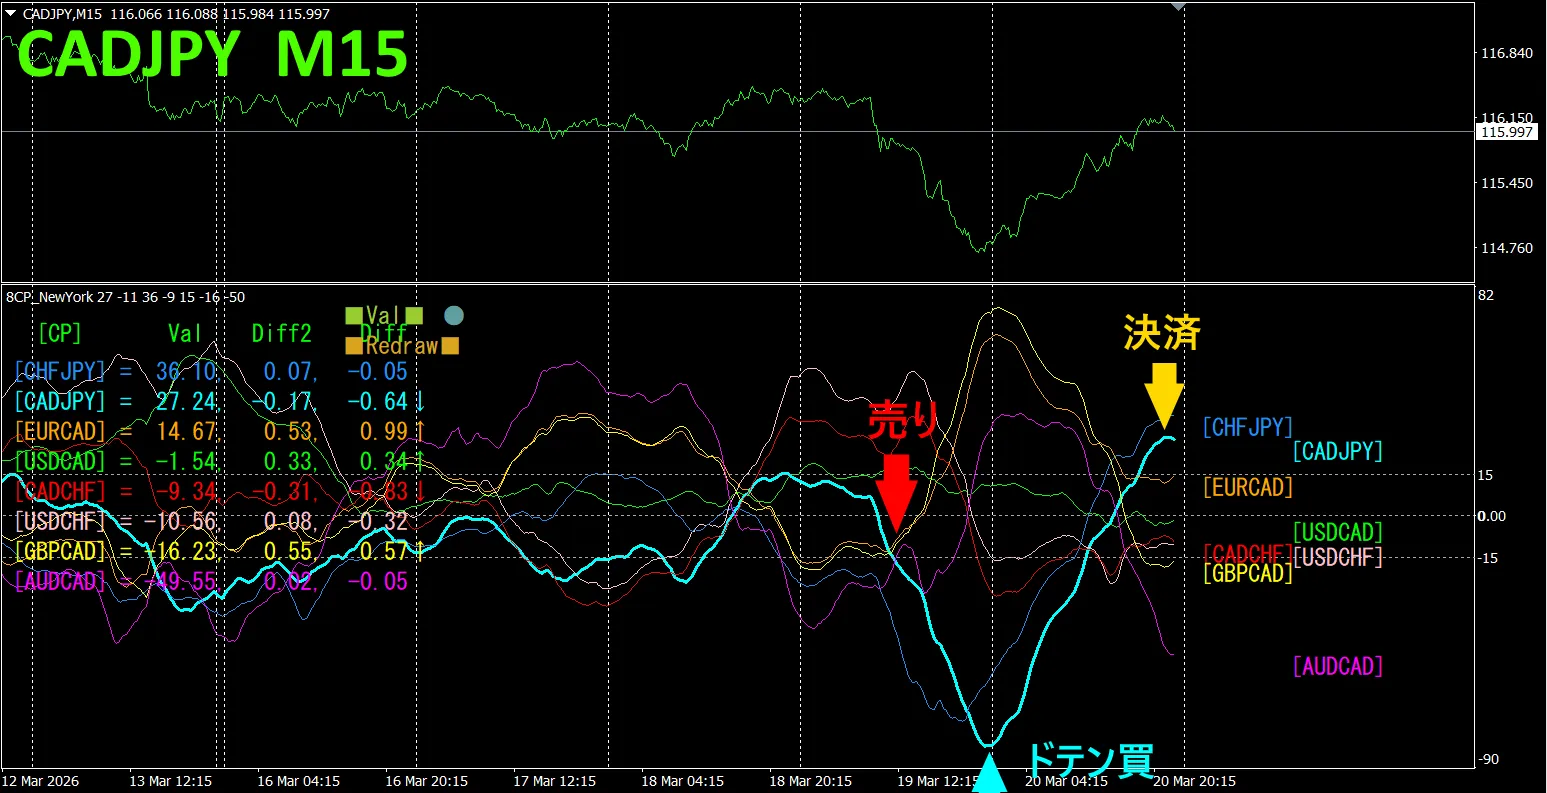
The upper half is the 15-minute CADJPY chart. The lower half shows the “8CP Visible Indicator” results, with light blue graphs representing CADJPYThis paragraph is misformatted in source.
On Thursday, CADJPY’s graph fell below other graphs, so we sold. We bought at the bottom and closed by the end of the week. The profit from the long side was about 120 pips, and from the short side about 140 pips, totaling about 260 pips. The correct approach is to take profits where available and not trade otherwise
Currency Strength-Differential Graph
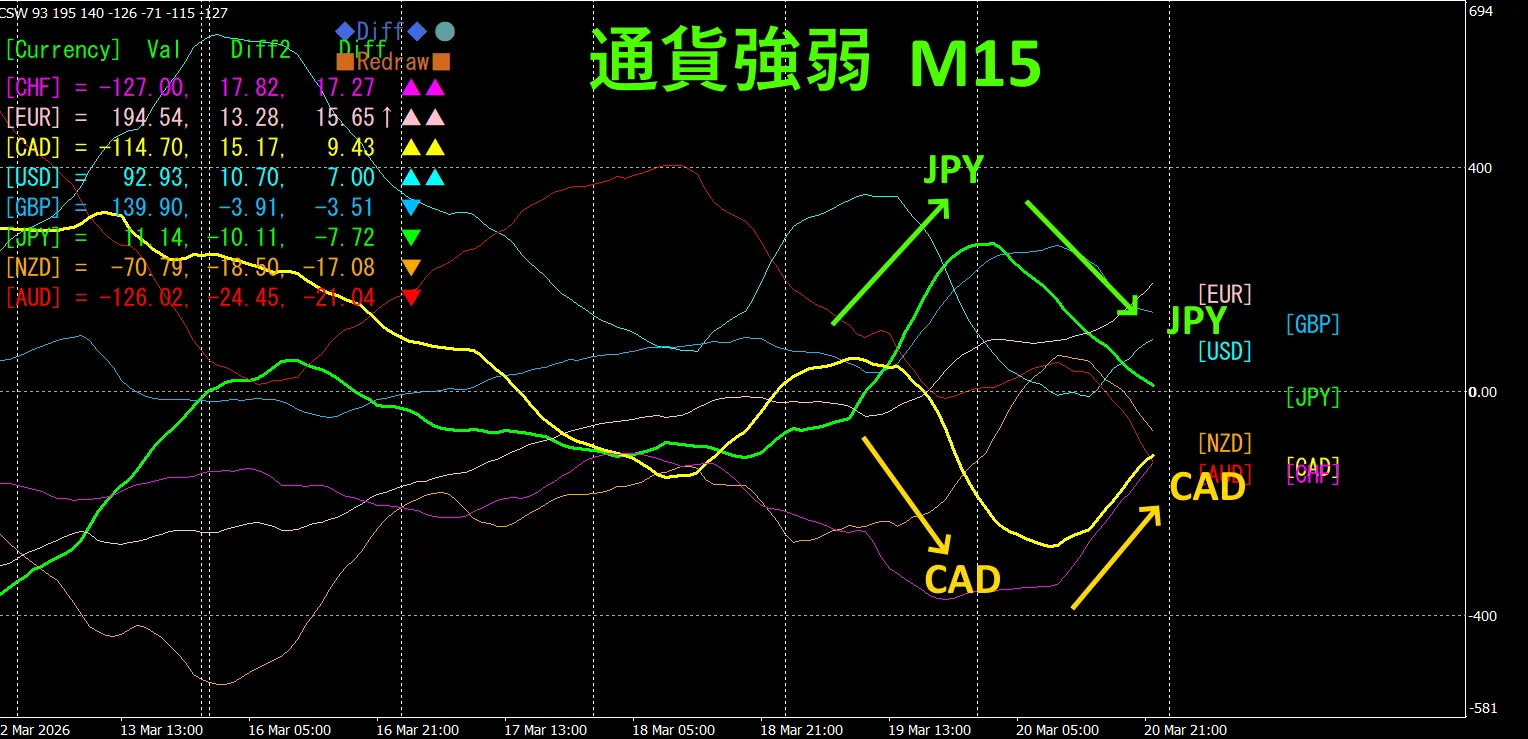
Looking at the 15-minute currency strength graph, CAD JPY Trade when CAD is expanding and converges when it is contracting. Enter on expansion (sell) and on convergence (buy). It’s a clean inverse-correlated chart and easy to trade. This makes for a good trading pattern.
In FX, pick the currency pair with the largest move and inverse correlation to trade, and results will follow.
“Target currency strength inverse correlation”! is FX’s tenet.
Using “TrendLine-EX” you can automate entry and exit on diagonal trendline breaks. It can be left as is for easy trades. “TrendLine-EX” supports auto-sell on break below trendline and auto-close on break above trendline, a semi-automatic EA.
2. Best SelectTry the indicator
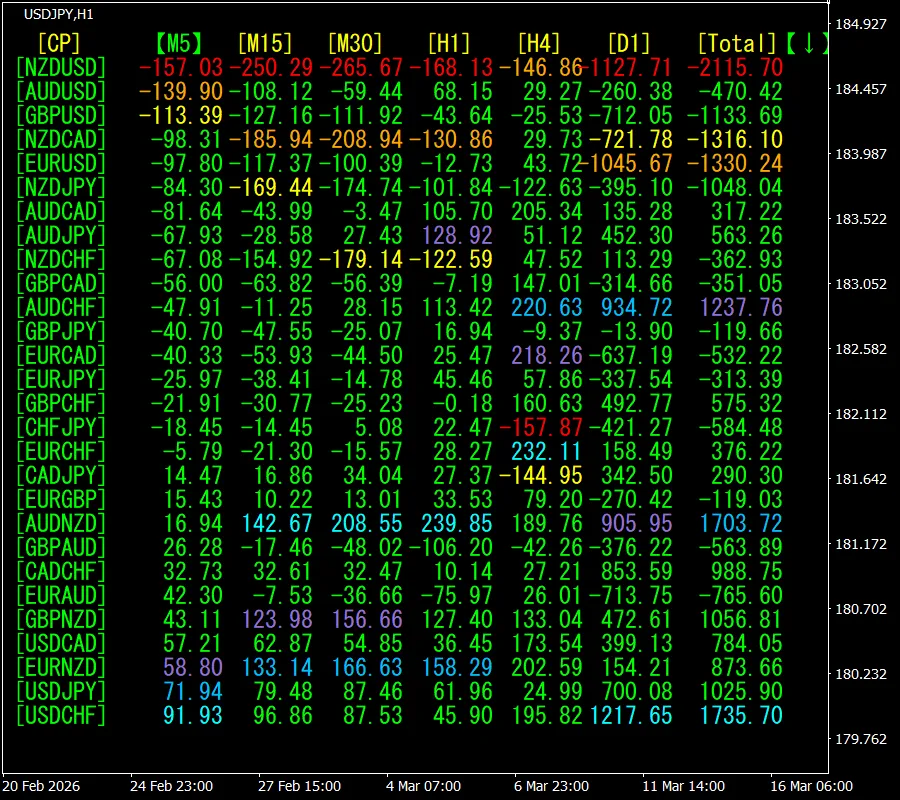
Below is a screenshot dated March 17, 2026 15:01 (JST) .
[M5] Show numbers in ascending order. At the top is NZDUSD, which is red across all timeframes. The Total value is -2115.70, negative. This suggests a downward trend in NZDUSD.
Now, let’s look at the NZDUSD chart.
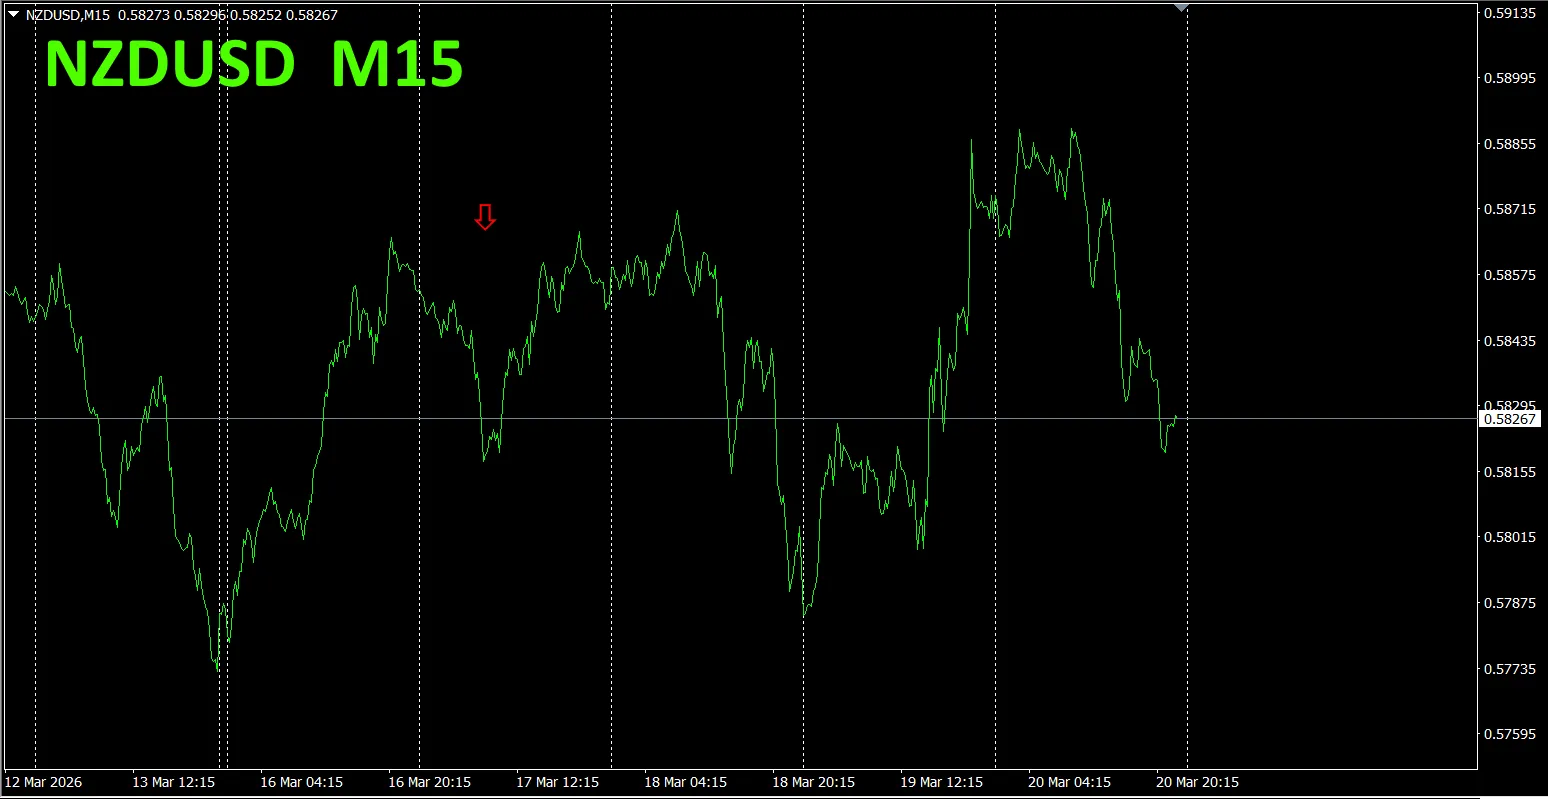
The red arrows mark the screenshot location. It captures the downtrend section.
“28 Currency Pairs Best Select Indicator” helps you easily identify which of 28 currencies are most strongly trending. It also tells you, by colors and values, whether you should trade now. A great indicator for assessing all currency pairs at a glance.
“28 Currency Pairs Best Select Indicator”
https://www.gogojungle.co.jp/tools/indicators/35128
3. Since May 2021, what happened to EURJPY?
We have been tracking EURJPY since May 2021.
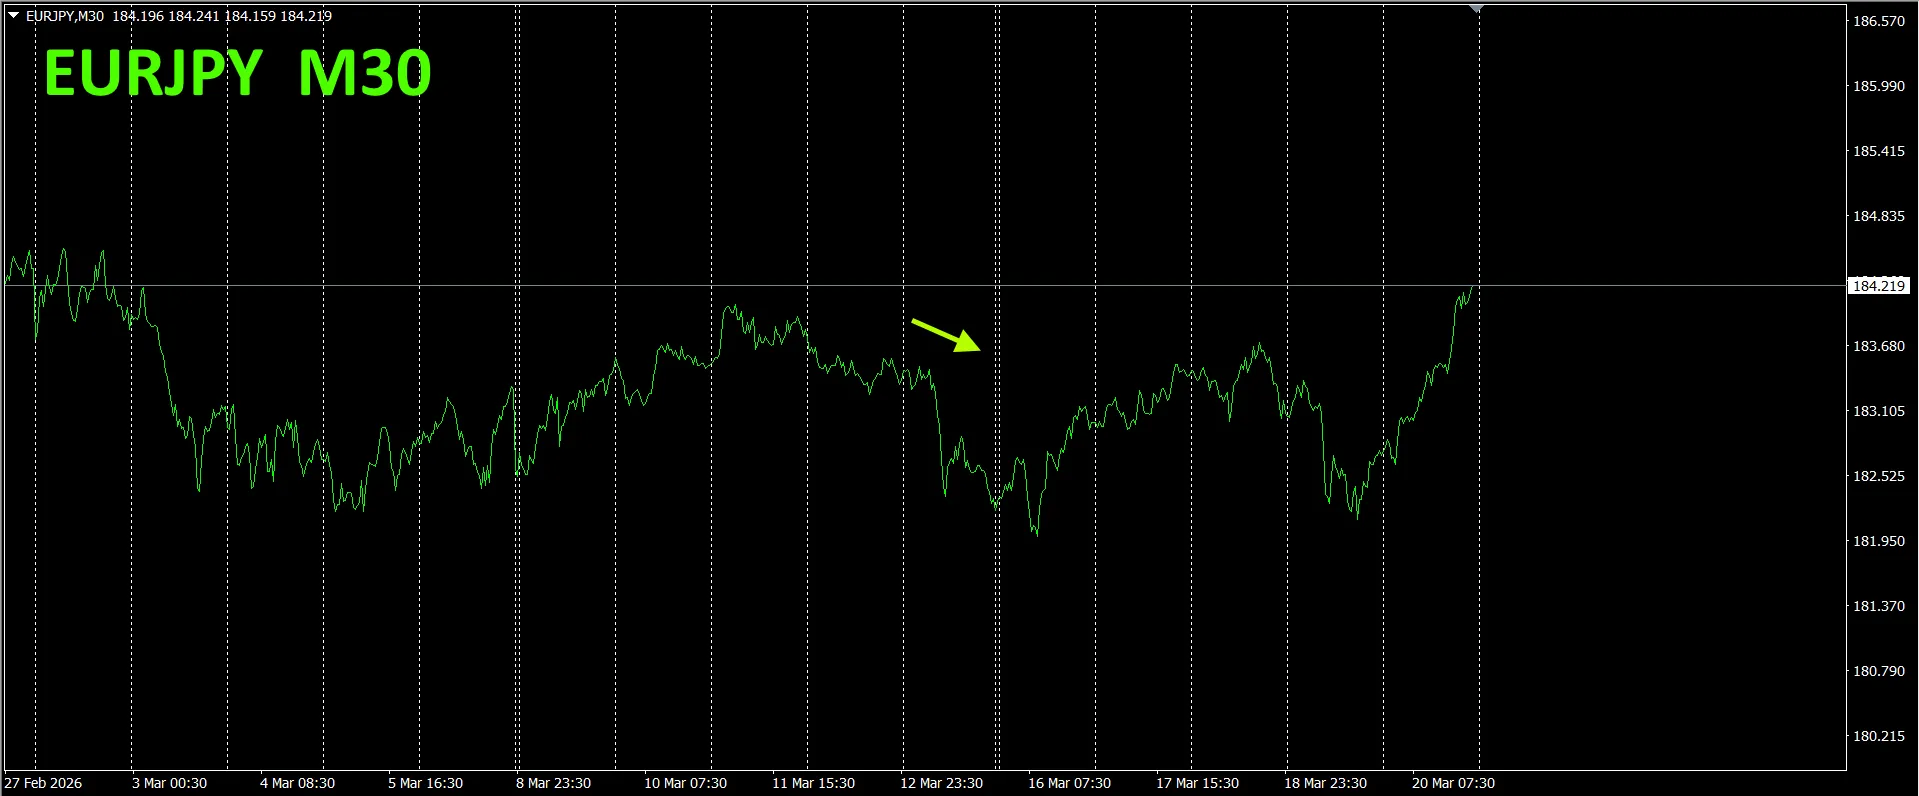
To view the overall trend, we plot roughly three weeks of data on a 30-minute chart.
Previously I wrote as follows.
EUR is slightly down, JPY is up, so EURJPY is expected to move downwards.
It dipped on Monday but then rose.
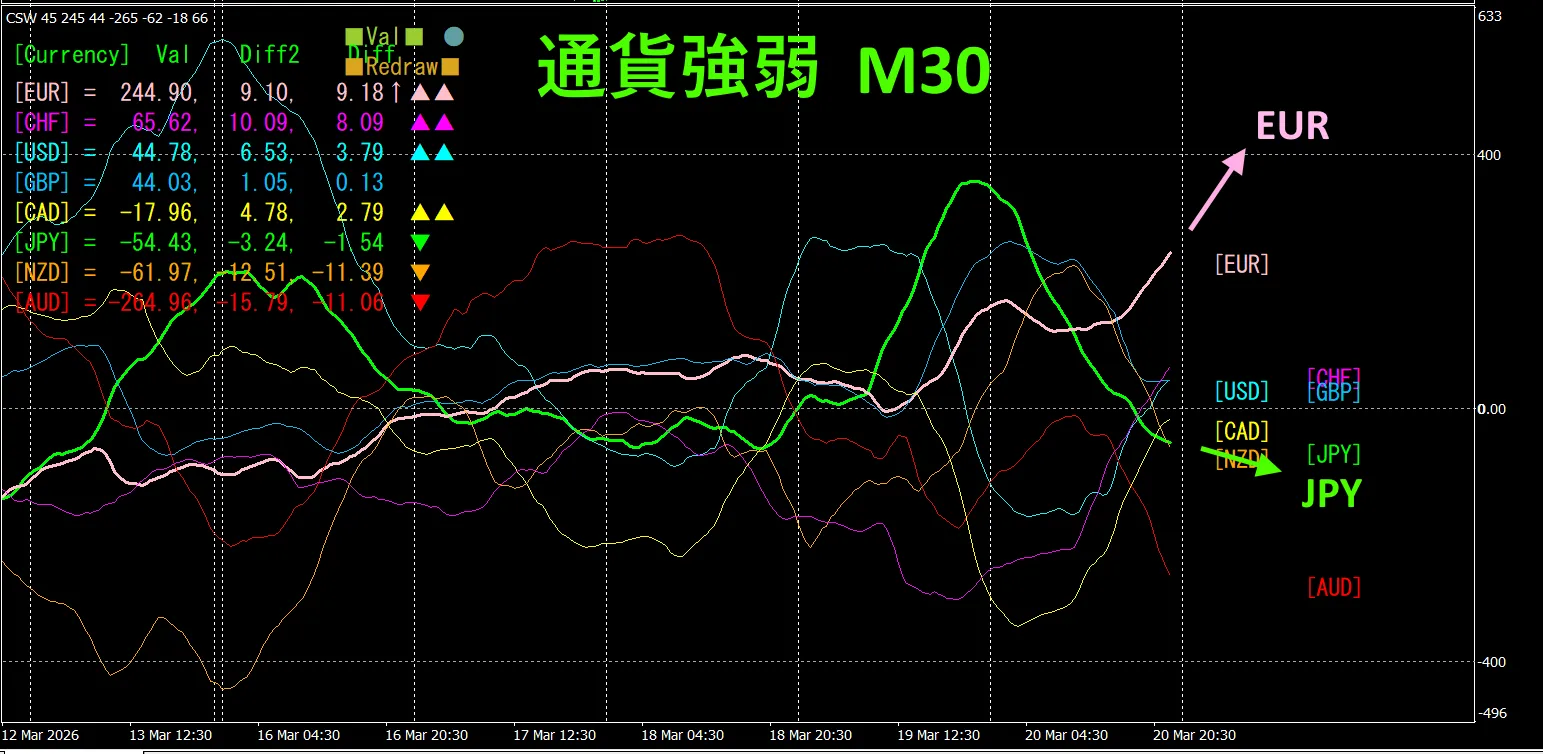
30-minute currency strength chart
Purple is EUR, green is JPY. EUR clearly down, JPY down, so EURJPY is expected to rise in the future.
4. New indicator Dual_MACD_Trend_Indicator
For the new indicator, see below.
MT4 version:https://www.gogojungle.co.jp/tools/indicators/62199
MT5 version:https://www.gogojungle.co.jp/tools/indicators/62202
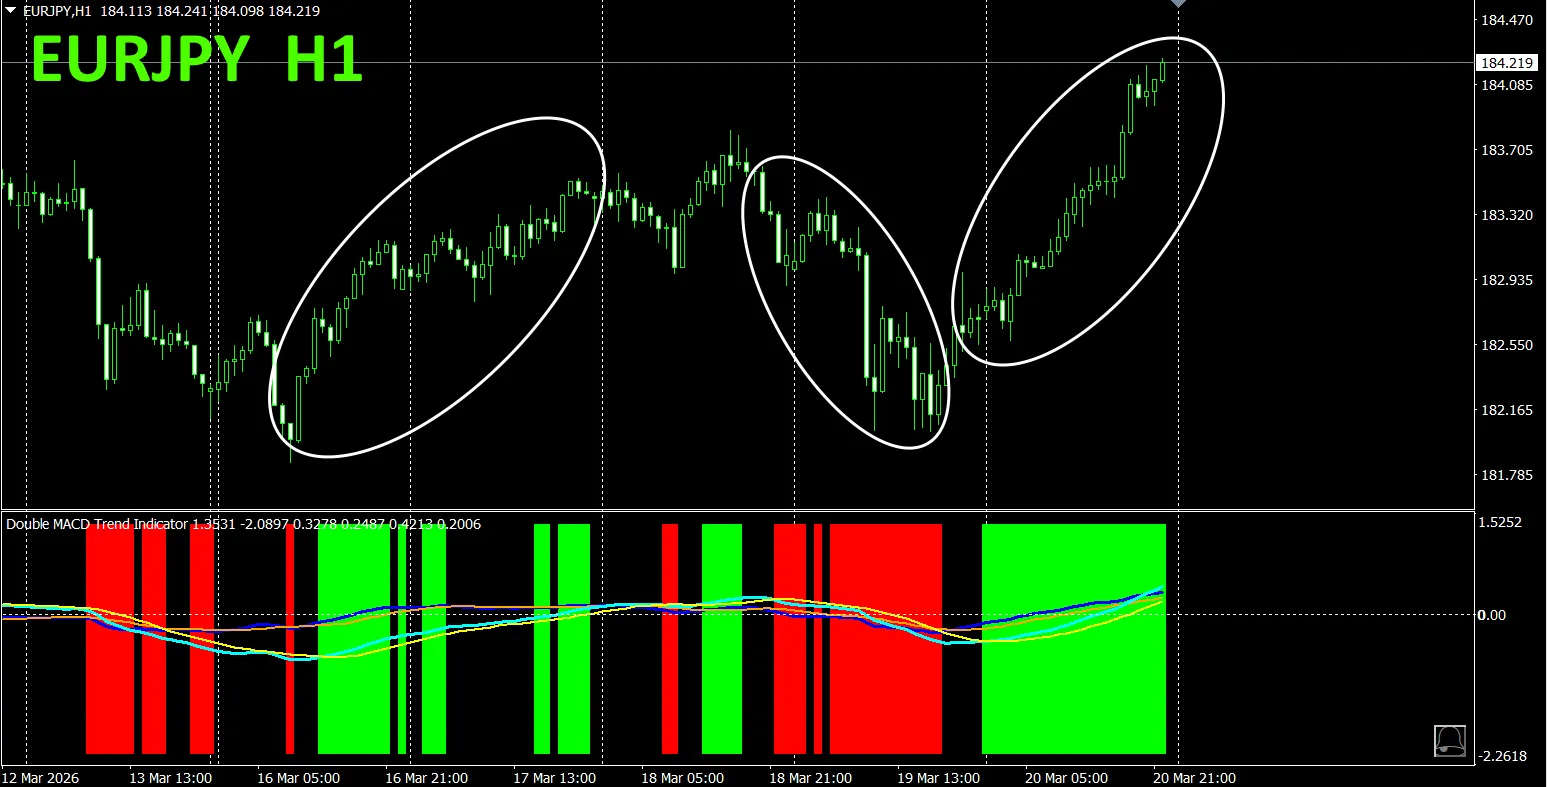
This indicator clearly shows trend direction with color. If bar color is Lime, it’s a buy; if Red, it’s a sell; no color means no trend. The color display allows at-a-glance trend understanding.
We installed this indicator on EURJPY on 1-hour chart.
In the top diagram, the red sell zone and green buy zone are clearly separated, making trading easy at a glance. Focus on the white oval region and trade only when indicator color is green (buy) or red (sell).With “Dual_MACD_Trend_Indicator”, trade only when green zones appear (buy) and red zones (sell); otherwise do not trade.
Using Dual_MACD_Trend_Indicator removes any remaining trading direction doubts.
5. “Trend_Color_MA_MTF” has been released
From the product page
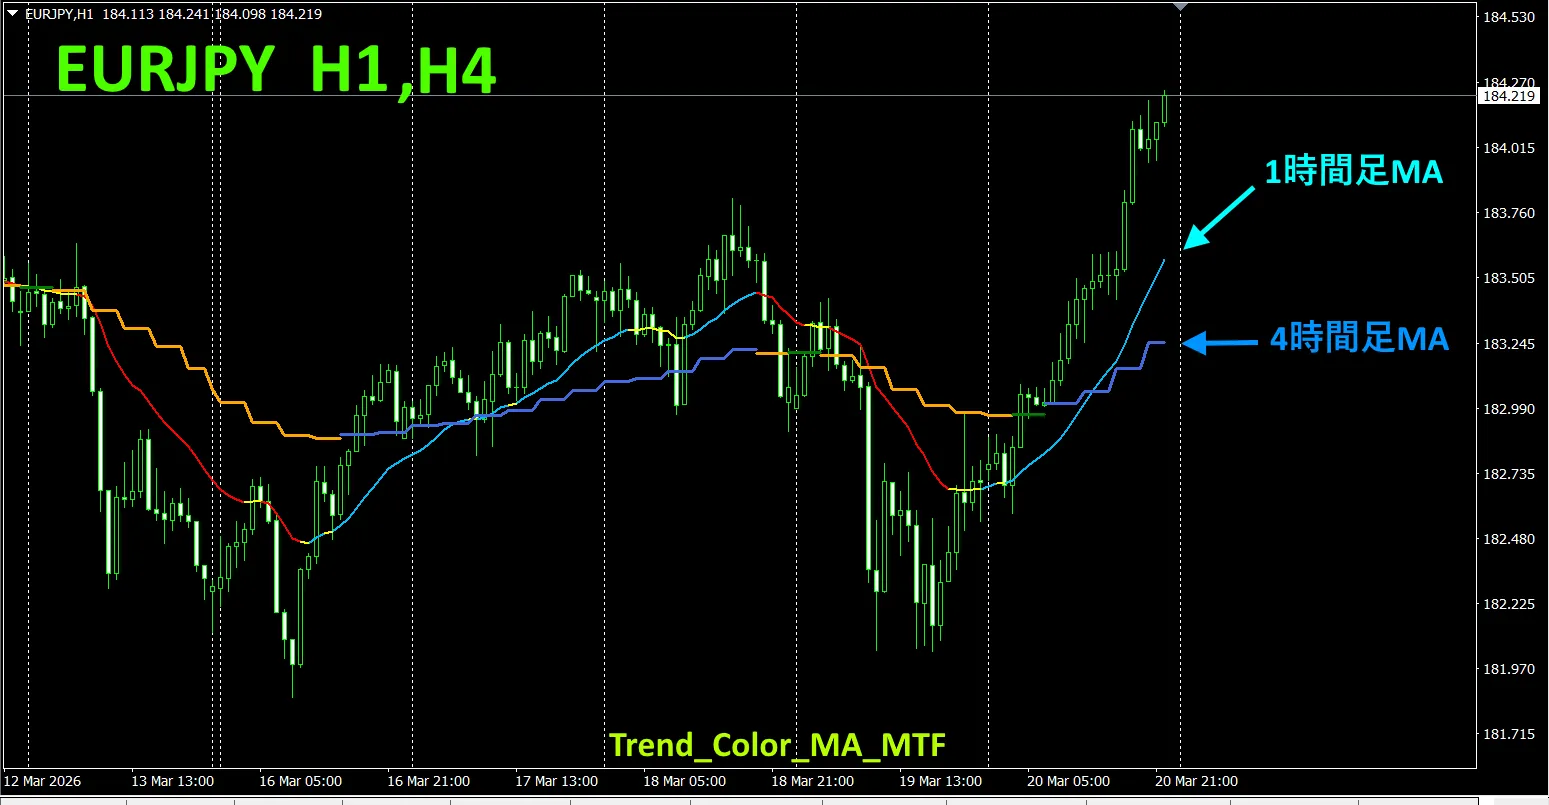
“Trend_Color_MA_Dual_MTF” is designed to transform your trading. This tool is not simply a moving average. It visualizes trend direction with color and notifies you the moment a signal arrives via sound and notification, acting as your personal assistant..
As an example, on the EURJPY 1-hour chart we also display a 4-hour moving average concurrently. The 4-hour moving average is stepped in a staircase, and colors indicate up or down trends to readily compare current and higher-timeframe trends.
If the higher timeframe and current timeframe colors match, trade with red for sell and blue for buy.
For details, please see the following link.
https://www.gogojungle.co.jp/tools/indicators/75985
※
“8CFD Visible Indicator Any version”
https://www.gogojungle.co.jp/tools/indicators/32288
“Toretore Indicator
https://www.gogojungle.co.jp/tools/indicators/50115
“TrendLine-EX”
https://www.gogojungle.co.jp/tools/indicators/42257
“8” is available on the following pages.
MT4 version https://www.gogojungle.co.jp/tools/indicators/39150
MT5 version https://www.gogojungle.co.jp/tools/indicators/39159
【My listed products】


