

Everyday Nikkei 225: 2026/3/19
Analysis Tools Details Link
Note: We have earned steady high marks.
■ Newly Developed Profit+Indicator DAVID (David)
https://www.gogojungle.co.jp/tools/indicators/73936?via=users_products
■ Excellent Trendline Drawing Indicator “Unparalleled Sword”
https://www.gogojungle.co.jp/tools/indicators/54499?via=users_products
■ Indicator Pack MT4/5 Version - Monthly
“Tenka Musou” Synchro System
https://www.gogojungle.co.jp/tools/indicators/50319
“David” Synchro System
https://www.gogojungle.co.jp/tools/indicators/73939?via=users_products
Trade View Edition – Ultimate Synchro System Monthly
https://www.gogojungle.co.jp/tools/ebooks/50353
Below: Current Analysis Article
One-word Comment: Range
Daily Chart:MAX Oscillator: Synchro Band“Weak Decline”
4-Hour Chart Weak“Strong Decline” Signal Indication
※ On the weekly chart,“Weak Decline” Suggestion
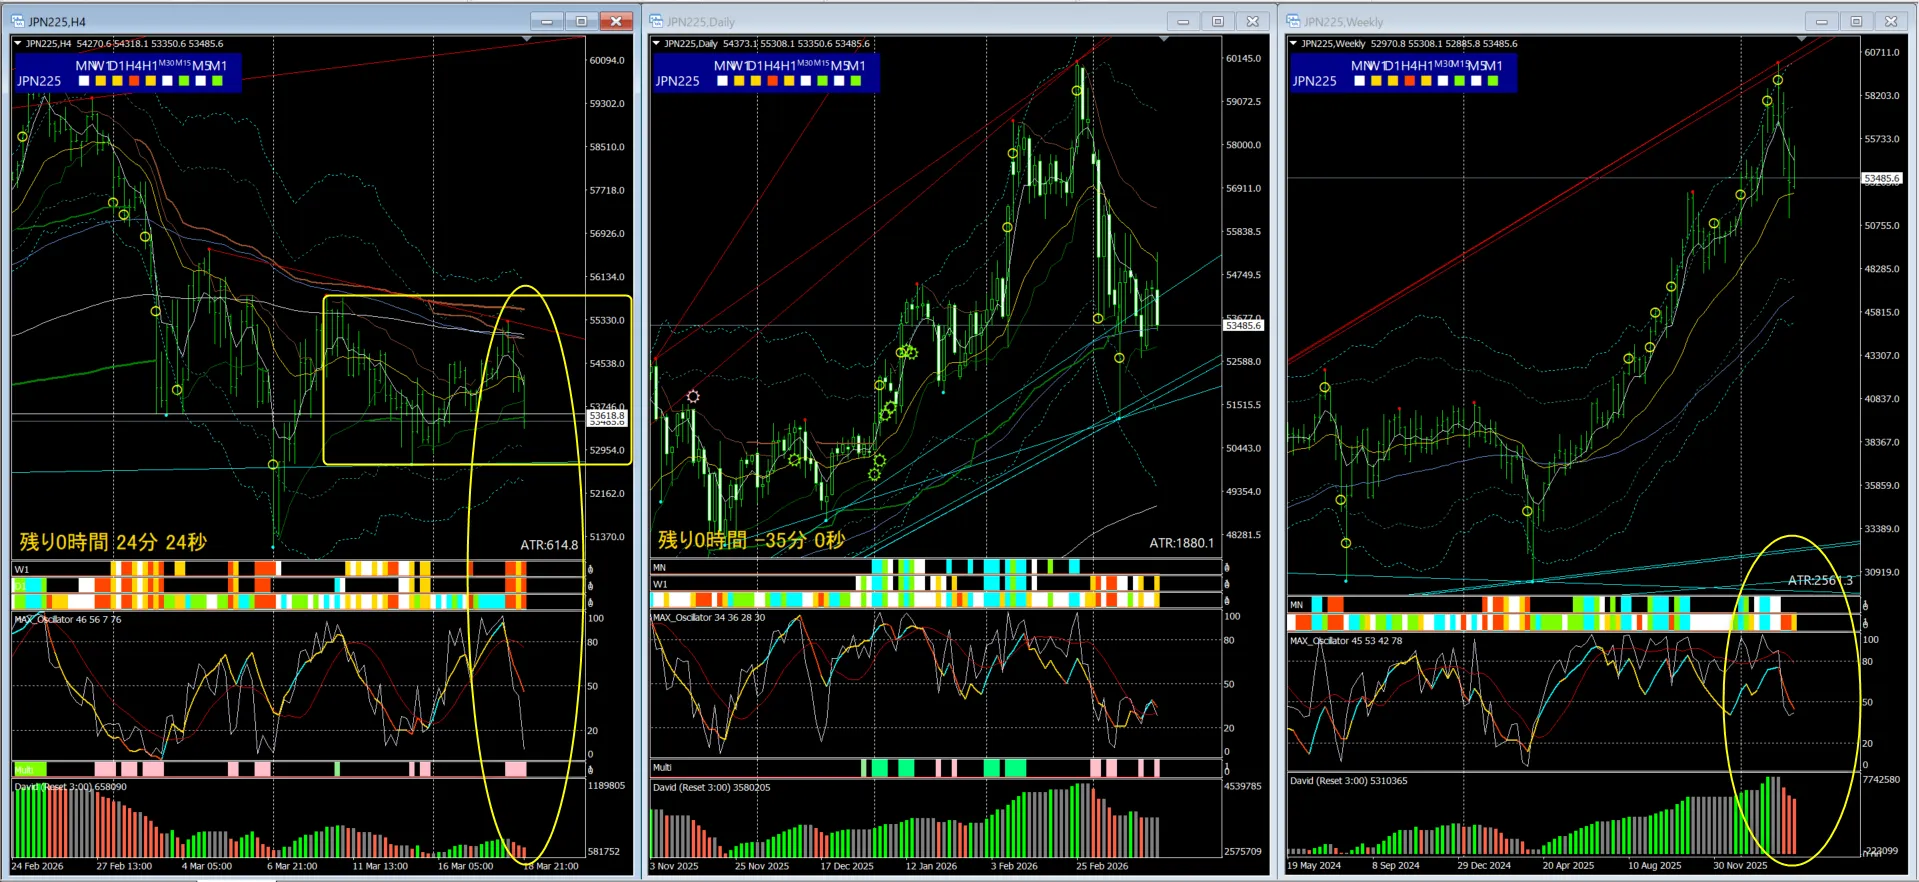
※ Still within range, but near-term downside
Daily MK Channel deviation 3x to near the line, then a sharp decline,
followed by a rebound. The momentum was fairly strong,
but currently there is a pullback from the Daily EMA20
The current view is that it is in a 4-hour range, but the signals are leaning bearish
Will it resume the trend or stay within the range?
The outcome depends on what happens next, but
the signals indicate weakness
Price movement can become extremely volatile depending on the time of day
If you think it’s dangerous, it’s better to exit quickly and also manage risk
Careful risk management remains essential.
Do not ignore near-term movements; stay flexible to short-term waves
Be careful of sudden, abrupt changes!
Important Notes
Volatility is quite high, so please pay close attention to money management.
Cautions
Original indicator-based Current analysis comment and,
do not constitute buy/sell recommendations or guarantees of future movements.