
When I displayed EMA as a "cloud," trend determination became surprisingly easy — MT4 indicator
MT4 Custom Indicator Review
When I displayed EMA as a "cloud," the trend determination became astonishingly easy【MT4 Indicator】
Two moving averages, are you using them properly?
When you first start FX, the moving average (MA) is probably the indicator you learn first.
You draw a fast line and a slow line on the chart and know the basic rules: "buy when they cross, sell when they cross."
But honestly, when you only look at the two lines, don't you sometimes fail to instantly tell which trend is currently direction? The lines are too close, no clear direction. You end up staring at the chart and judging in your head—I've had that experience many times.
Common mistakes with EMA cross
Using moving averages with golden cross and dead cross is well known. But in actual trading, you feel acutely that "by the time you notice the cross, it’s already late."
A cross is a sign of what has already happened. By the time you notice it, the market may have moved sharply, and entering could go against you...
Also, cross signals in ranging markets are often deceptive, and using them without a filter does not yield stable win rate. I think one reason many feel "EMA can't be used" comes from this.
If you look at it in a "cloud," you understand the market in an instant
So I arrived at the idea ofvisualizing the EMA difference as a cloud (band).
Many are familiar with the Ichimoku "cloud." Just by looking at its color and position, you can instantly grasp the market direction—that intuitive clarity is now applied to EMA in the form of the Ultimate Clouds we’re introducing Ultimate Clouds .
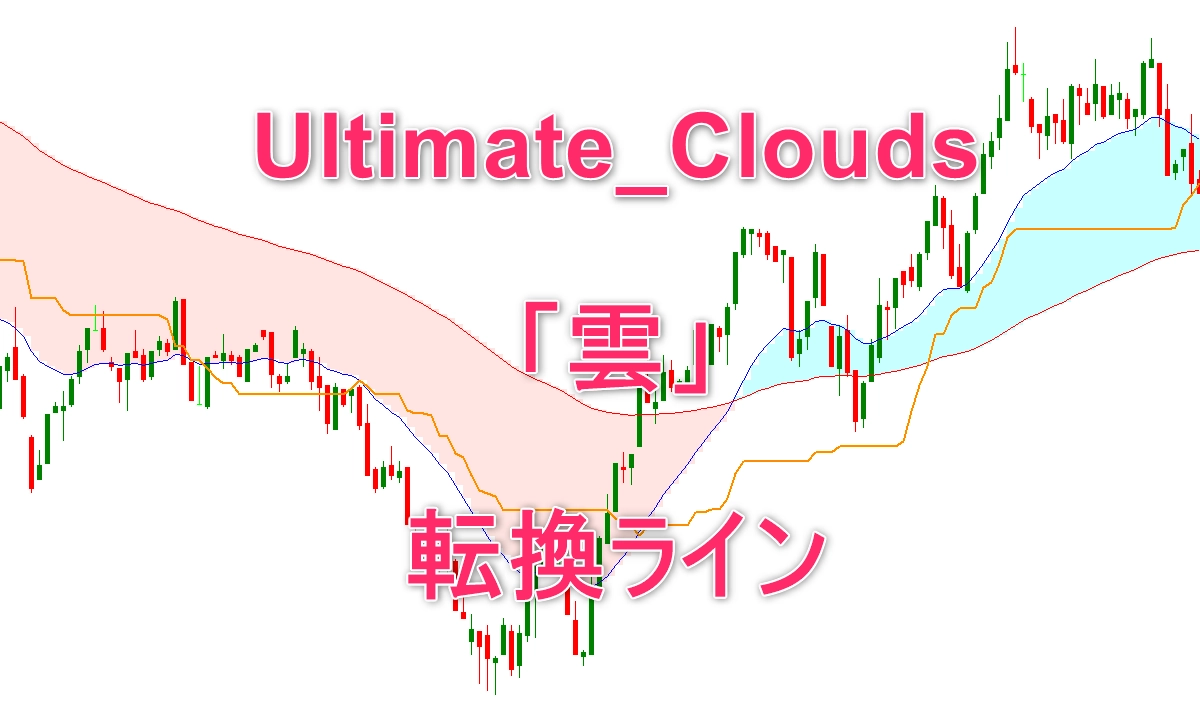
The mechanism is simple. It fills the area between the fast EMA and the slow EMA with a colored band (cloud).
・ If the cloud islight bluethen an uptrend (fast EMA > slow EMA)
・ If the cloud isredthen a downtrend (fast EMA < slow EMA)
By just glancing at the chart, you can determine which trend you are in in0.5 seconds. This difference is larger than you might expect.
Even more helpful is the information called the "cloud thickness." Because the distance between the two lines is represented as a visual band, you can simultaneously gauge whether the trend is strong or weak. If the cloud is thick, the trend is strong; if it thins, the trend is weakening—something that is easy with two lines but harder to judge at a glance.
The turning line tells you when to enter
In Ultimate Clouds, in addition to the cloud, there is also a feature called Turning Line.
This line is calculated with the same logic as the Ichimoku "Turning Line" and is the midpoint between the highest and lowest prices over a specified period. The usage is very simple.
・ When the cloud islight blue (uptrend)and price breaks above the Turning Line, it is a cue to buy
・ When the cloud isred (downtrend)and price breaks below the Turning Line, it is a cue to sell
Confirm the trend with the cloud and use the Turning Line for the exact entry timing—this combination is contained within a single indicator. Reducing the number of indicators on the screen lowers decision stress and significantly improves trading experience.
Dark theme automatic support, works with any chart
Even though it may seem like a minor detail, long-term trading is subtly affected byscreen readability.
If the chart with a dark theme has colors that don’t match well, the cloud colors may blend into the background. And changing themes every time to reconfigure colors is tedious.
Ultimate Clouds automatically determines the chart background color and selects colors optimized for both light and dark themes. It redraws automatically the moment you change the theme, so no setup is required. For traders who stare at charts all day, this greatly reduces eye fatigue.
From scalping to long-term, you can adapt by changing settings
All parameters can be freely adjusted: EMA periods, colors, thicknesses, Turning Line period, color, and display on/off. Here are some tested settings.
| Style | EMA Fast | EMA Slow | Turning Line | Recommended Timeframe |
|---|---|---|---|---|
| Day trading (standard) | 20 | 100 | 40 | H1〜H4 |
| Scalping | 9 | 21 | 20 | M5〜M15 |
| Swing | 20 | 200 | 60 | H4〜D1 |
| Long-term trading | 50 | 200 | 100 | W1〜MN |
Impressions after actually displaying on the chart
To be honest, at first I thought, "Is this just coloring the moving averages?" But once displayed on the chart, my impression completely changed.
With two lines, you must judge "up or down" in your head every time, but with the cloud, your eyes read it automatically. It’s especially noticeable when switching between multiple timeframes—the speed of judgment increases.
Also, when the cloud thins, I personally realized that the market might change soon. When looking at lines alone, I often realized changes after a cross; with the cloud thickness as a visual cue, you can sense the change earlier.
Conclusion: Simple is often winning
What consistently yields long-term results is "keeping judgments simple." More indicators mean more confusion and slower entries.
Ultimate Clouds covers trend direction, strength, and timing with just two pieces of information: cloud color and the Turning Line. If you want to simplify your decision-making by reducing indicators, this is an indicator you should try.
Since it is provided as a compiled .ex4 file, you can download and copy it into MT4’s designated folder and use it immediately. For details, please see the product page below.
↓ See details ↓
Ultimate Clouds Product Page