

2026/03/18 Gold Analysis
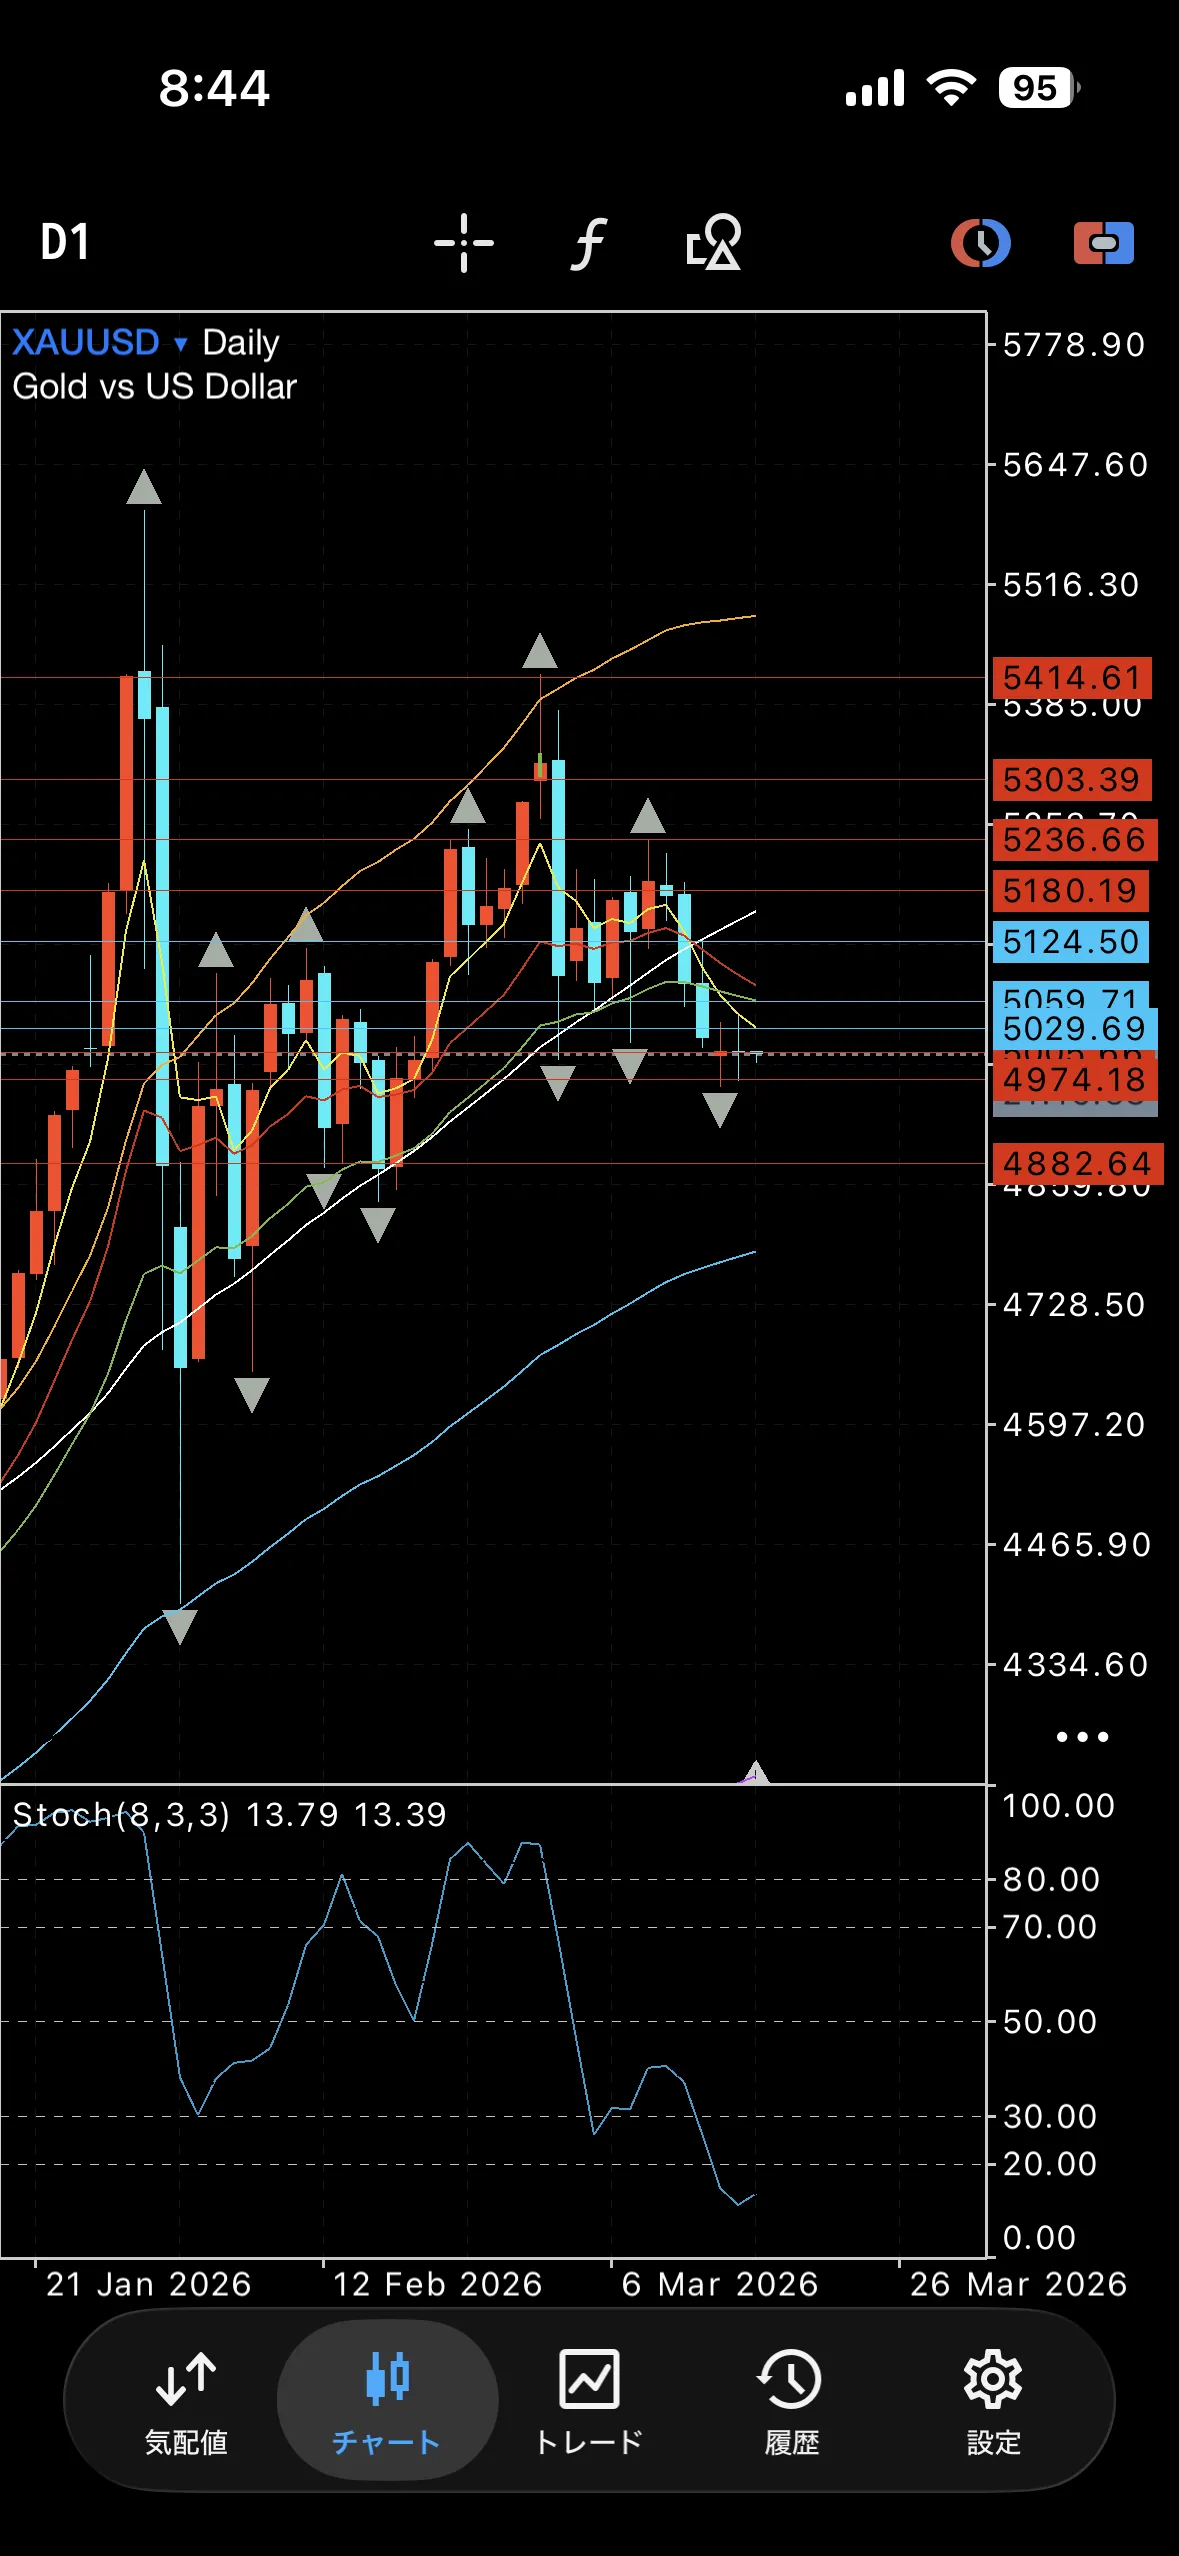
【Yesterday's daily chart】
Simultaneous line
Since this is the second simultaneous line, it will move significantly in the direction of the breakout
・Oscillator
Short-term hidden and near the lower bound of the Stochastic
However, the MA is DC
・Perspective
Until breaking around the 25 EMA, trend is downward
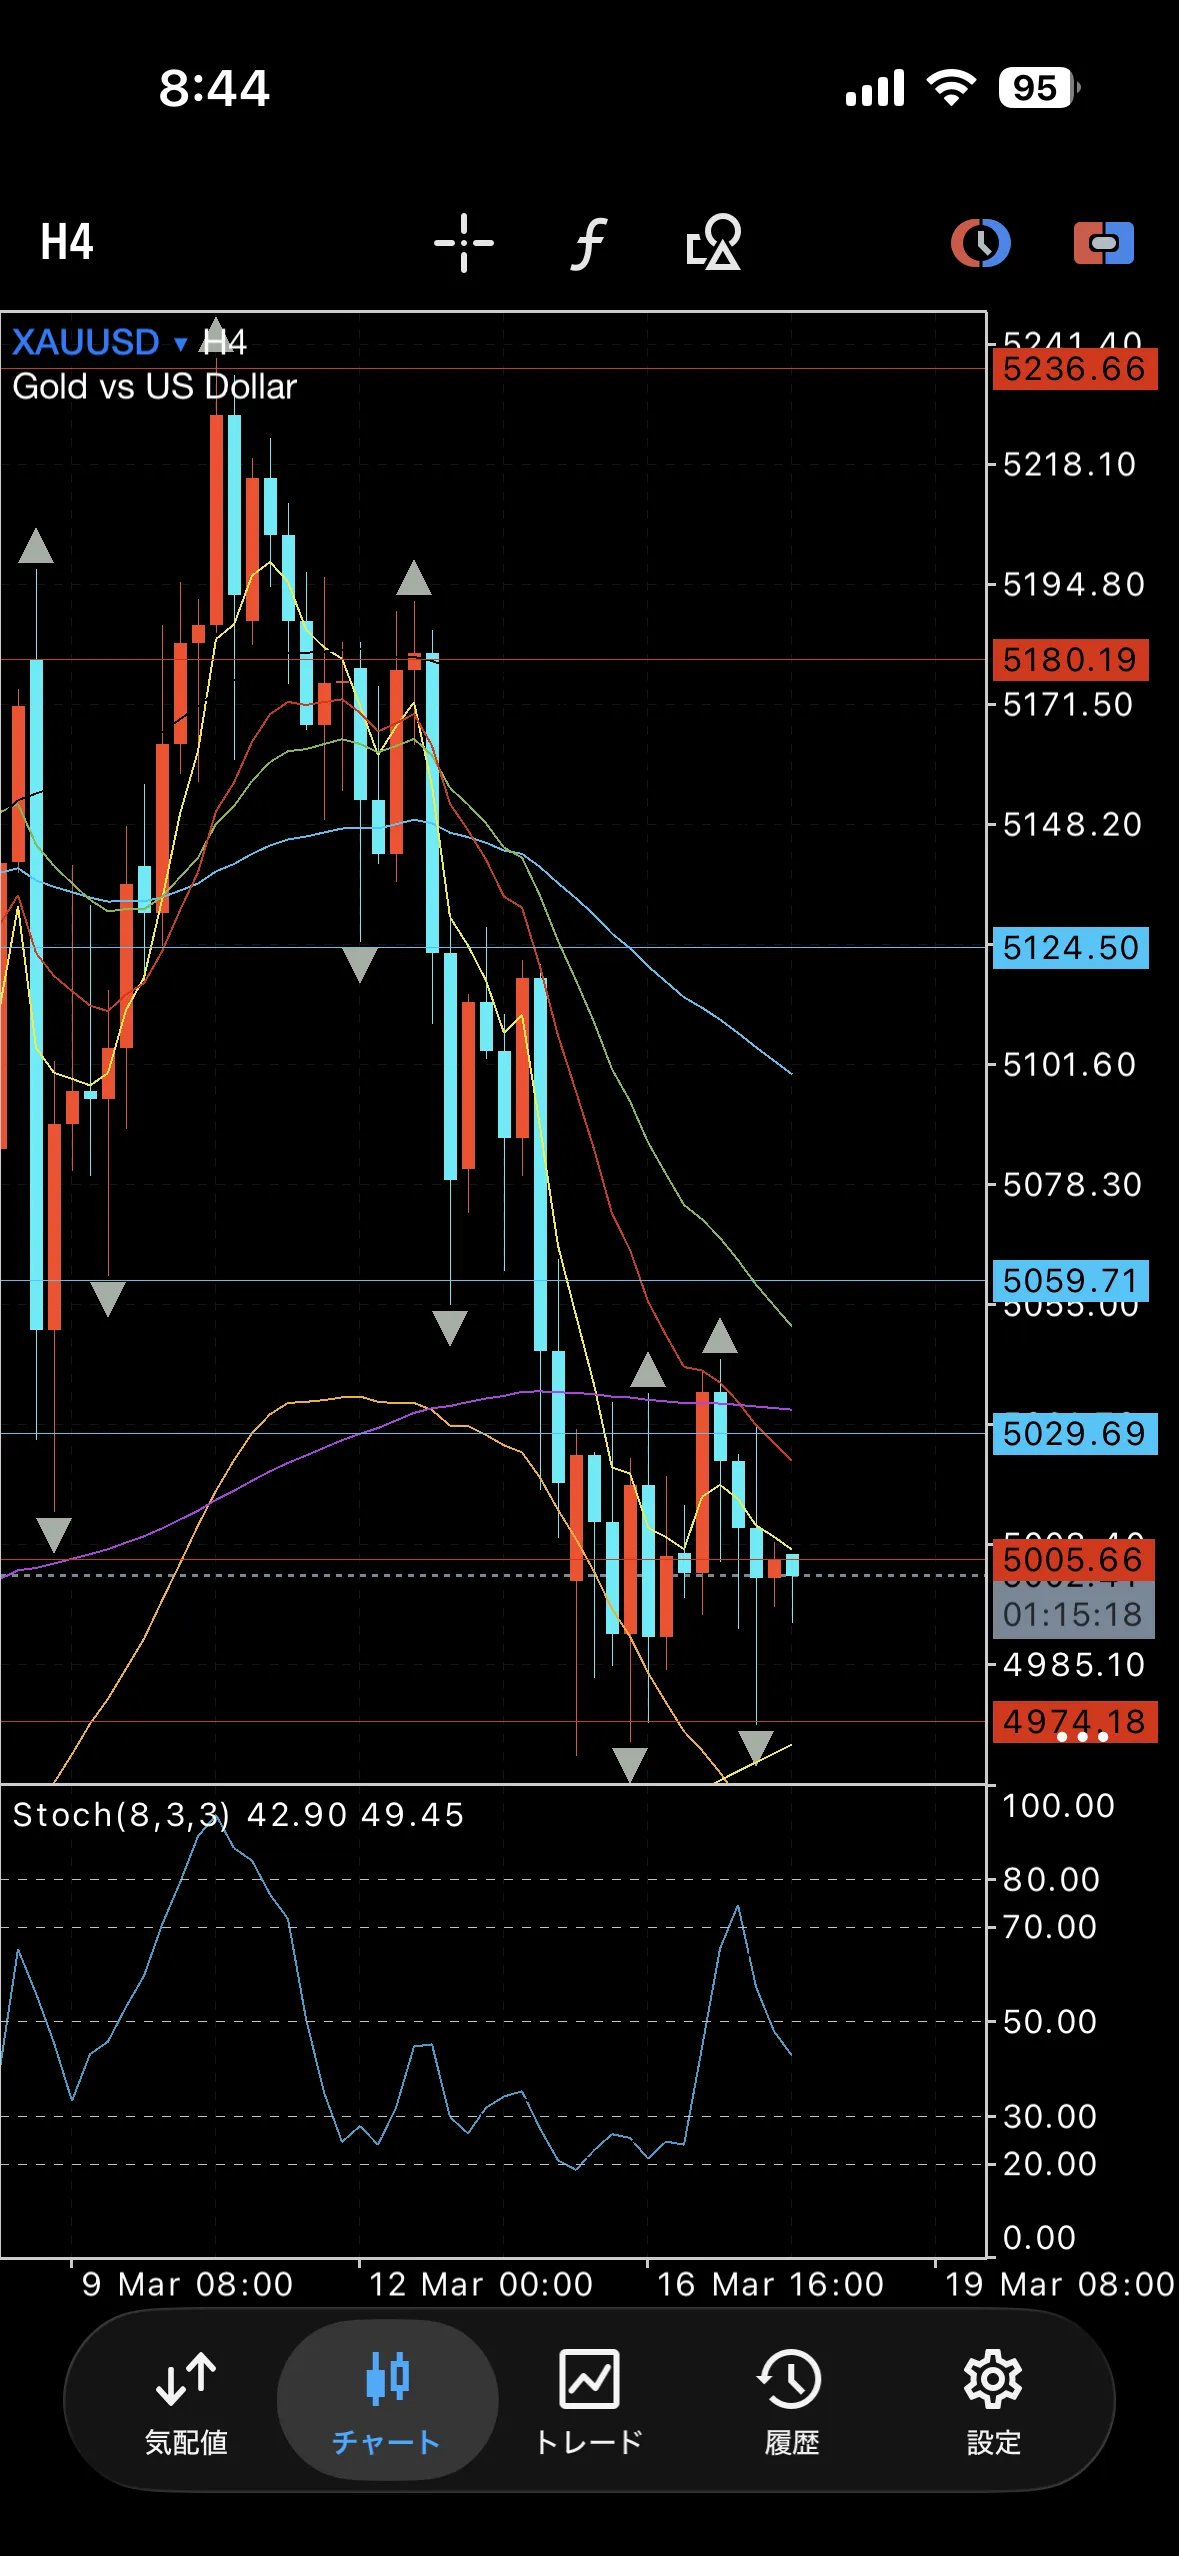
【4-hour chart】
Stalling near the weekly support line
Short-term MA PO downward
4-hour 200 EMA acts as resistance but cannot push lower
・Indicators being watched
4-hour 200 EMA
・Perspective
Downward
・Other regularly patterned indicators and short-term impressions
There is a regular pattern at 30-minute 75 and 15-minute 200
Because even the 1-hour short-term chart is forming a range, a long rule to align with the short-term MA or a short from the lower bound is recommended
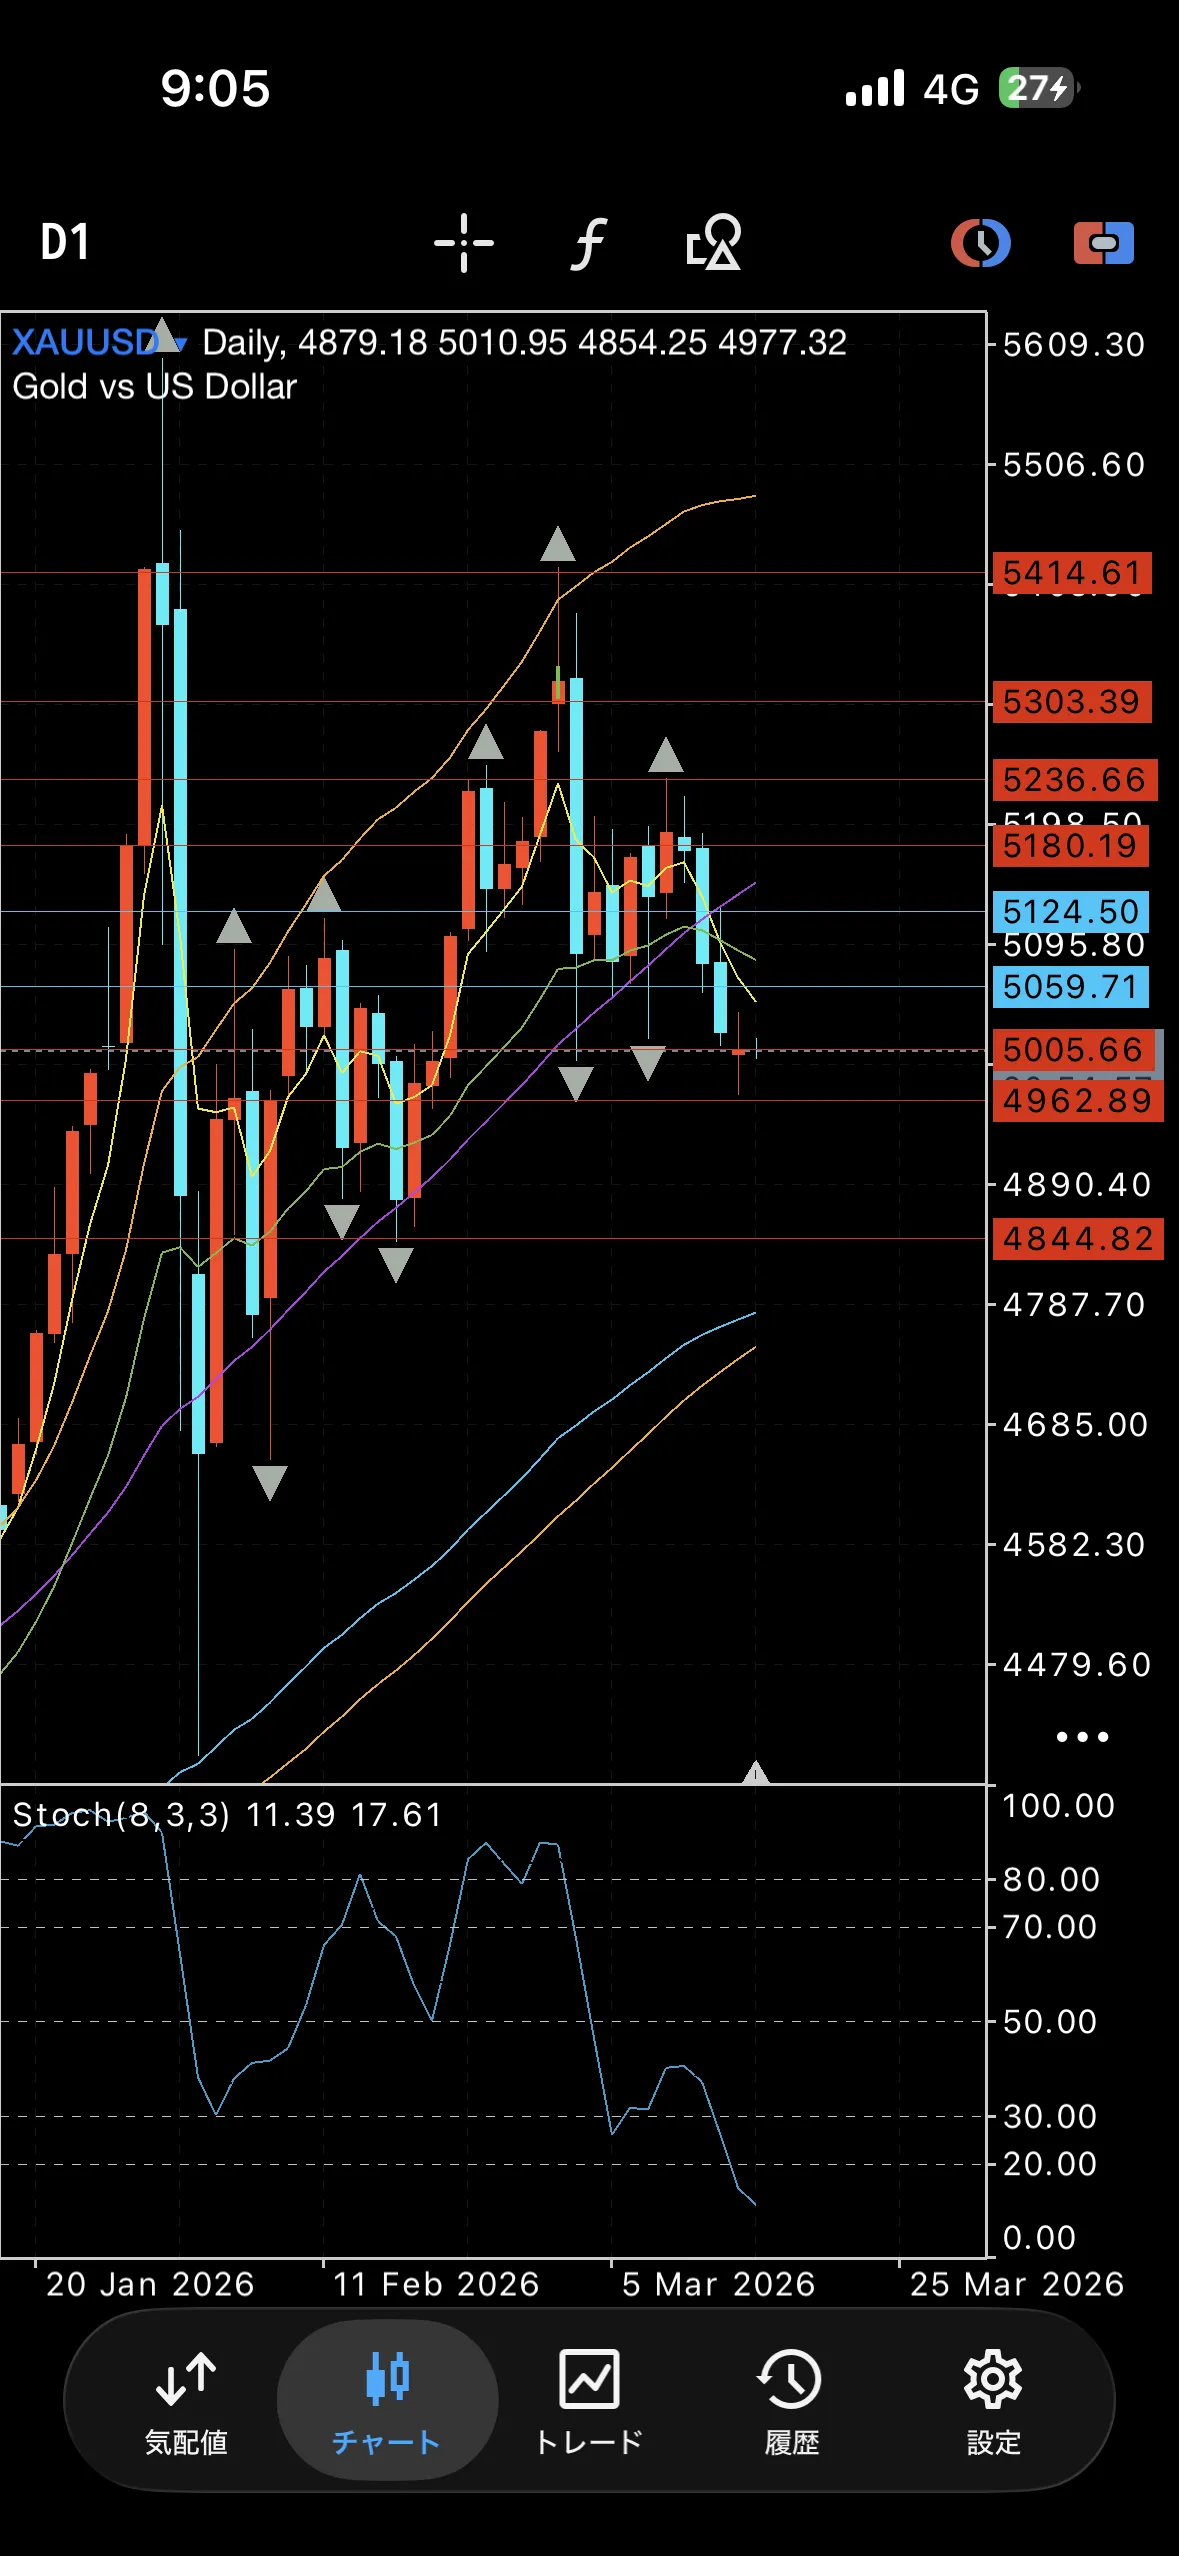
【Key horizontal levels to watch (all within close zones)】
5059
5029
4971
4882