

Gold Analysis on 2026/03/17
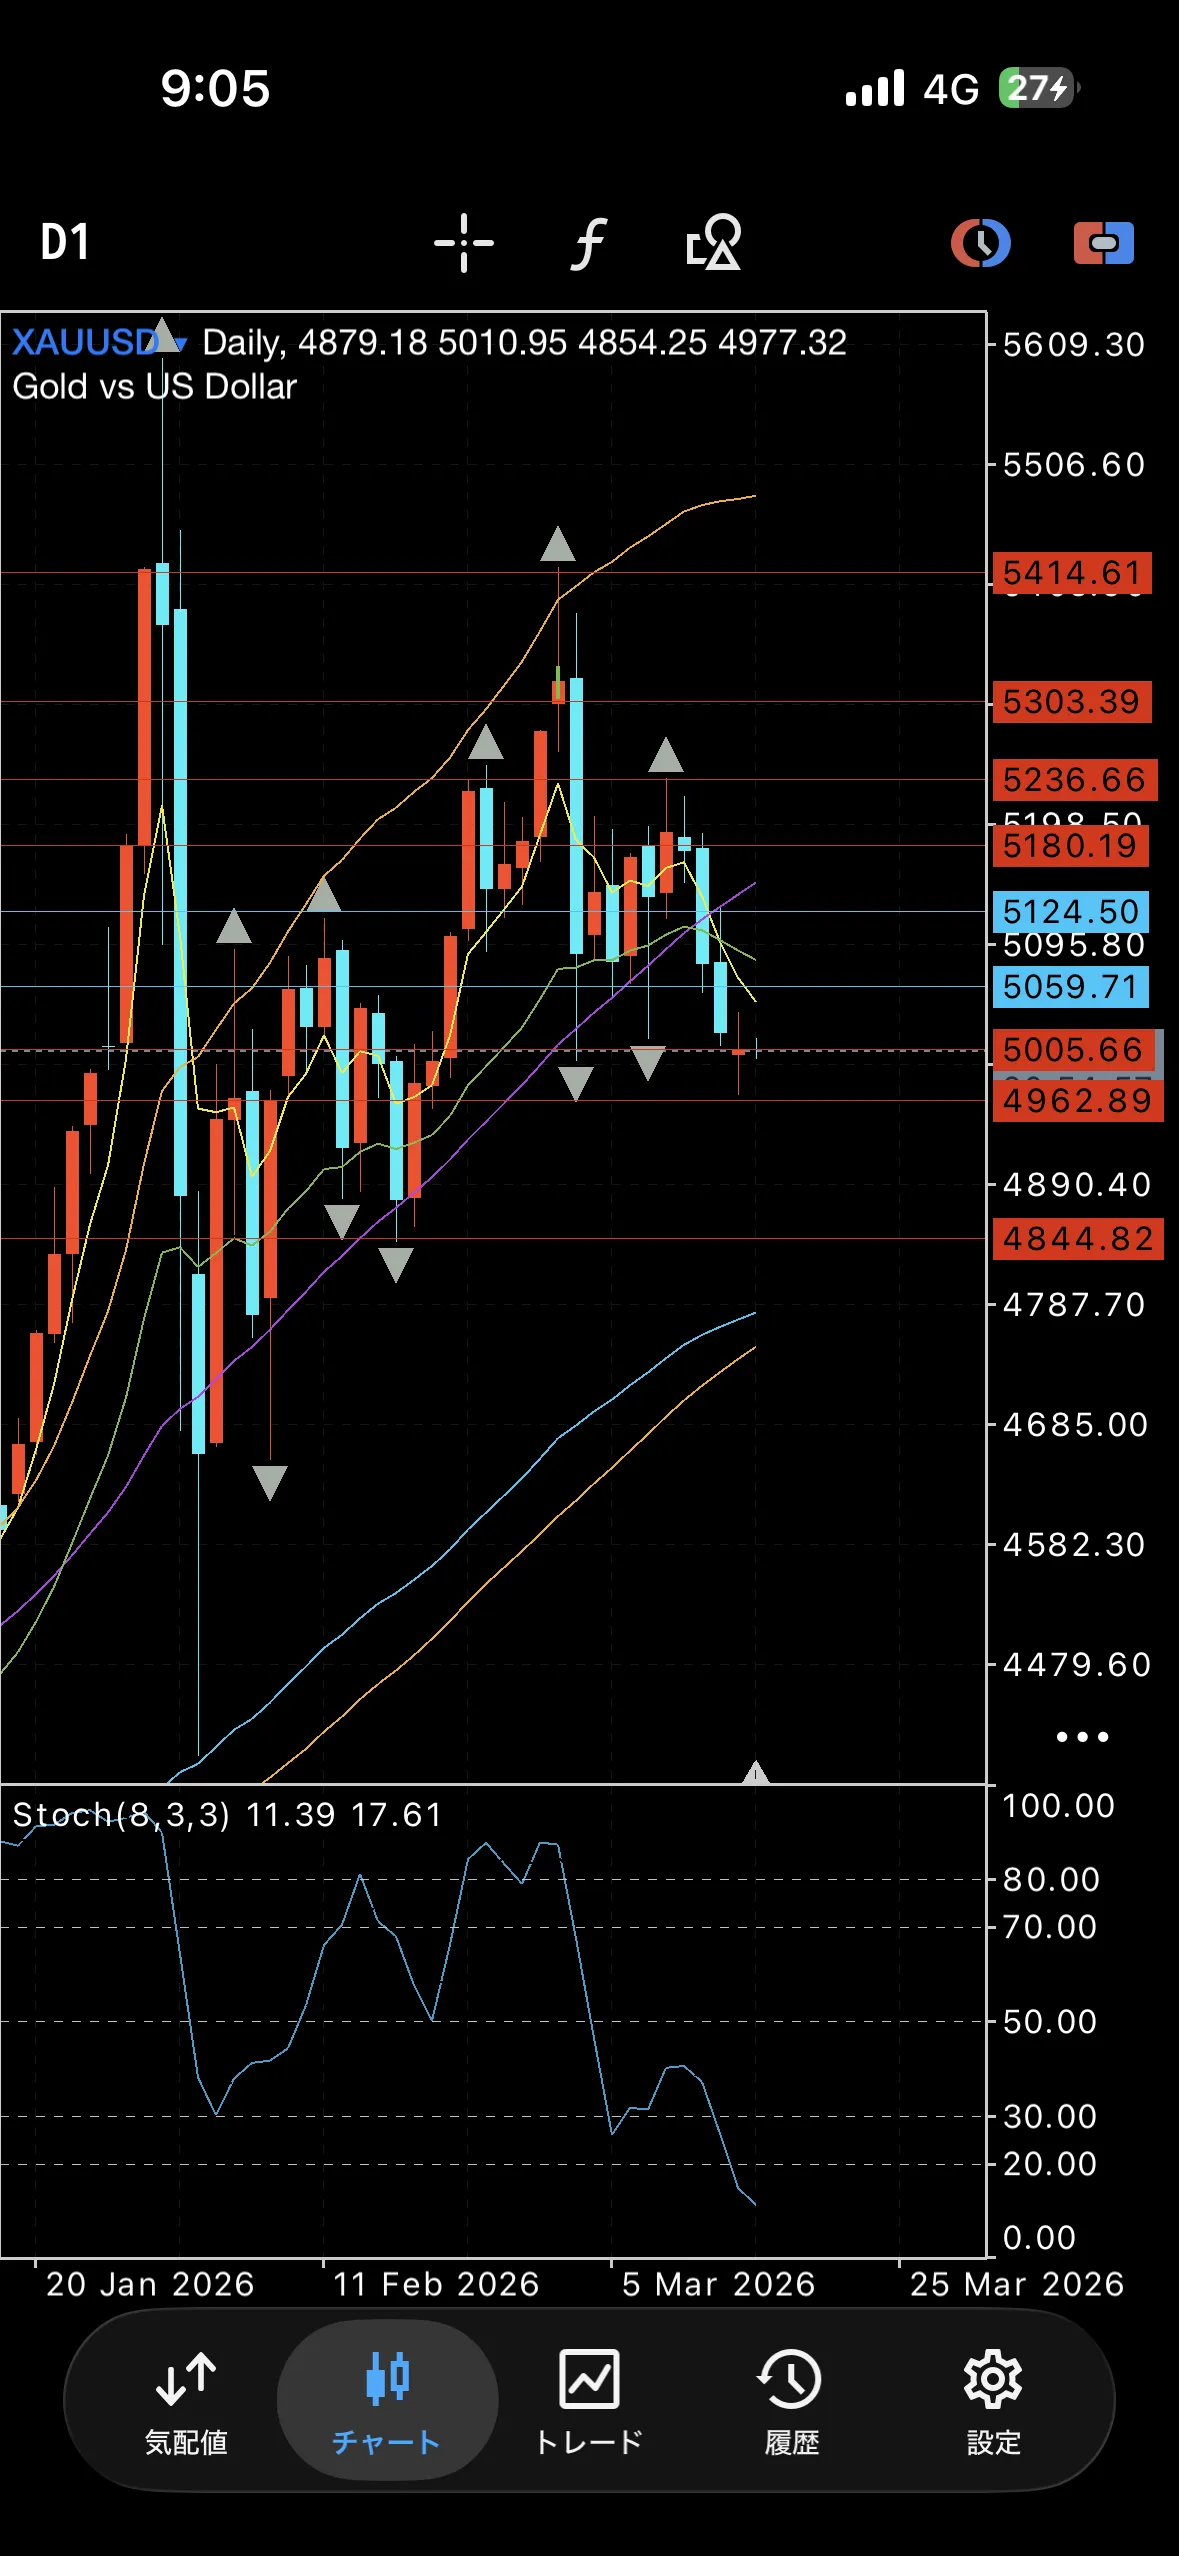
【Yesterday’s Daily Chart】
Market uncertainty suggested by the bar chart
【Daily Oscillator】
Near the short-term hidden and the lower bound of the Stochastic
【Outlook】
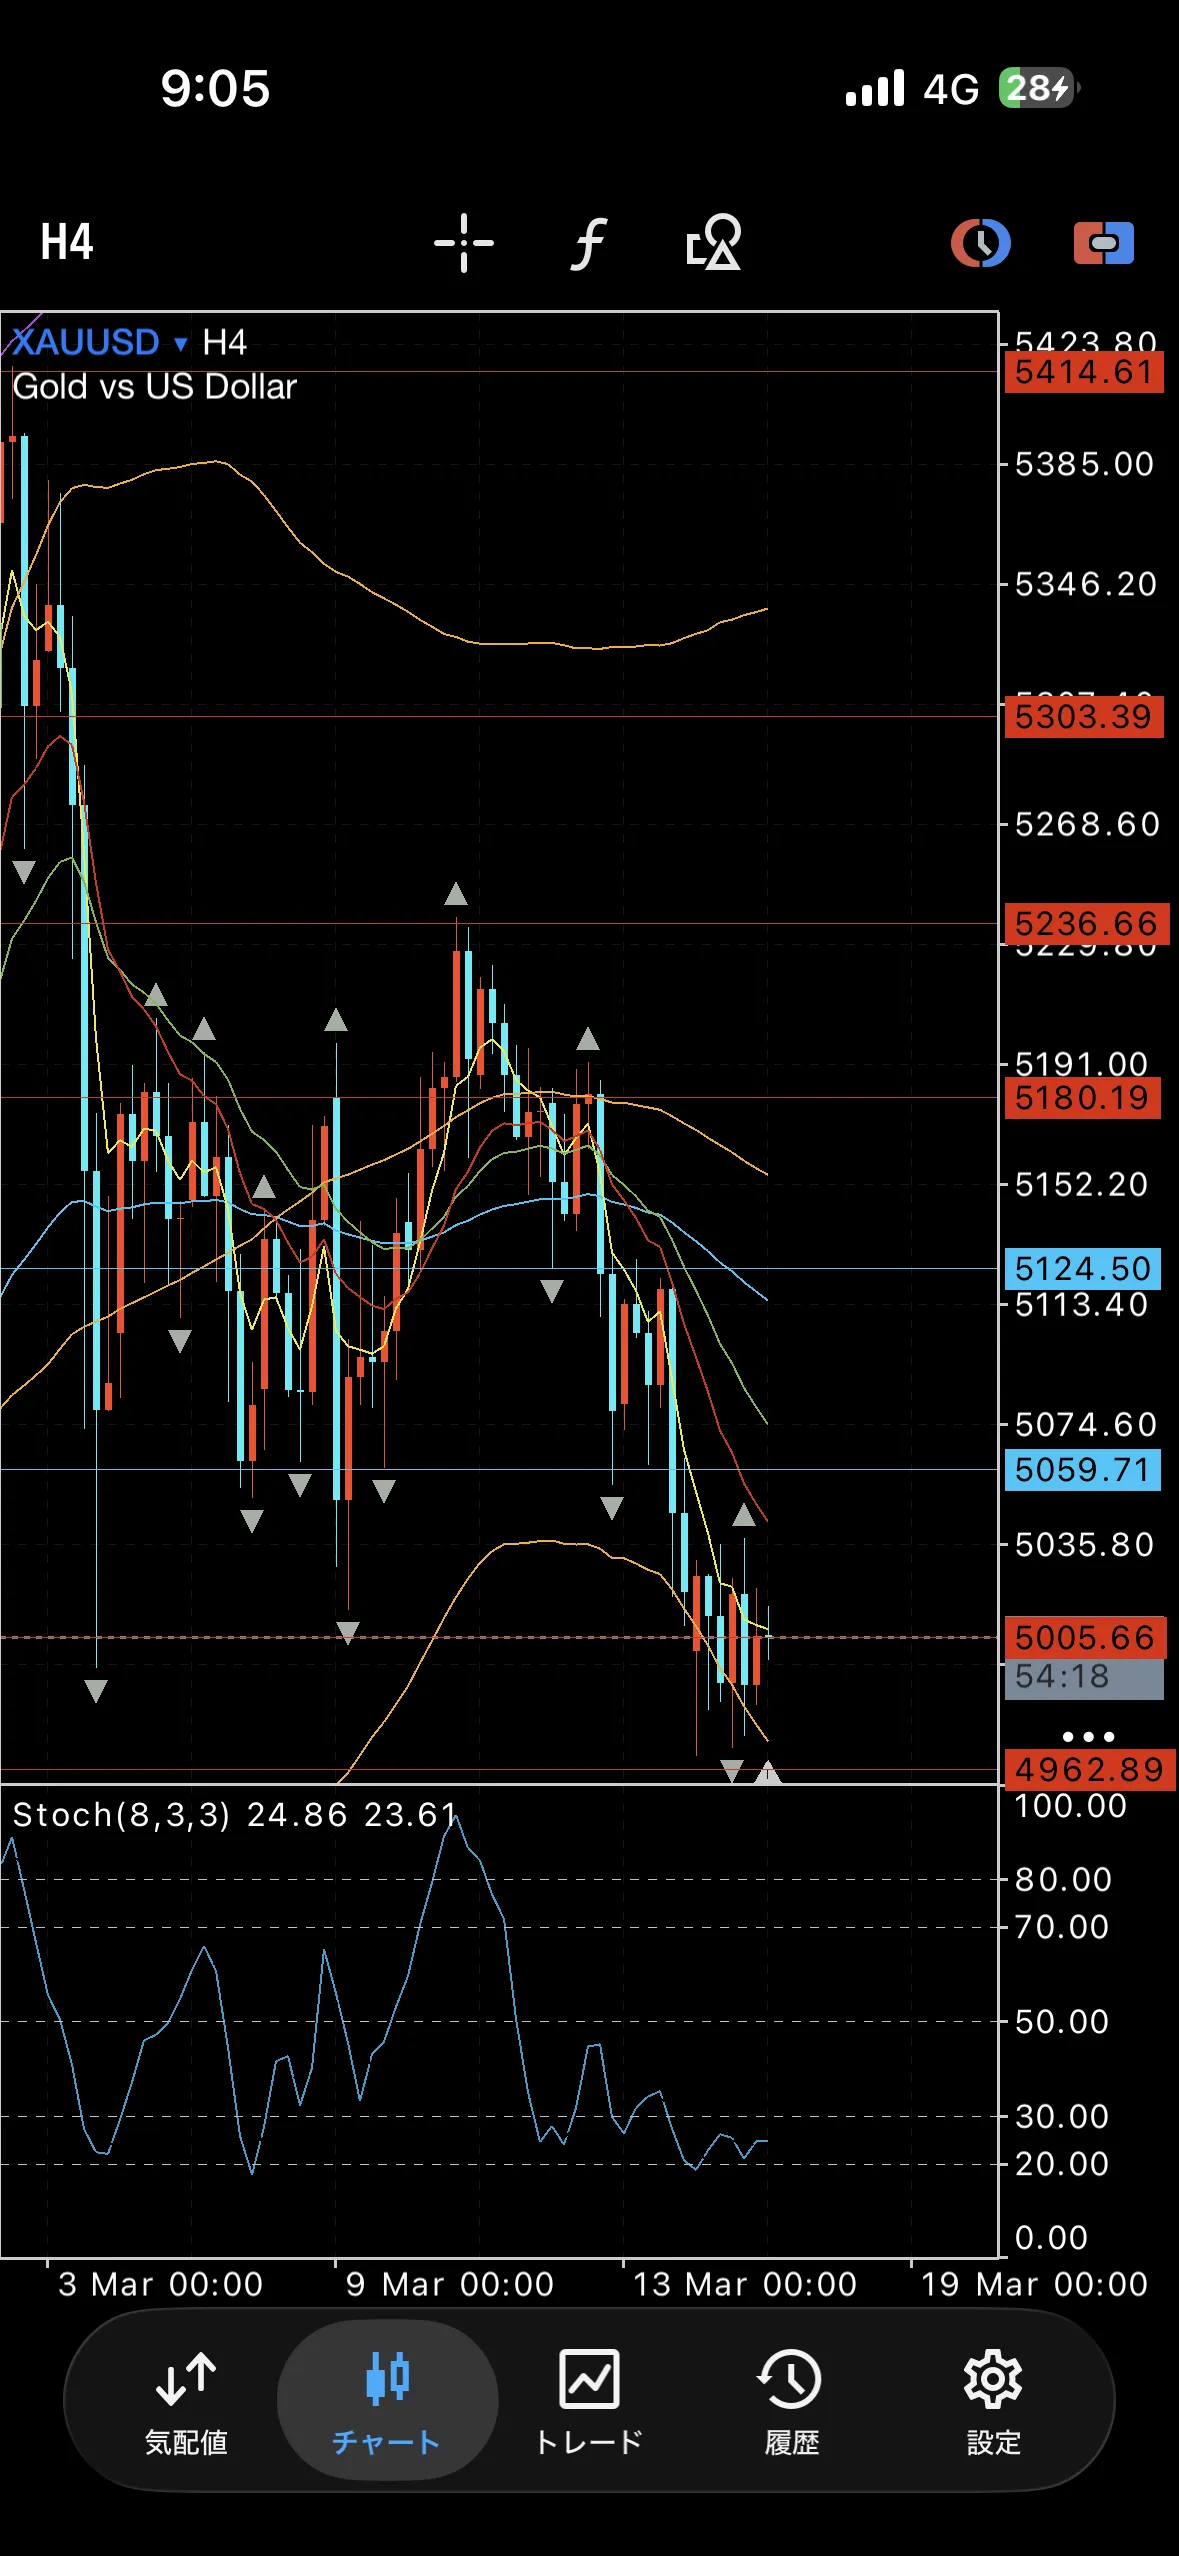
Until breaking around the 25 EMA, trend is down【4-Hour Chart】
Proceeding with multiple bearish candles breaking the neck line of a descending three-bar patternIndicators also trending downward
Furthermore, the 4-hour 200 EMA is also being broken
【Indicated Indicators】
4-Hour 200 EMA
【Outlook】
Down
【Other rule-based indicators and brief thoughts on the short-term】
Around the 1-hour 25 MA
【Key horizontal lines to watch (all near their respective zones)】
50595029
5005
4882
× ![]()