

2026/03/15 Gold Weekend Analysis
【Weekly】
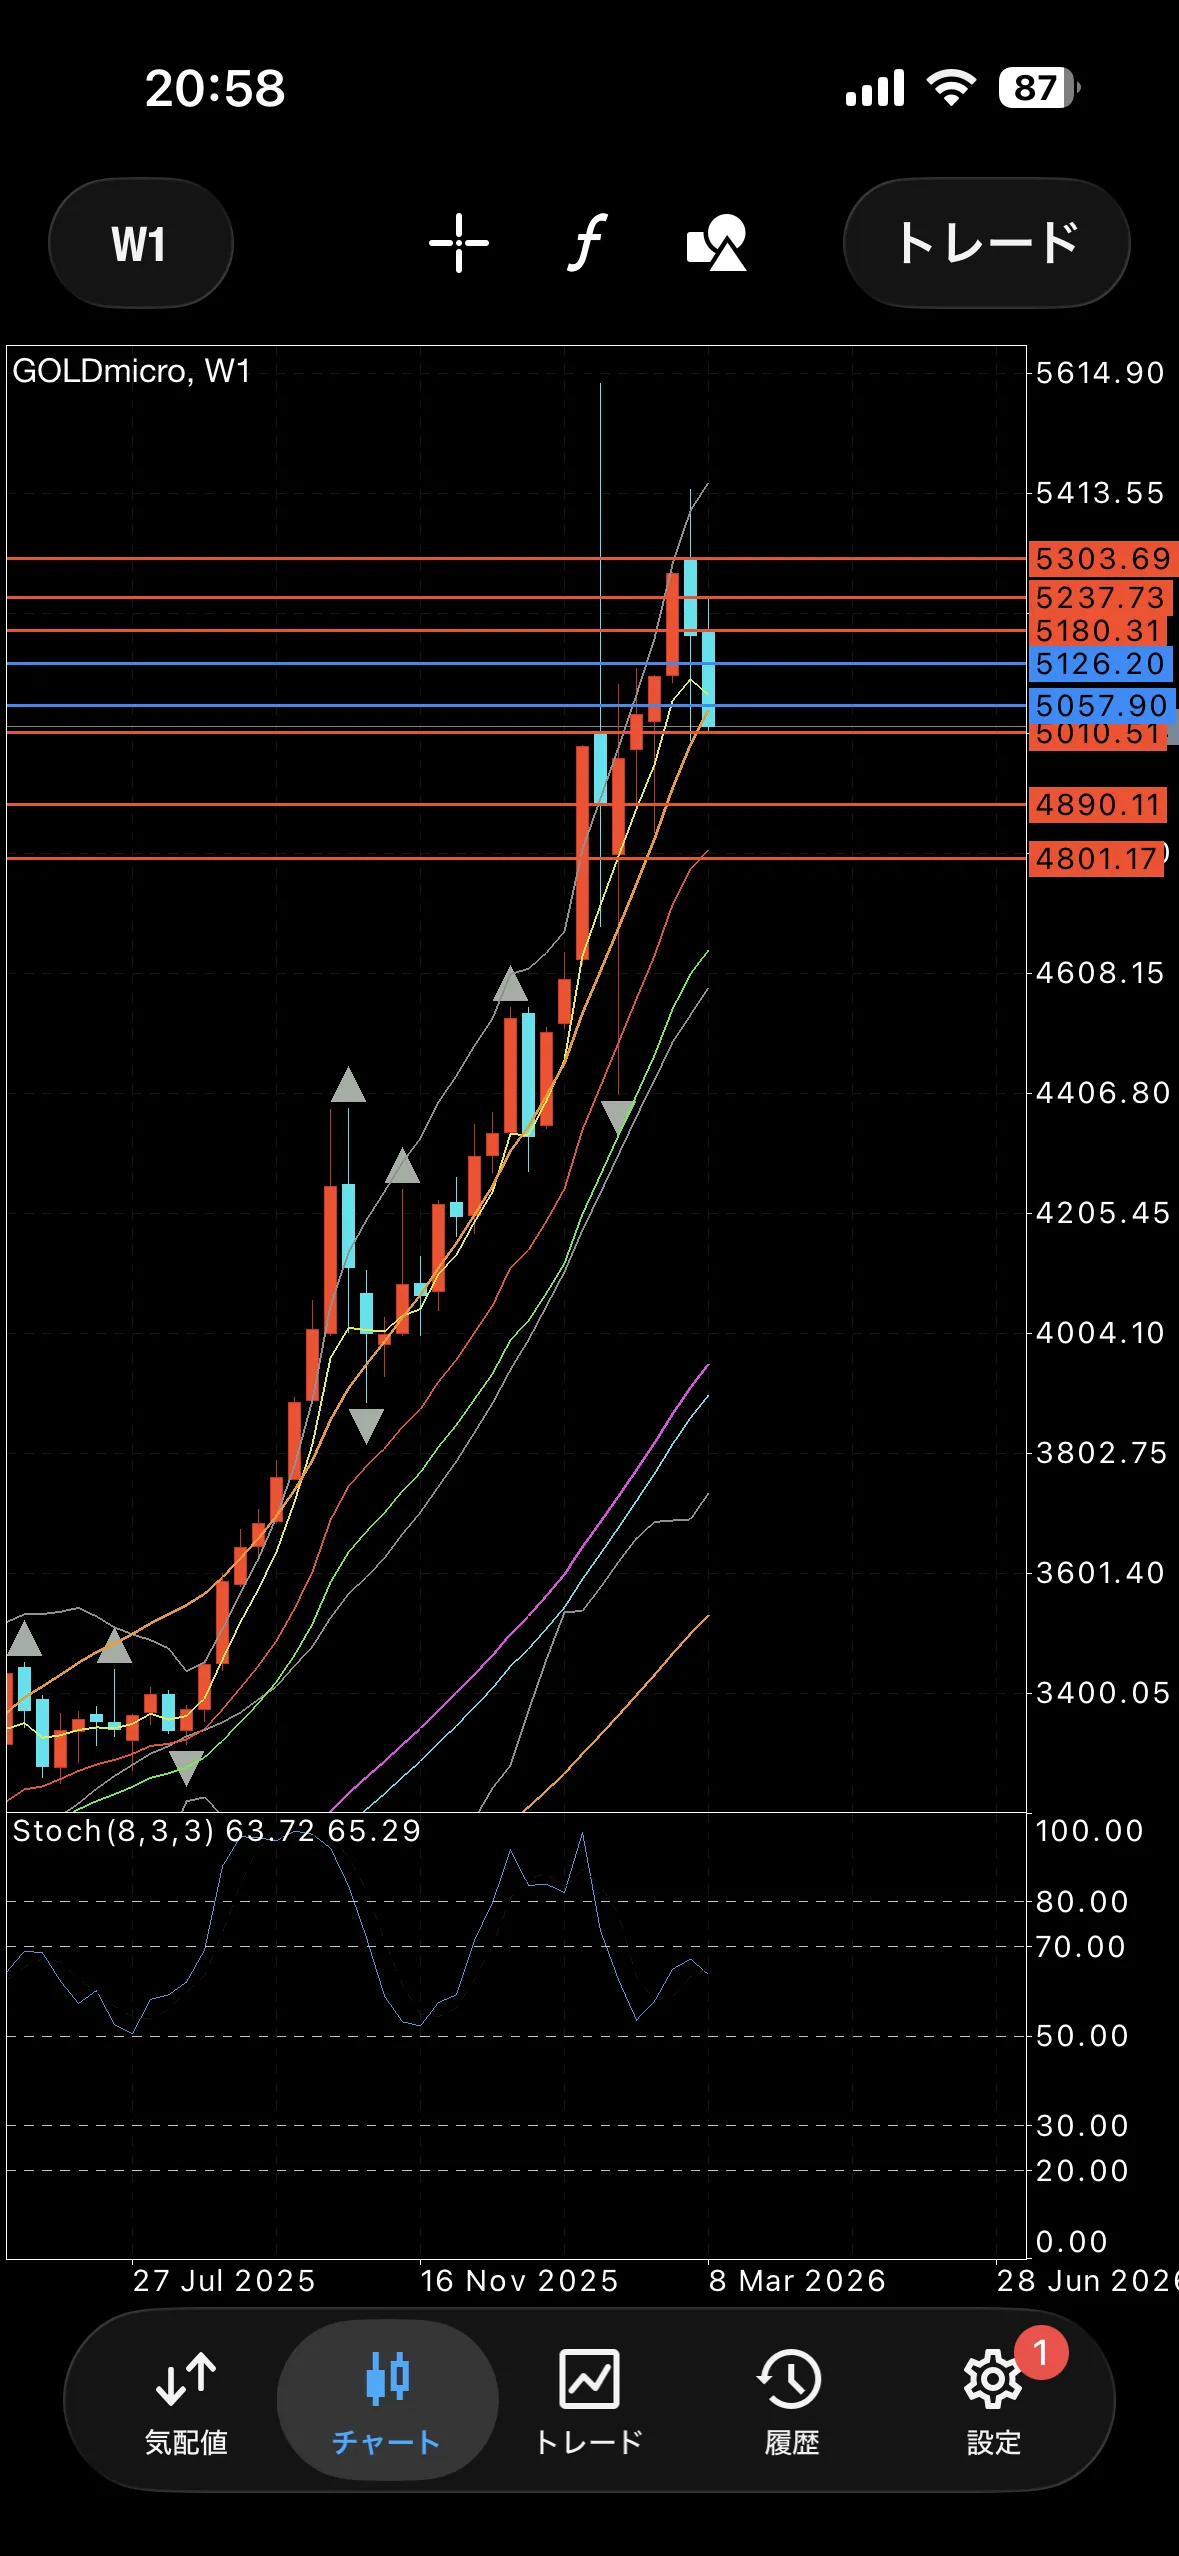
Downward view until breaking around 5303 and 5420 with a bearish candle that breaks the short-term moving average.However, currently it is stopping at the horizontal line of the forged upper shadow bearish candle in the sell-off.
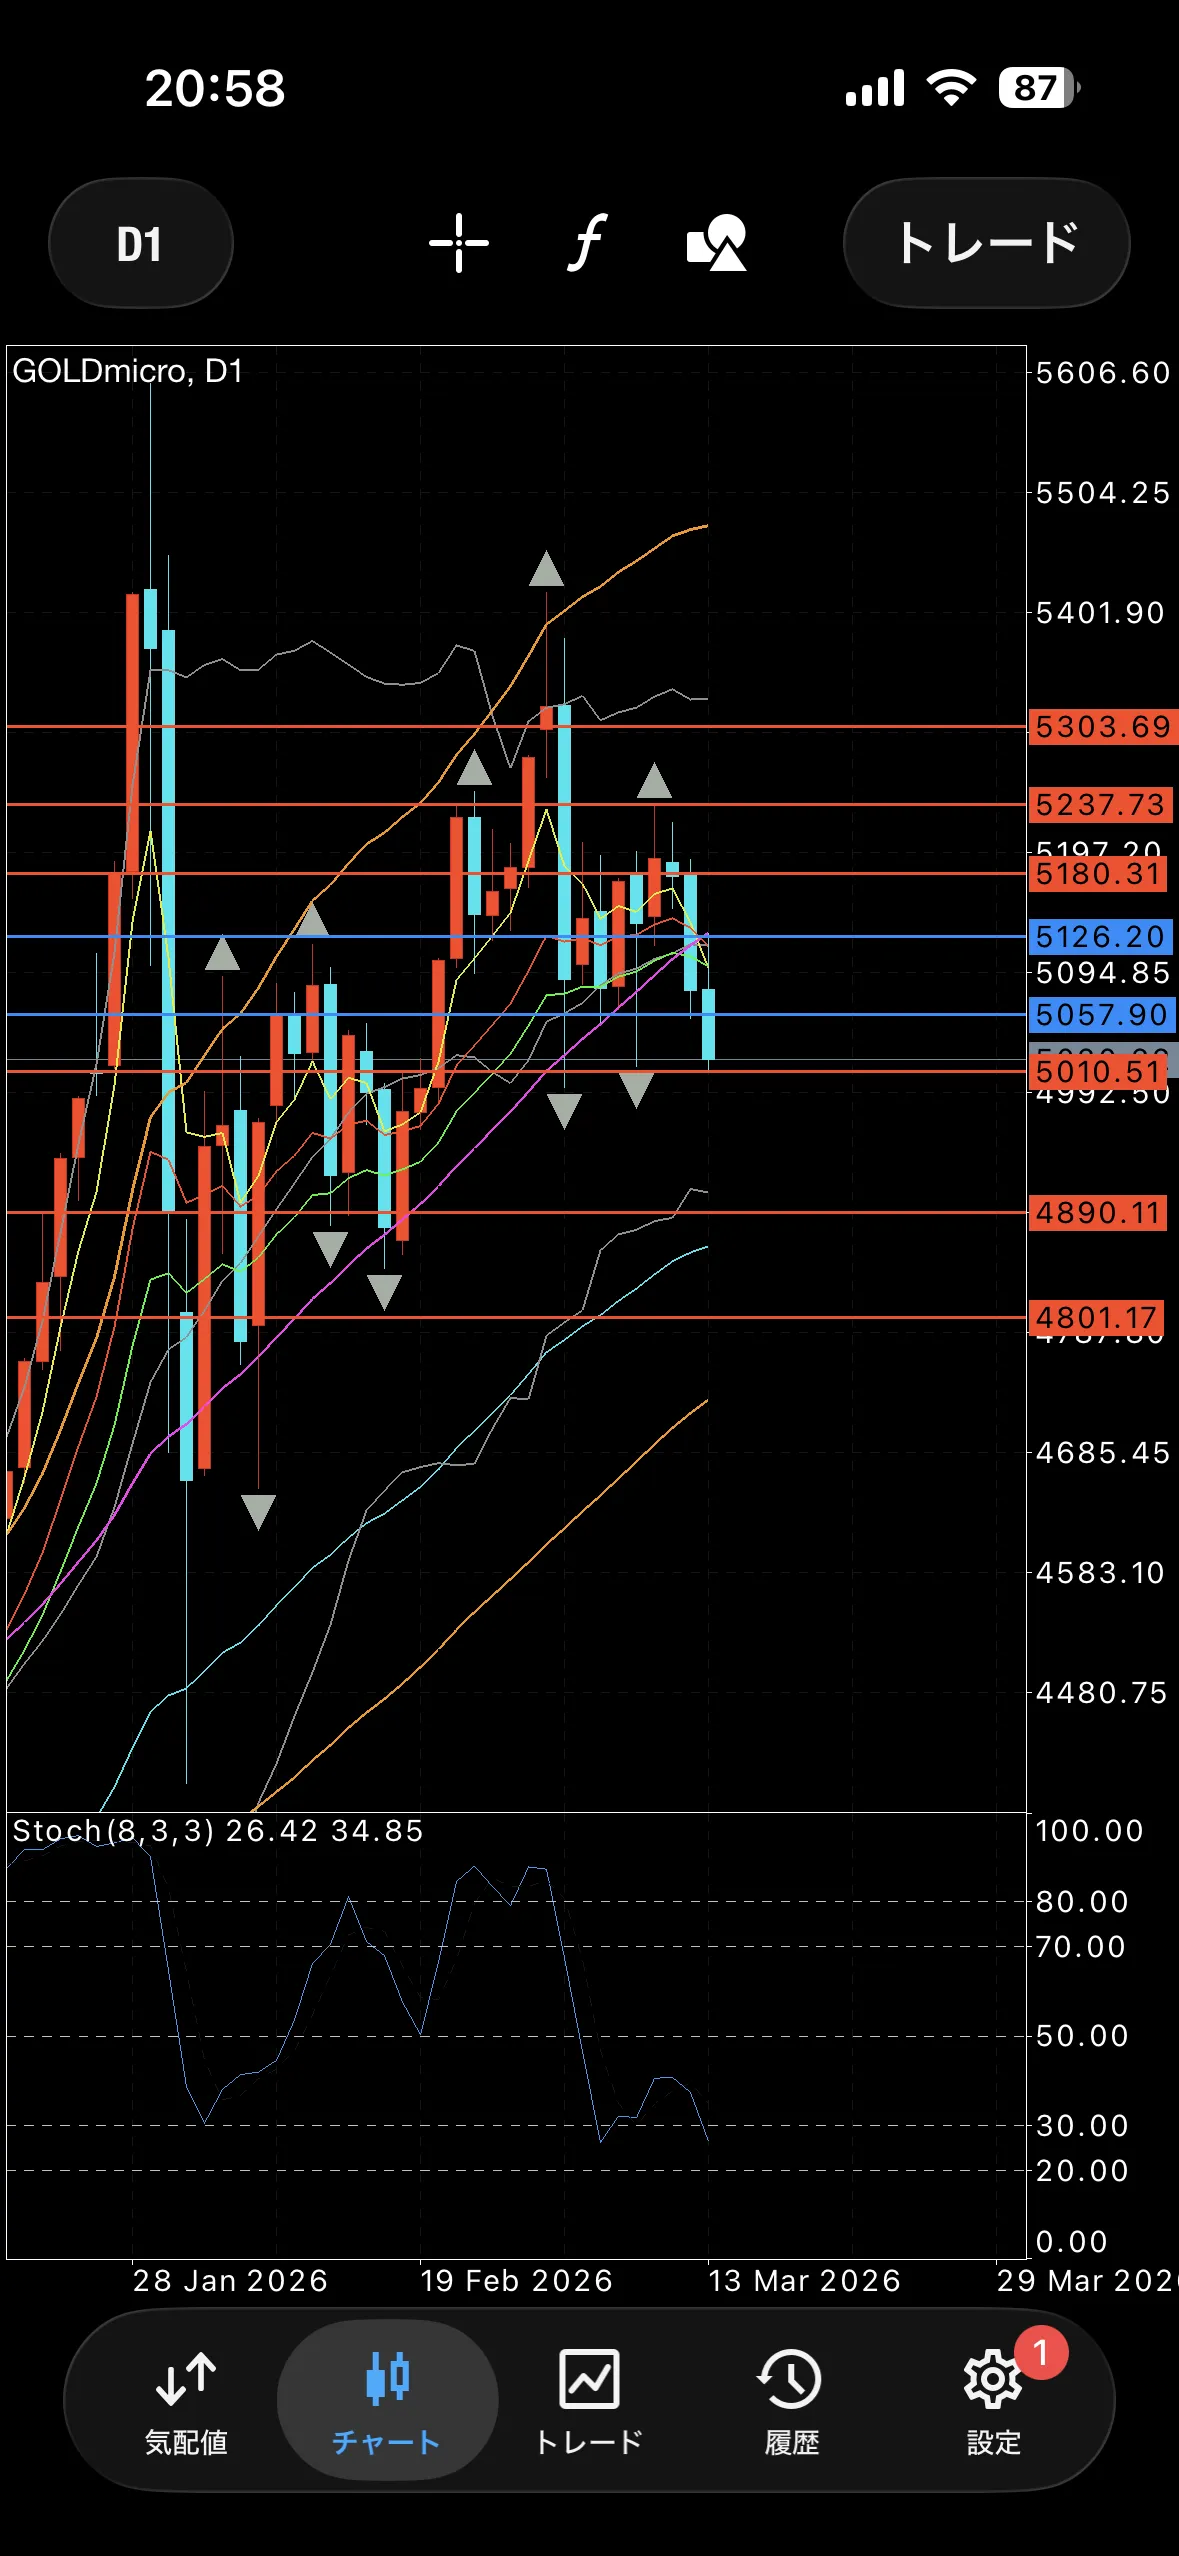
【Friday's Daily】
Bearish candle that flatlines the gains made over 5 days in 3 days.
Since the middle is also broken, a decline to around 4890 where -2σ intersects is desirable to anticipate.
As mentioned, it is stopping at the horizontal line where a rebound is expected, so beware of a sharp rally.【Daily Oscillator】
Under hidden divergence
【View】
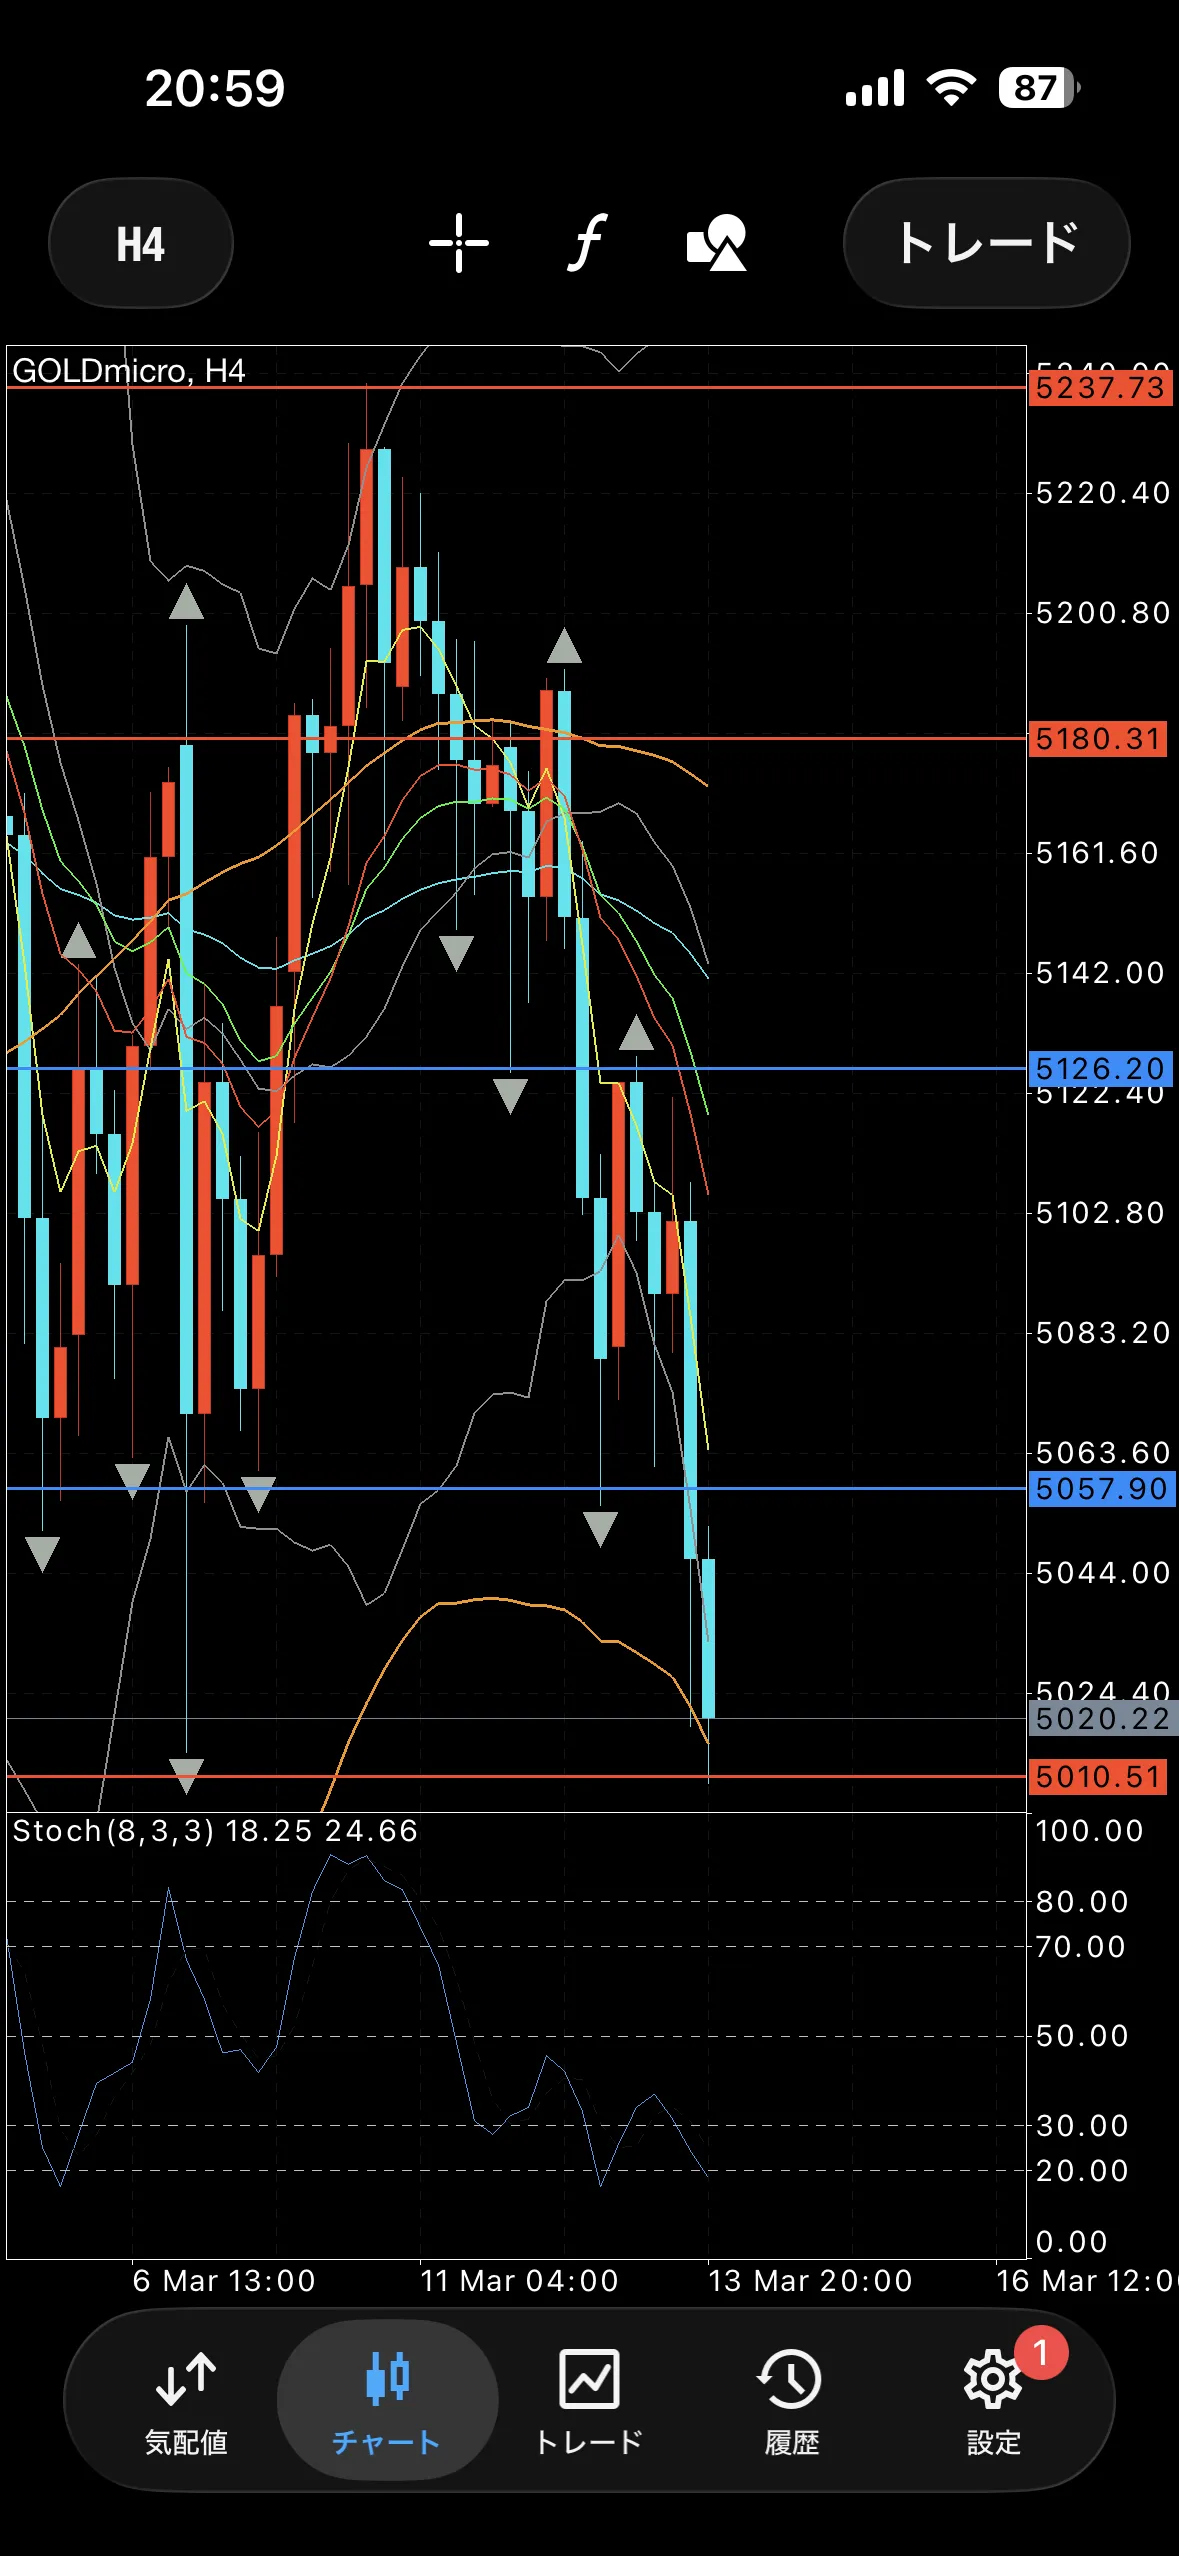
Down【4-Hour】
Bearish candle adhering after -2σ breakoutIn other words, since it is in a band-walk, buying is basically prohibited.
From the weekly view, there is a possibility of suddenly strong selling pressure, but ...In any case, expect price movement that would break through this level.
【Indicators being watched】
No particular ones for 4 hours【View】
Down【Other rule-based indicators and short-term thoughts】
1-hour 20MA, the starting point of the decline【Key horizontal lines (all near zones)】
51805126
5057
50104890
× ![]()