
[5-minute chart] Let's master Bitcoin price action with a 5-minute chart! Also introducing the basics of Heikin-Ashi (average candle) mode.
Hello everyone, Zaori-ku! I’ve never played Dragon Quest, but I do know the spell of Resurrection.@xi10jun1This is.
Bitcoin is hovering around the 100,000 yen level, isn’t it? It’s hard to believe the price moves during the bubble era...
Now, as I teased last time, “I will also write about other timeframes (5-minute and below) from now on… I think the column format will continue to change.” This time, the column format changes a little.
This Week's Performance (January 20, 2017 to January 26, 2017)
First, as usual, the results. I will announce the changes first.
- Last week (up to January 19, 2017) assets: 60,465 yen
- This week (up to January 26, 2017) assets: 60,861 yen
- Change: +396 yen
Assets are still just barely positive. I have to leave at least a 1-yen profit. Not losing is the best.
The 61,000 yen range is still far...
A Brief Explanation of Heikin-Ashi
So, from this week we will study the 5-minute chart. Since we are using Heikin-Ashi, I will first give a simple explanation of Heikin-Ashi.
Heikin-Ashi is a candlestick derived from the average values of candles, also called Koma-ashi. It is a candle that can judge the trend of the time frame (5 minutes if you are using a 5-minute chart, 1 hour on an hourly chart).
Because the method of reading it differs from normal candlesticks, please look at the following image.
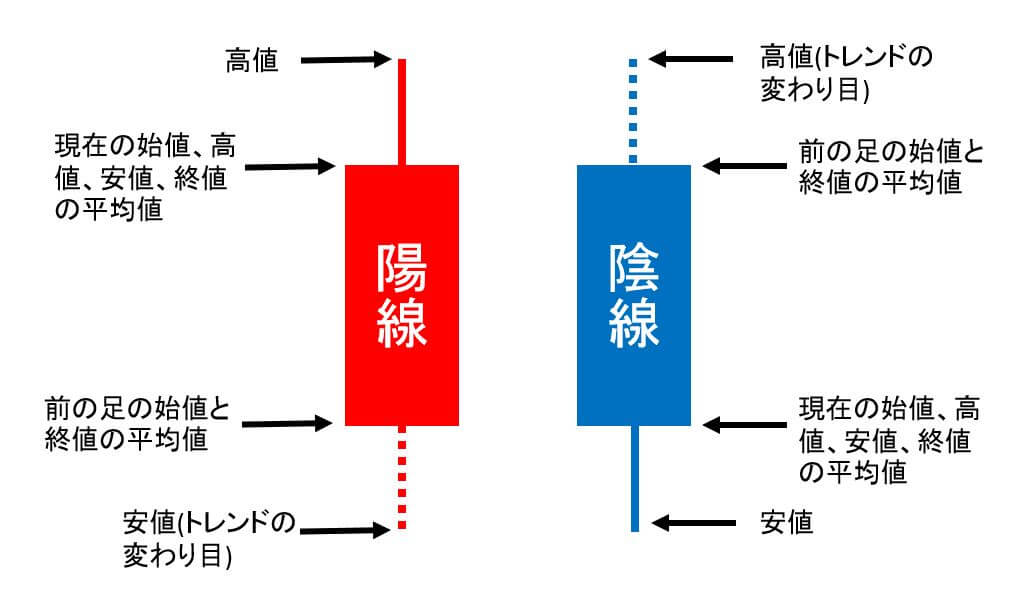
On the left is a bullish candle, on the right is a bearish candle.
When the Heikin-Ashi candle is bullish, that time frame is in an uptrend. Conversely, a bearish candle indicates a downtrend. Therefore you can judge the market flow from longer time frames such as 8-hour or daily charts.
And the shorter the time frame becomes, such as 5 minutes or 1 hour, the more you can extend profits by trading in the direction of the longer-time-frame trend.
Basic Price Movement and Trend of Heikin-Ashi
The basic movement of Heikin-Ashi looks like this.
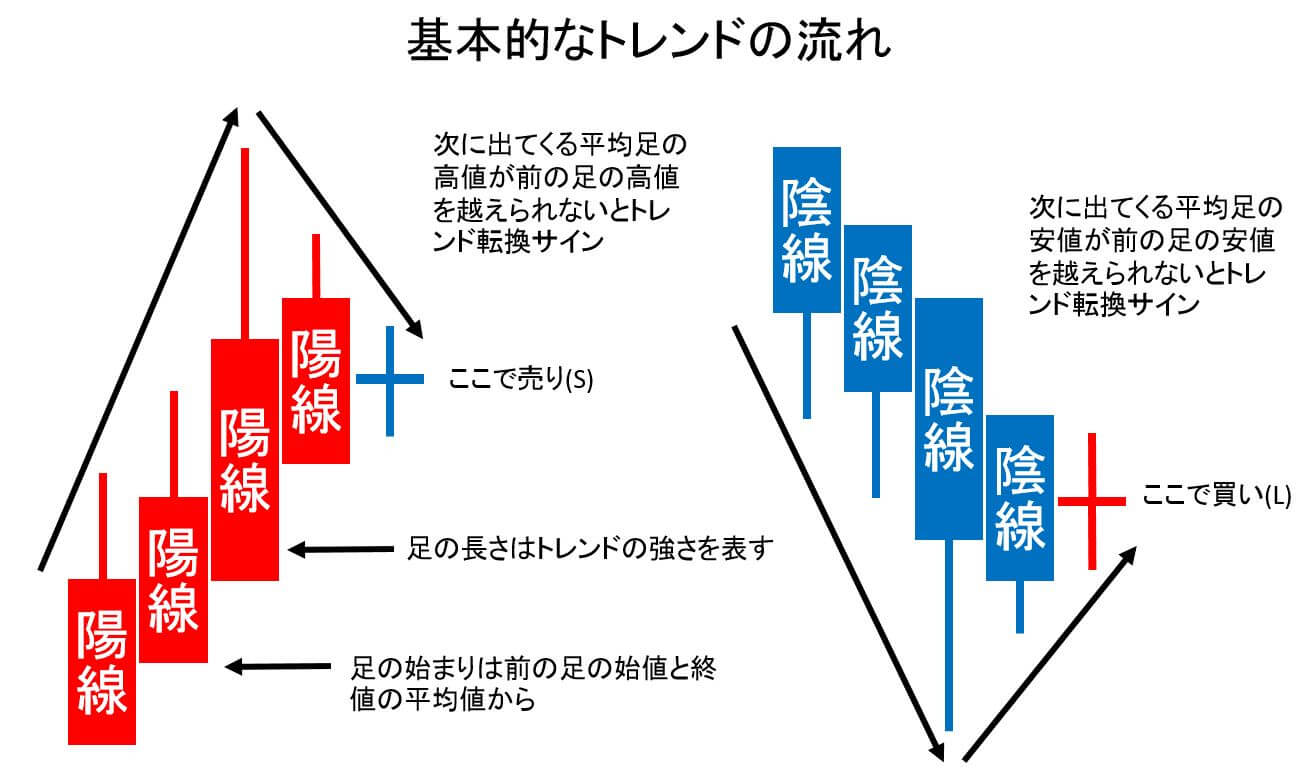
First, the left side shows an uptrend.
Heikin-Ashi always starts from the average of the previous candle's open and close. And the length of the candle represents the strength of the trend.
As the trend converges, the candles gradually shorten and eventually form a doji. This is a sign of a trend reversal.
The same mechanism applies to the right side downtrend, where after a crash and a pause in the drop, a bullish doji appears.
Important Points about Heikin-Ashi
There are also cautions with Heikin-Ashi.
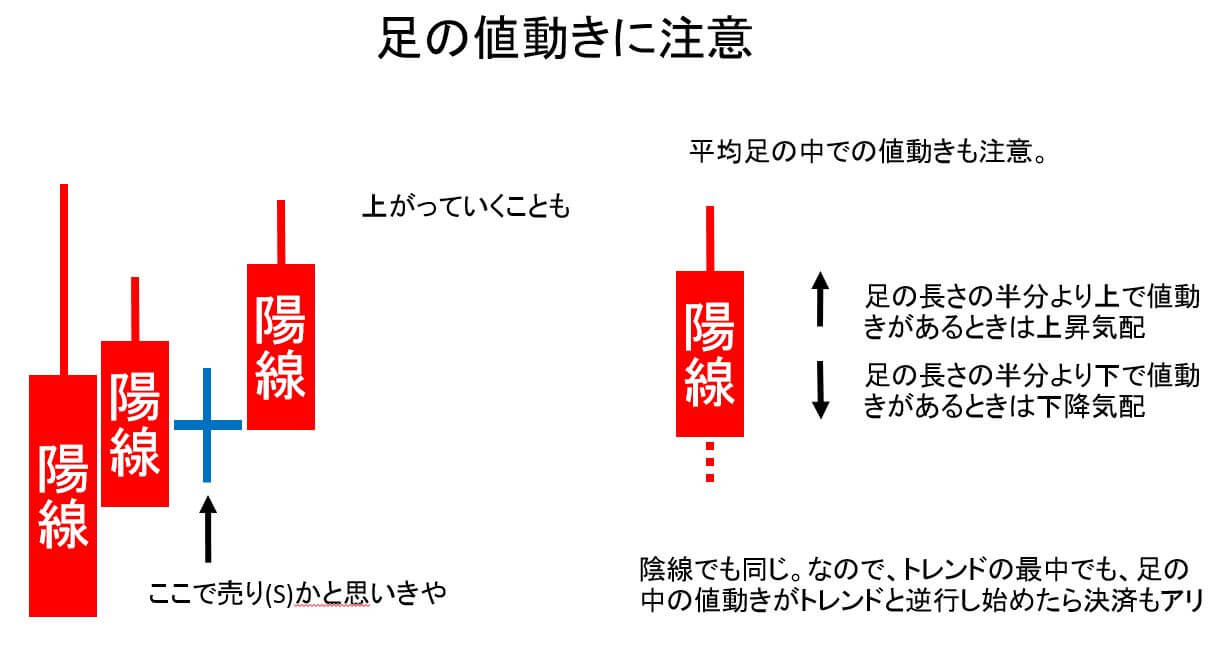
For example, during an uptrend, if the trend begins to converge and a bearish doji appears. Normally this would be a sign of a trend reversal, but as in the image, the uptrend can continue from here.
This phenomenon is often seen in Bitcoin markets before a crash, and it was the main reason I incurred losses on selling.
As shown on the right side of the image, there is movement within the candle itself. You need to determine whether the movement is occurring on the lower or upper part of the candle.
This method is mainly effective when observed on longer time frames (8 hours or daily). Depending on the case, it is possible to target significant profits with contrarian moves.
Let's Actually Look at the 5-Minute Chart
That should be enough in general, so let’s actually look at the price action of the 5-minute chart.
Sorry, I didn’t take a long-candlestick image, but on longer timeframes (hourly or 30-minute), this 5-minute chart would show a rebound is expected.
So experimentally I will buy 0.1 BTC at 102,495 yen (gif is rough, sorry...) and observe. The nearby high was around 102,580 yen, so if I clearly surpass that, I will judge that an uptrend has started. After that, I placed a stop order to sell at 102,100 yen.
About 30 minutes later, the price rose. I viewed this as a trend starting, so I added 1 BTC!
For now, as an experiment, I liquidated the additional 1 BTC at 102,800 yen (some small BTCs were settled along the way, but all settled). The remaining 0.1 BTC was settled shortly after, giving a total of +179 yen.
In this way, by judging the long candles for the trend (this time expecting a rebound) and trading on the shorter candles, Heikin-Ashi makes high/low values visible at a glance, making it easier to set stop-loss levels.
Free Summary: Use long-time-frame for trend, short-time-frame for trading
Once Bitcoin establishes a clear trend, it moves very strongly in that direction. So when an uptrend occurs, you can ride a somewhat larger position to earn a reasonable profit. The opposite is also true, but you must be careful because wrong moves can cause big losses.
However, to judge this properly, I think Heikin-Ashi is easier to use. This may depend on the person, but I believe Heikin-Ashi's characteristics mesh well with Bitcoin market behavior, so I will continue trading with Heikin-Ashi.
As for this 5-minute chart study, I will continue to test it a little longer. If I have losing trades, I will share them; if I capture something well, I will publish it.
Also, it takes time to create and upload these GIFs, so I don’t expect to make too many. It would be nice if a single GIF could be 2 MB in size. Depending on that, the column may become shorter, so please understand in advance.
Paid content will continue with detailed analyses and future outlook as usual, so I would be glad if you subscribe!
End Corner: Shopping with Bitcoin!
Actually, the overseas e-commerce site FANCY allows you to purchase products with Bitcoin! It does charge some shipping, but you’ll find stylish items you won’t see in Japan!
Instructions for using FANCY are summarized on this blog, so please refer to these pages.
- →FANCY (Fancy) account creation, registration, and product purchase flow explained! | Investor Jun of the Yotori Generation
- →How to purchase (pay with) Bitcoin on FANCY | Investor Jun of the Yotori Generation
Note: The free content ends here. From here on, there will be detailed analyses and future prospects, so it will be paid content. If you’re interested, please consider subscribing!