

Sell at premium in the 6th round, buy at a discount—the true nature of "0.705" when big players go all-in [SMC Basics ⑥]
Hello,naodesu.
Last time, we explained the FVG (Fair Value Gap). The idea was that the move would “return to the price gap,” andOBandFVGoverlap in an area that becomes the highest-precision reaction zone.That was the discussion.
This time, to further narrow down the entry zone, we will discuss the perspectives——Premium-DiscountandFibonacciOTEzoneexplanation.
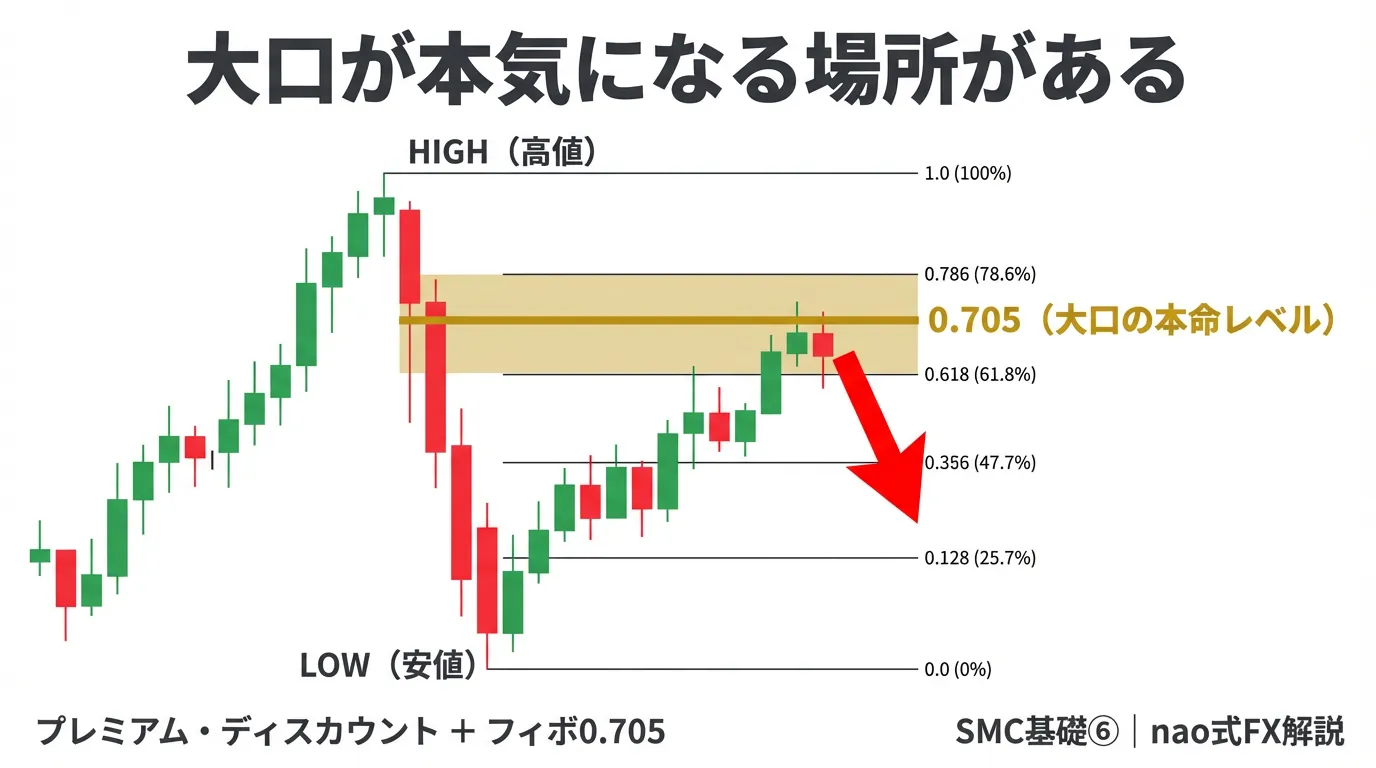
And inside this, there exists a special level called0.705. It’s not listed in standard Fibonacci tools, buta core level where big players seriously accumulate positionsand is highly valued in English-speaking ICT communities.
■What is Premium-Discount?
In the world of FX, the basic principle is to buy low and sell high. This applies to both retail traders and big players.In SMC, this judgment of “cheap” and “expensive” uses the concept of
Premium-Discount.
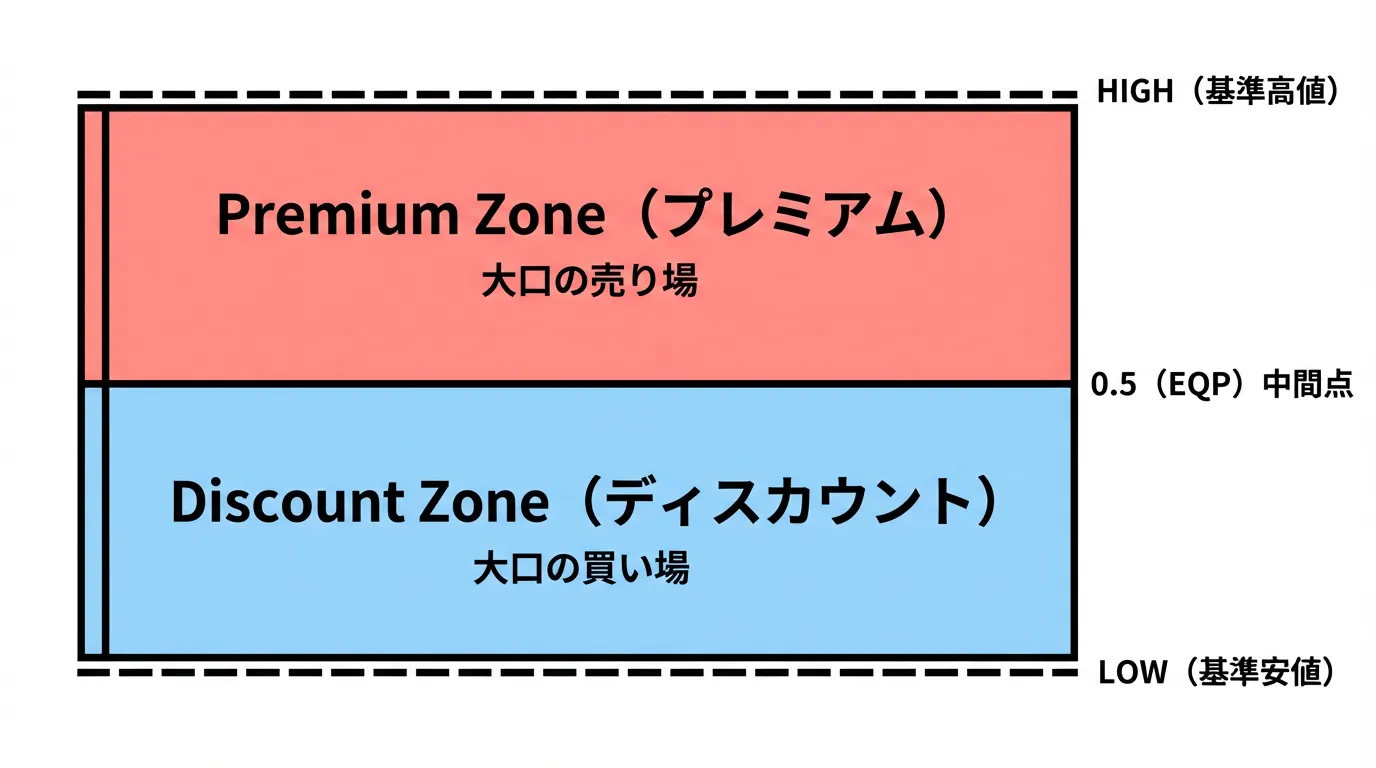
The recenthigh and low midpoints (0.5line =EQP) are drawn, with the area above it being the “Premium Zone (high price area)” and the area below it the “Discount Zone (low price area).”.
・Premium Zone (0.5 and above): an area that is overpriced. Big players sell here.
・Discount Zone (0.5 and below): an area that is underpriced. Big players buy here.
The concept is simple.Big players buy a lot at cheap prices and sell a lot at high prices.Unlike individual counter-trend trading, they place the largest orders at the most undervalued or overvalued points, capable of moving supply and demand in the market.
OBandFVGWhen found, the meaning changes depending on whether they are in the Premium Zone or the Discount Zone. In a downtrend retracement, the OB in the Premium Zone is the place where big players short aggressively.
■ OTEZone——The most precise entry point
“Sell in premium, buy in discount” is understood. But where exactly in the premium zone should we sell?
That’s where Fibonacci Retracement comes in.
SMCuses Fibonacci retracements for the retracement in a downtrend.
How to draw: start from the upward move (base low) = 0, recent high = 1.0= 0, and draw Fibonacci from high to low. At this time, the zone from
0.618〜0.786is called the “OTE(Optimal Trade Entry)zone. In Japanese, this is the “Optimal Entry Zone.”When retracement comes, it is the area where big players most actively build positions.The 0.618 is the classic Fibonacci level known as the golden ratio, corresponding to a deep portion of the Premium Zone.
0.786is even deeper, near the highs. The range between these two is considered the optimal zone for big players—neither too deep nor too shallow—and is regarded as the most cost-efficient place to accumulate positions.
■ 0.705——
OTEzone (0.618〜0.786) has a special value.0.705.
Standard Fibonacci tools do not include0.705.TradingView
This is ICT’s (Inner Circle Trader)独自の concept, stating that the level just above the mid between 0.618 and 0.786 is where institutions are most serious about building positions.
ICTtheory says that institutions (big players) are most serious about building positions at0.705. While big players may probe at 0.618, once they reach 0.705 they become confident and place orders in earnest—this is the level when “this is it.”
TradingViewallows manual addition ofto the Fibonacci settings. After adding it, you can observe the market retracements stopping unusually at this line.
The important point is thatis not a single point but is used by watching the zone from0.618〜0.786, centering around0.705. It works within the context of the entire OTE zone rather than alone.
■ GOLD 1/29〜2/2の実例——1万PIPSPIPS
概念だけでは伝わらないので、最近の実例を2つ挙げます。どちらも同じ相場で起きた、0.705の「二重の証明」です。
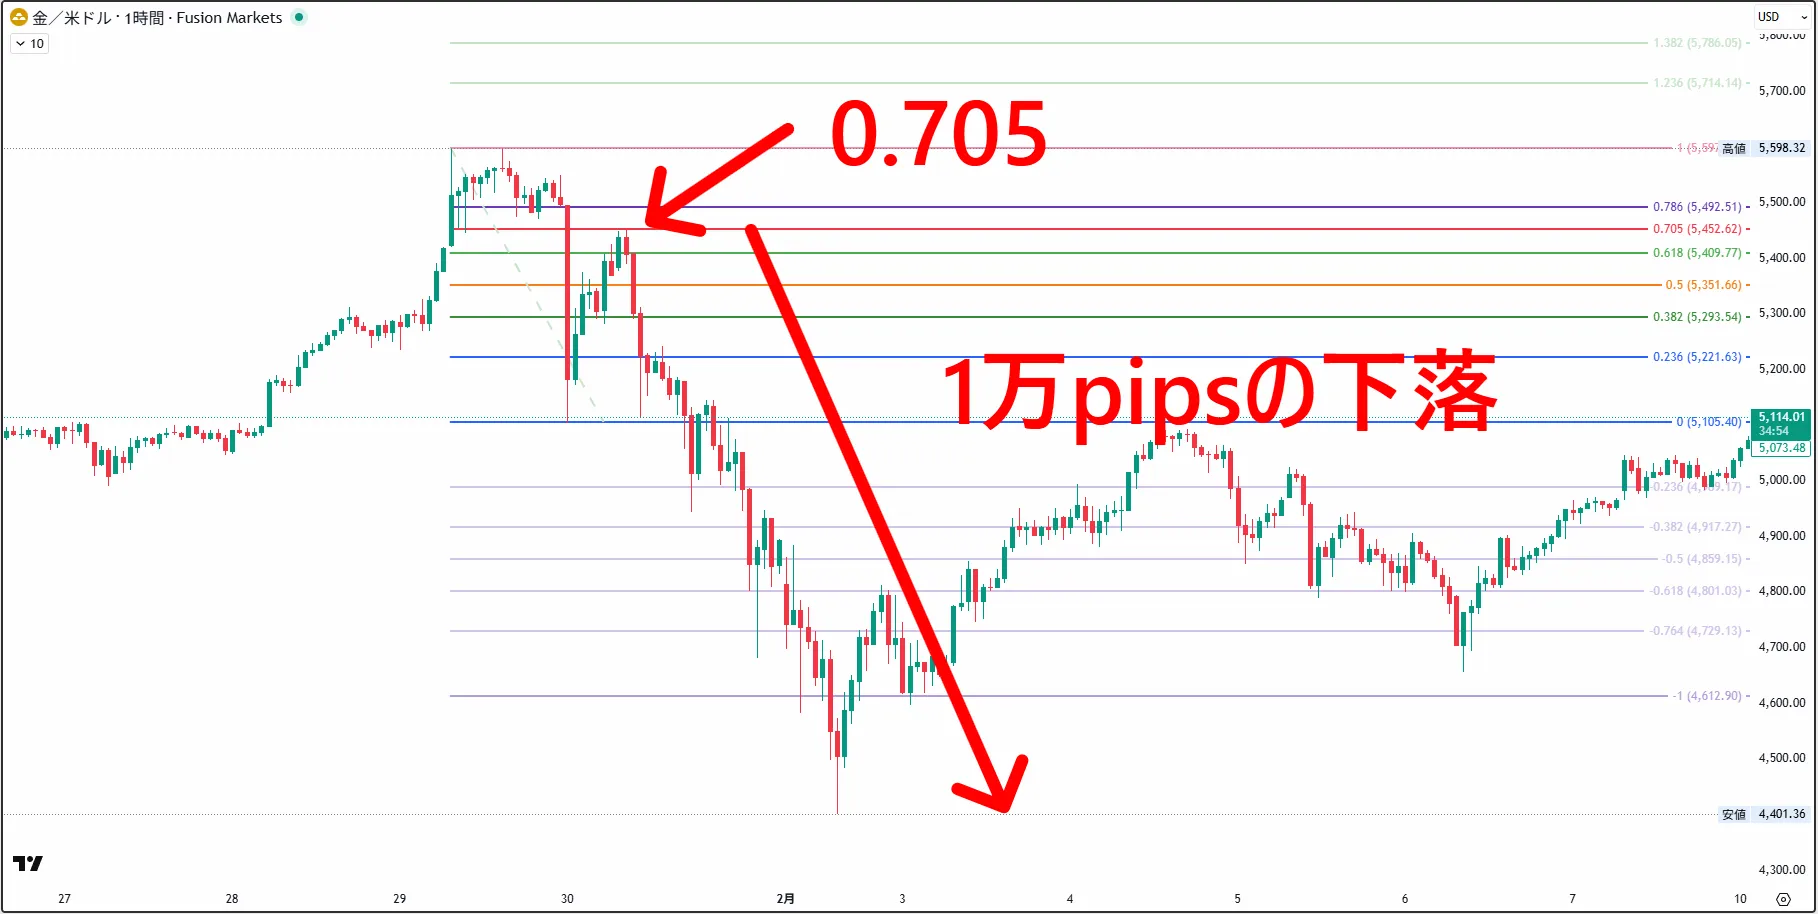
【実例① 1/29〜2/2:0.705が天井となり1
2026年1月29日、GOLDは最高値5,598.32をつけました。
直近最高値(5,598.32)から直前安値(5,106.41)へのフィボを引くと、0.705のレベルは5,449.52になります。
1/29の最高値からまず約4,900PIPS急落(→5,106.41付近)。その後、価格は反発し——0.705(5,449.52)のラインにピタリと頭を叩かれ、そこから最終安値4,401.36まで約10,485PIPSの壮絶な下落が始まりました。すべて1/29〜2/2の期間に起きた動きです。
0.705が天井として機能し、大口がその水準でショートを本格積み増ししていたことが数値で確認できます。
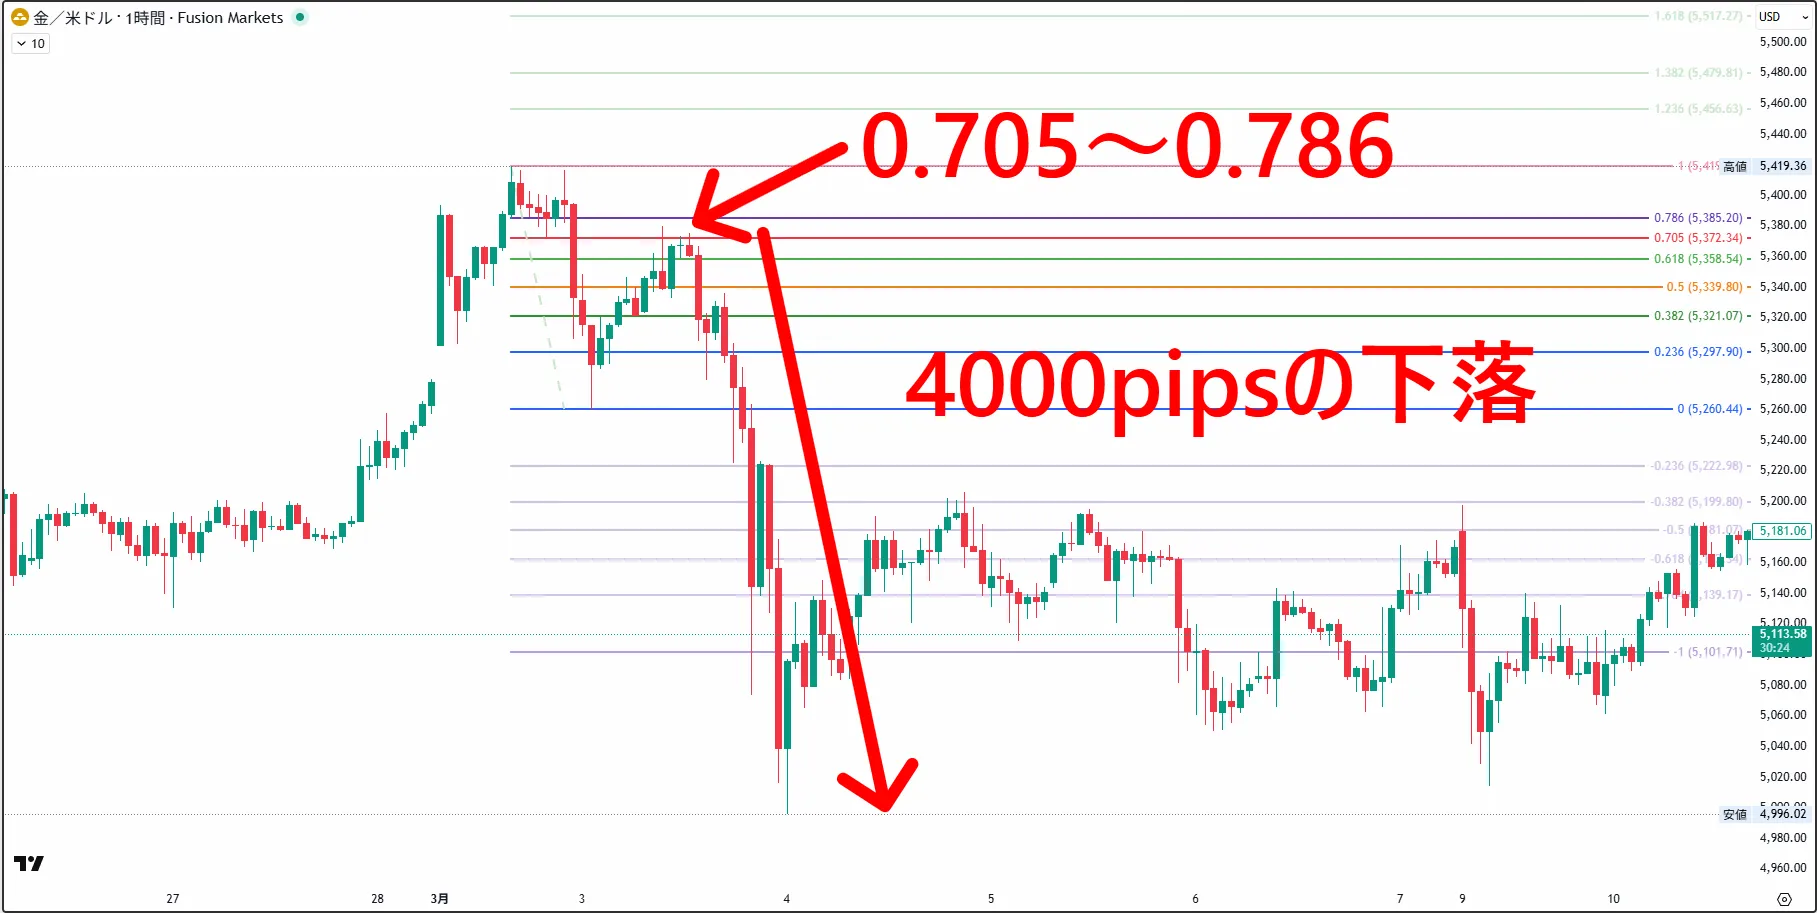
【実例② 2/28〜:別の急落でも0.705〜0.786
これは1/29とは別の場面です。228日以降、GOLDは高値(5,419.36)から約1,500PIPS
この急落後の戻りを計測すると、3/1の戻り高値(5,419.36)から基準安値(5,260.82)へのフィボで、戻りが0.705(5,372.73)〜0.786のゾーン内にピタリと収まり、そこからさらに大幅な続落(→4,996
1/29の大規模下落でも、2/28の急落後の戻りでも——0.705〜0.786のOTEという、理論と実際が一致した場面でした。
■ naoの本音:フィボと出会ったのはSMCより前の話
実は、私がフィボナッチを使い始めたのはSMCを学ぶよりずっと前です。
当時から「フィボ50〜61.8をゾーンとして見る」という使い方をしていました。「価格が50%61.8%
SMCを学んでから、自分が「ゾーンの上限」だと思っていた0.618が、実はOTEゾーンの入り口だったとわかりました。0.618〜0.786がOTE—0.705自分が「ここで止まる」と見ていた水準のすぐ上に、大口が本格的に動き出すエリアが広がっていたわけです。そしてその核心が。「なんとなく効いていた」と思っていた場所は、実は
そしてこれは、実際にトレード前に予測していた話です(※下のLINE
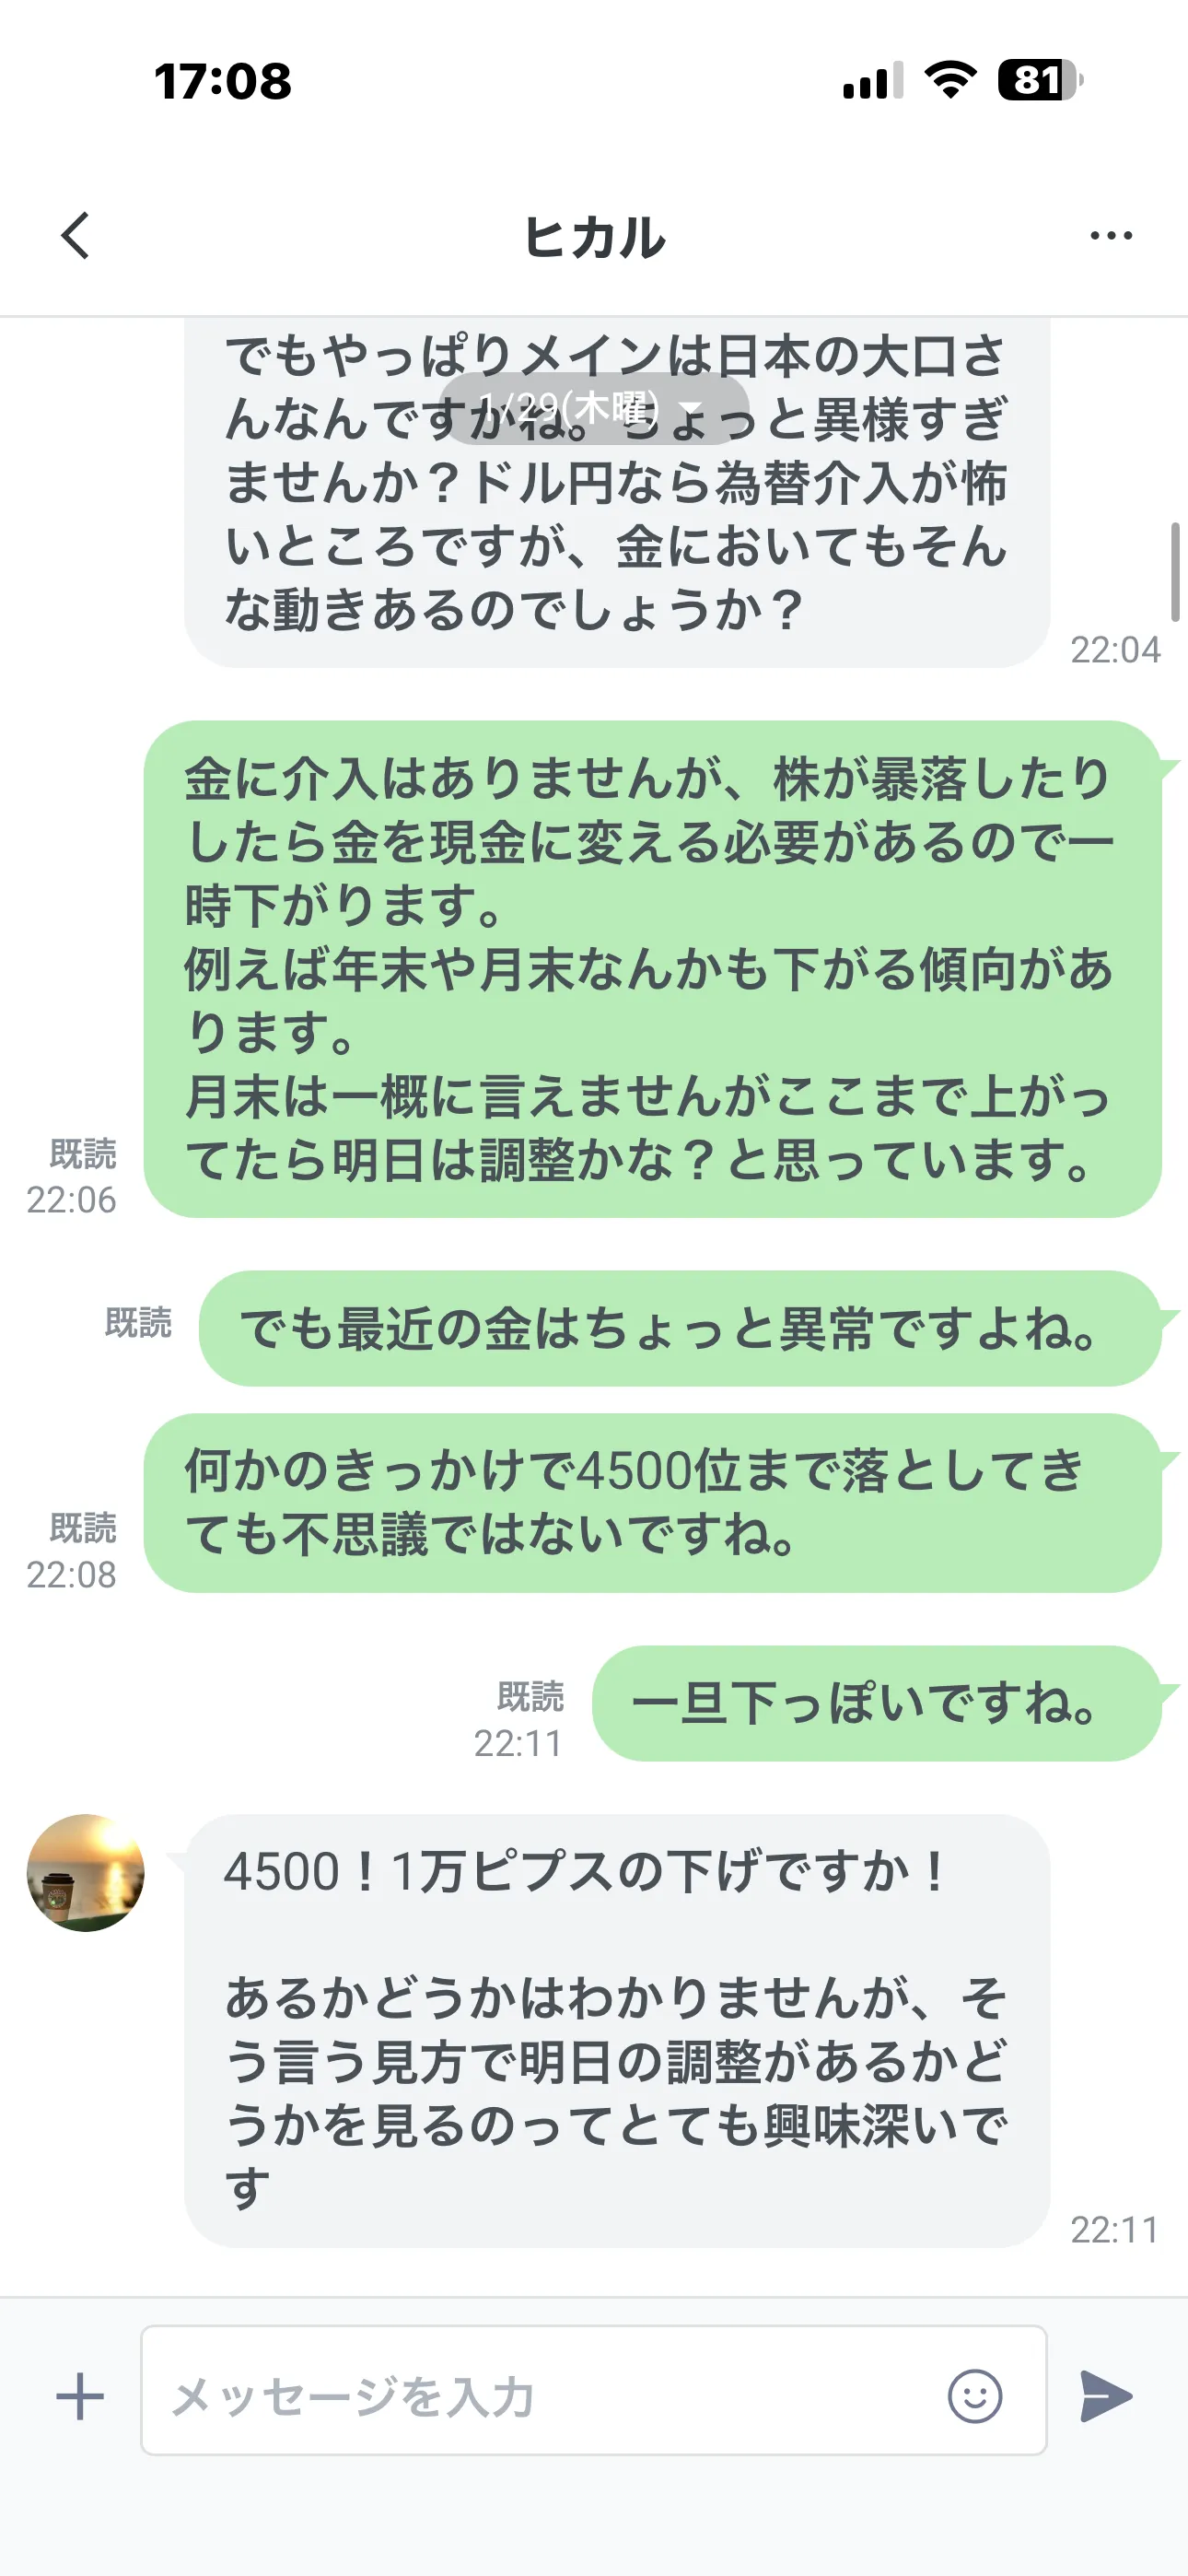
1月1が高値——GOLD何かのきっかけで4,500くらいまで落としてきても不思議ではない」と。根拠はシンプルで、GOLDがマクロ的にという感覚と、という読みです。「万ピプスの下げですか!」と驚かれましたが、翌日以降の動きはその予測をほぼ現実にしました。
実際に下落のきっかけになったのは翌1/30のFRB次期議長の指名報道(タカ派のウォーシュ氏)でした。ただ、「ニュースで動いた」という順序ではありません。相場がプレミアムゾーンで大口の売り準備が整っていたところに、ニュースがトリガーを引いた——状態が先で、きっかけはあとからついてくる。これが正確な解釈です。
そして下落が始まってからの「どこで戻りが止まるか」を決めたのが0.705でした。きっかけが何であれ、本格的な流れはOTEこれがゾーンに従う。
■まとめ:今日の3大ポイント
①Premium (0.5以上) is big-players selling area, Discount (0.5 below) is big-players buying area.OBandFVG
②OTE Zone (0.618〜0.786) is the main entry area for retracements. When the downtrend retrace reaches here, big players seriously increase positions.)
③0.705 is the core level of theOTEzone.This is an ICT-specific number not in standard Fibonacci, but GOLD real-world examples repeatedly confirm it as the place where big players become serious. When OB and/or FVG overlap, reliability peaks.
Next timeMulti-timeframe analysis——
Thank you for continuing to follow!
─────────────────────────
Author profile
─────────────────────────
nao|FX full-time trader for 16 years and EA developer
Specializes in GOLD scalping and day trading based on SMC/ICT.
While trading, I faced a challenge where I could read correctly but my mind would wobble. I developed a hybrid tool “tundere【R】” combining discretionary entries with EA automation.
This provides a system to remove the fear of stop-losses and maximize profits in uptrends for GOLD traders.
▶ Details of tundere【R】 here
https://www.gogojungle.co.jp/tools/indicators/71019?via=toppage_recentViewed