

Gold Analysis 2026/03/13
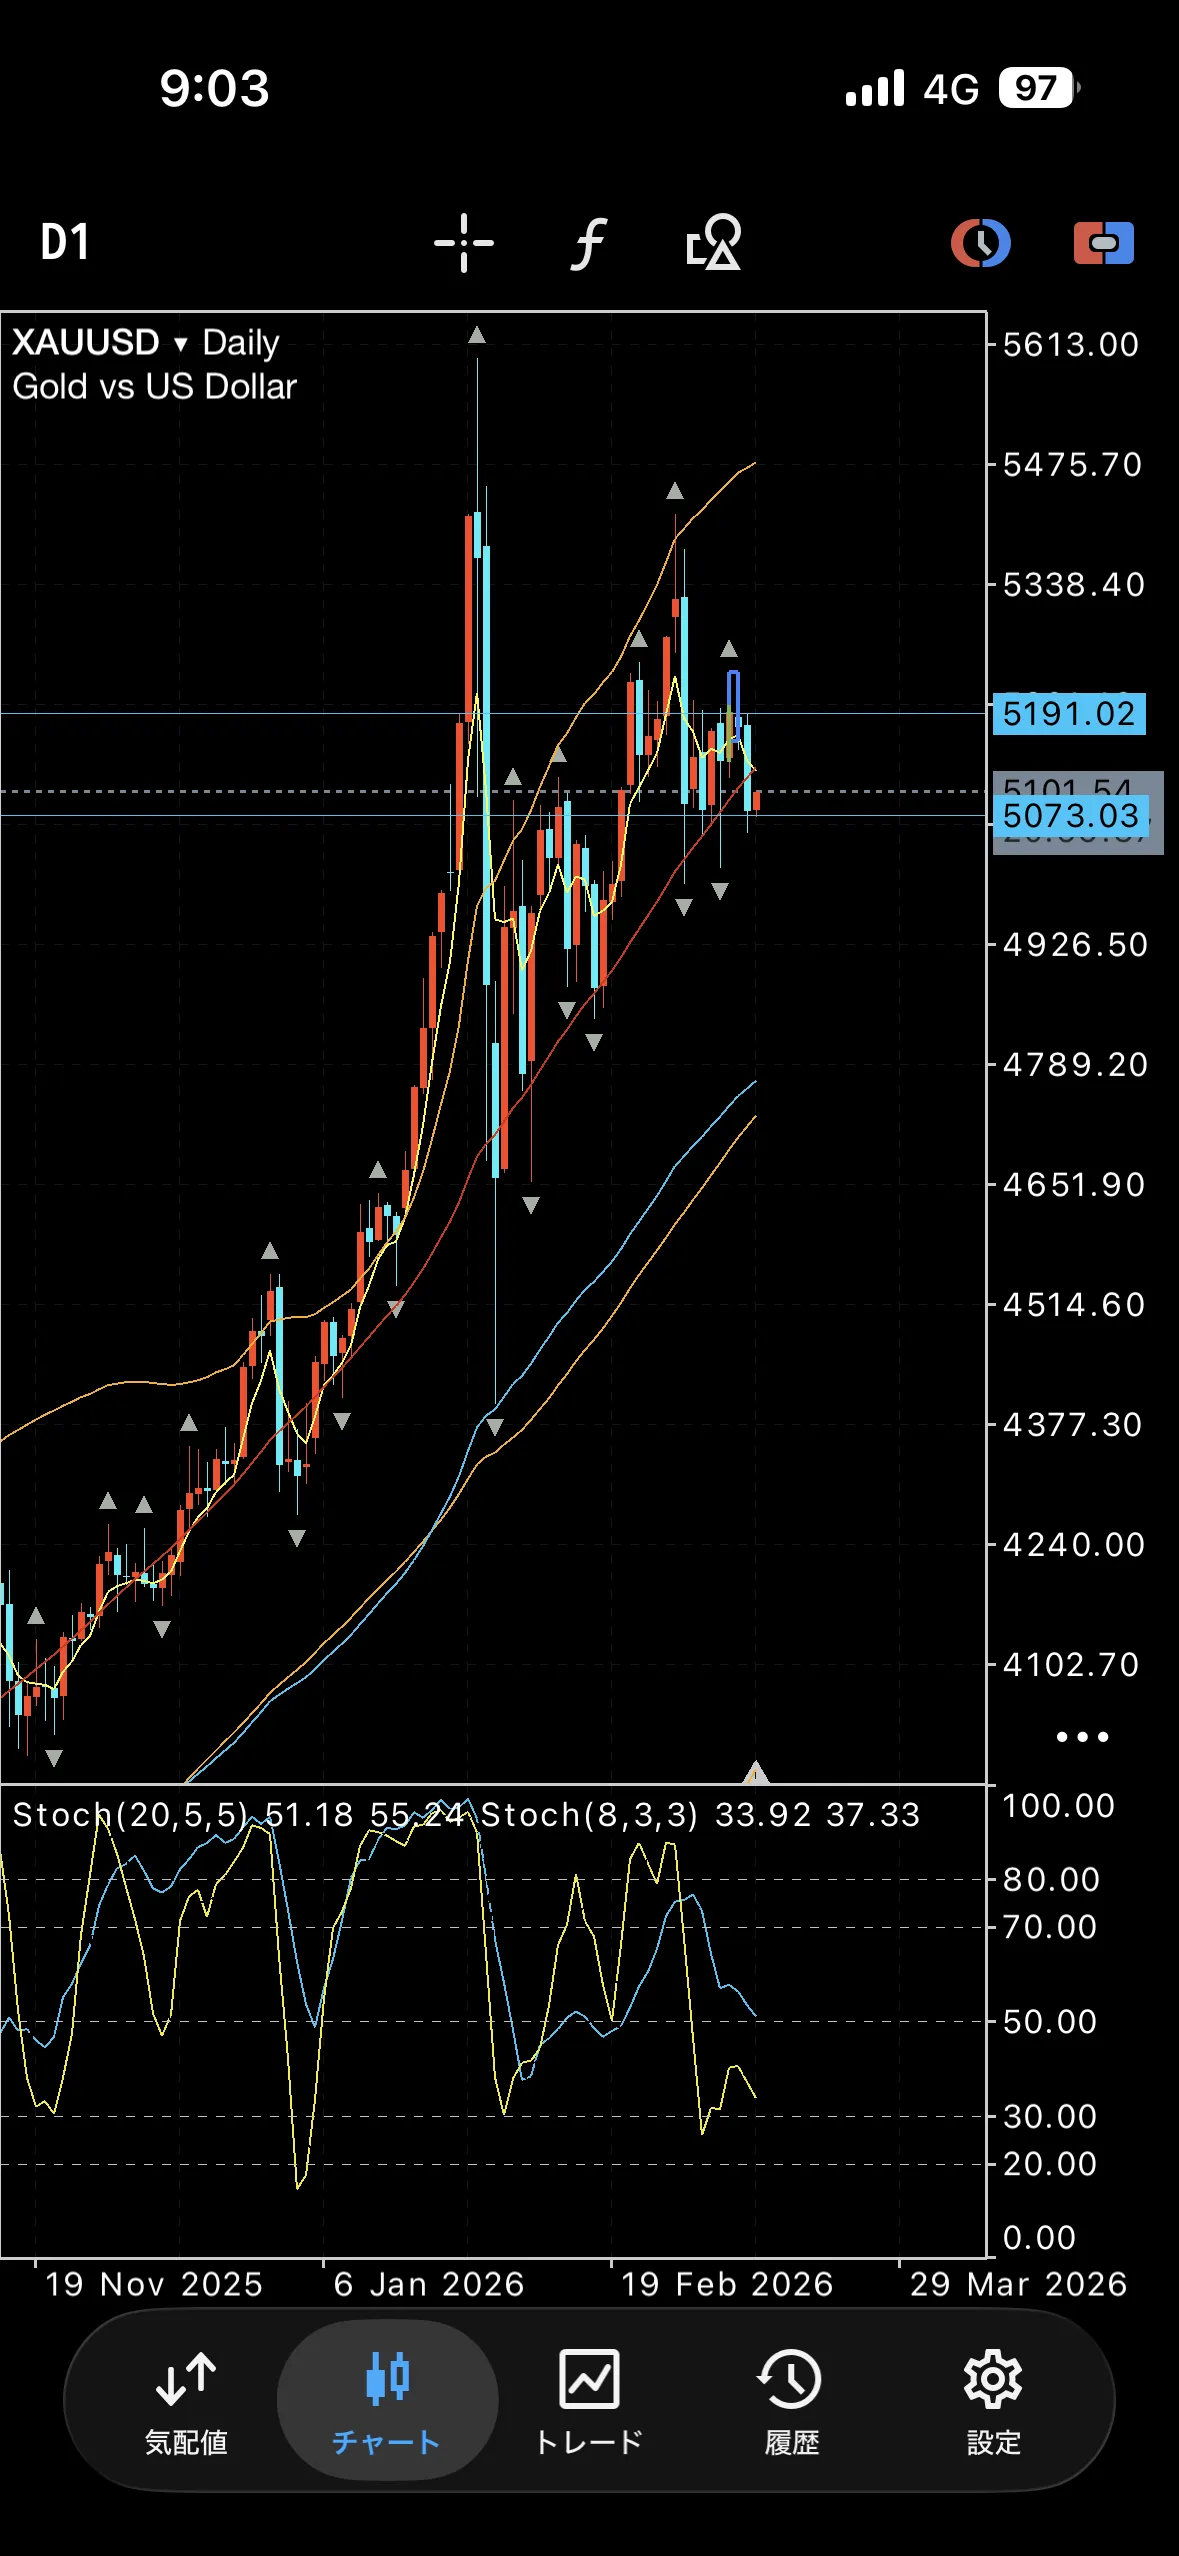
【Yesterday's daily chart】
A bearish candle that breaks below the 5MA
【Daily Oscillator】
Long-term center
Short-term hidden
【Outlook】
Bearish while not closing above around 5180
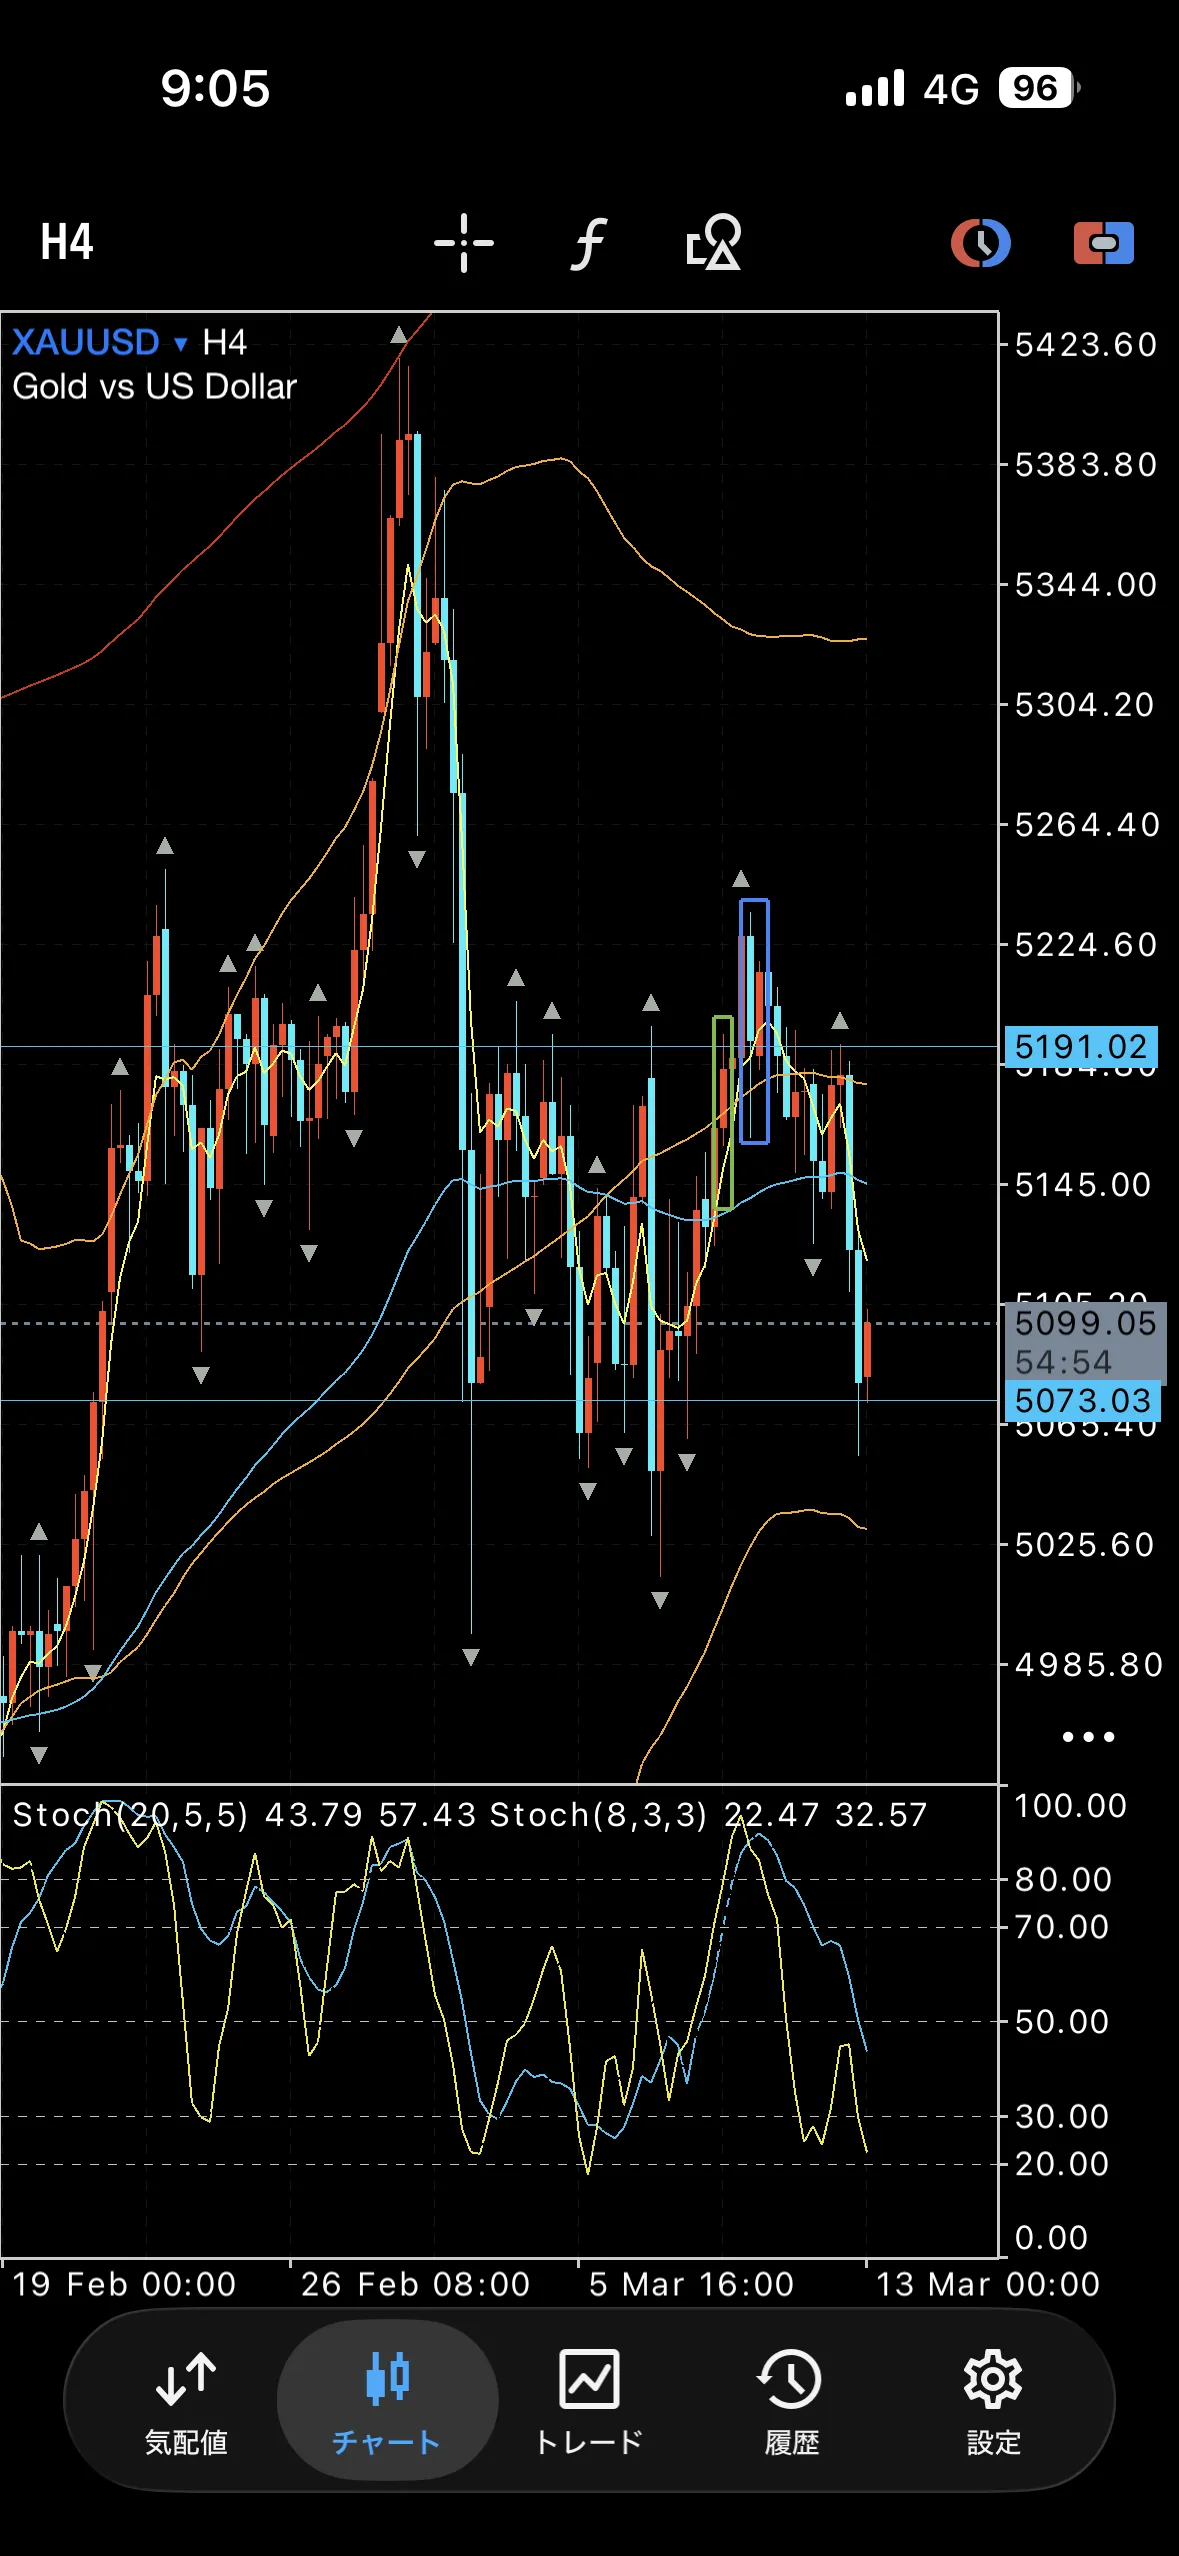
【4-hour chart】
Range
This morning is rebounding at the third lower point
【Indicators to watch】
Bollinger Bands -2σ
【Outlook】
Currently in a range
As the weekly close is approaching, movement is expected to swing up and down depending on whether it breaks the lower bound or pauses
【Other regularly patterned indicators / short-term notes】
The decline started from the 4-hour 75, so watch price action anchored there
However, since this is a 4-hour chart, there is a possibility this moves into next week
【Important horizontal support/resistance lines (all around these zones)】
5063–5073
5126–5138
5180–5191
× ![]()