

Gold Analysis 2026/03/12
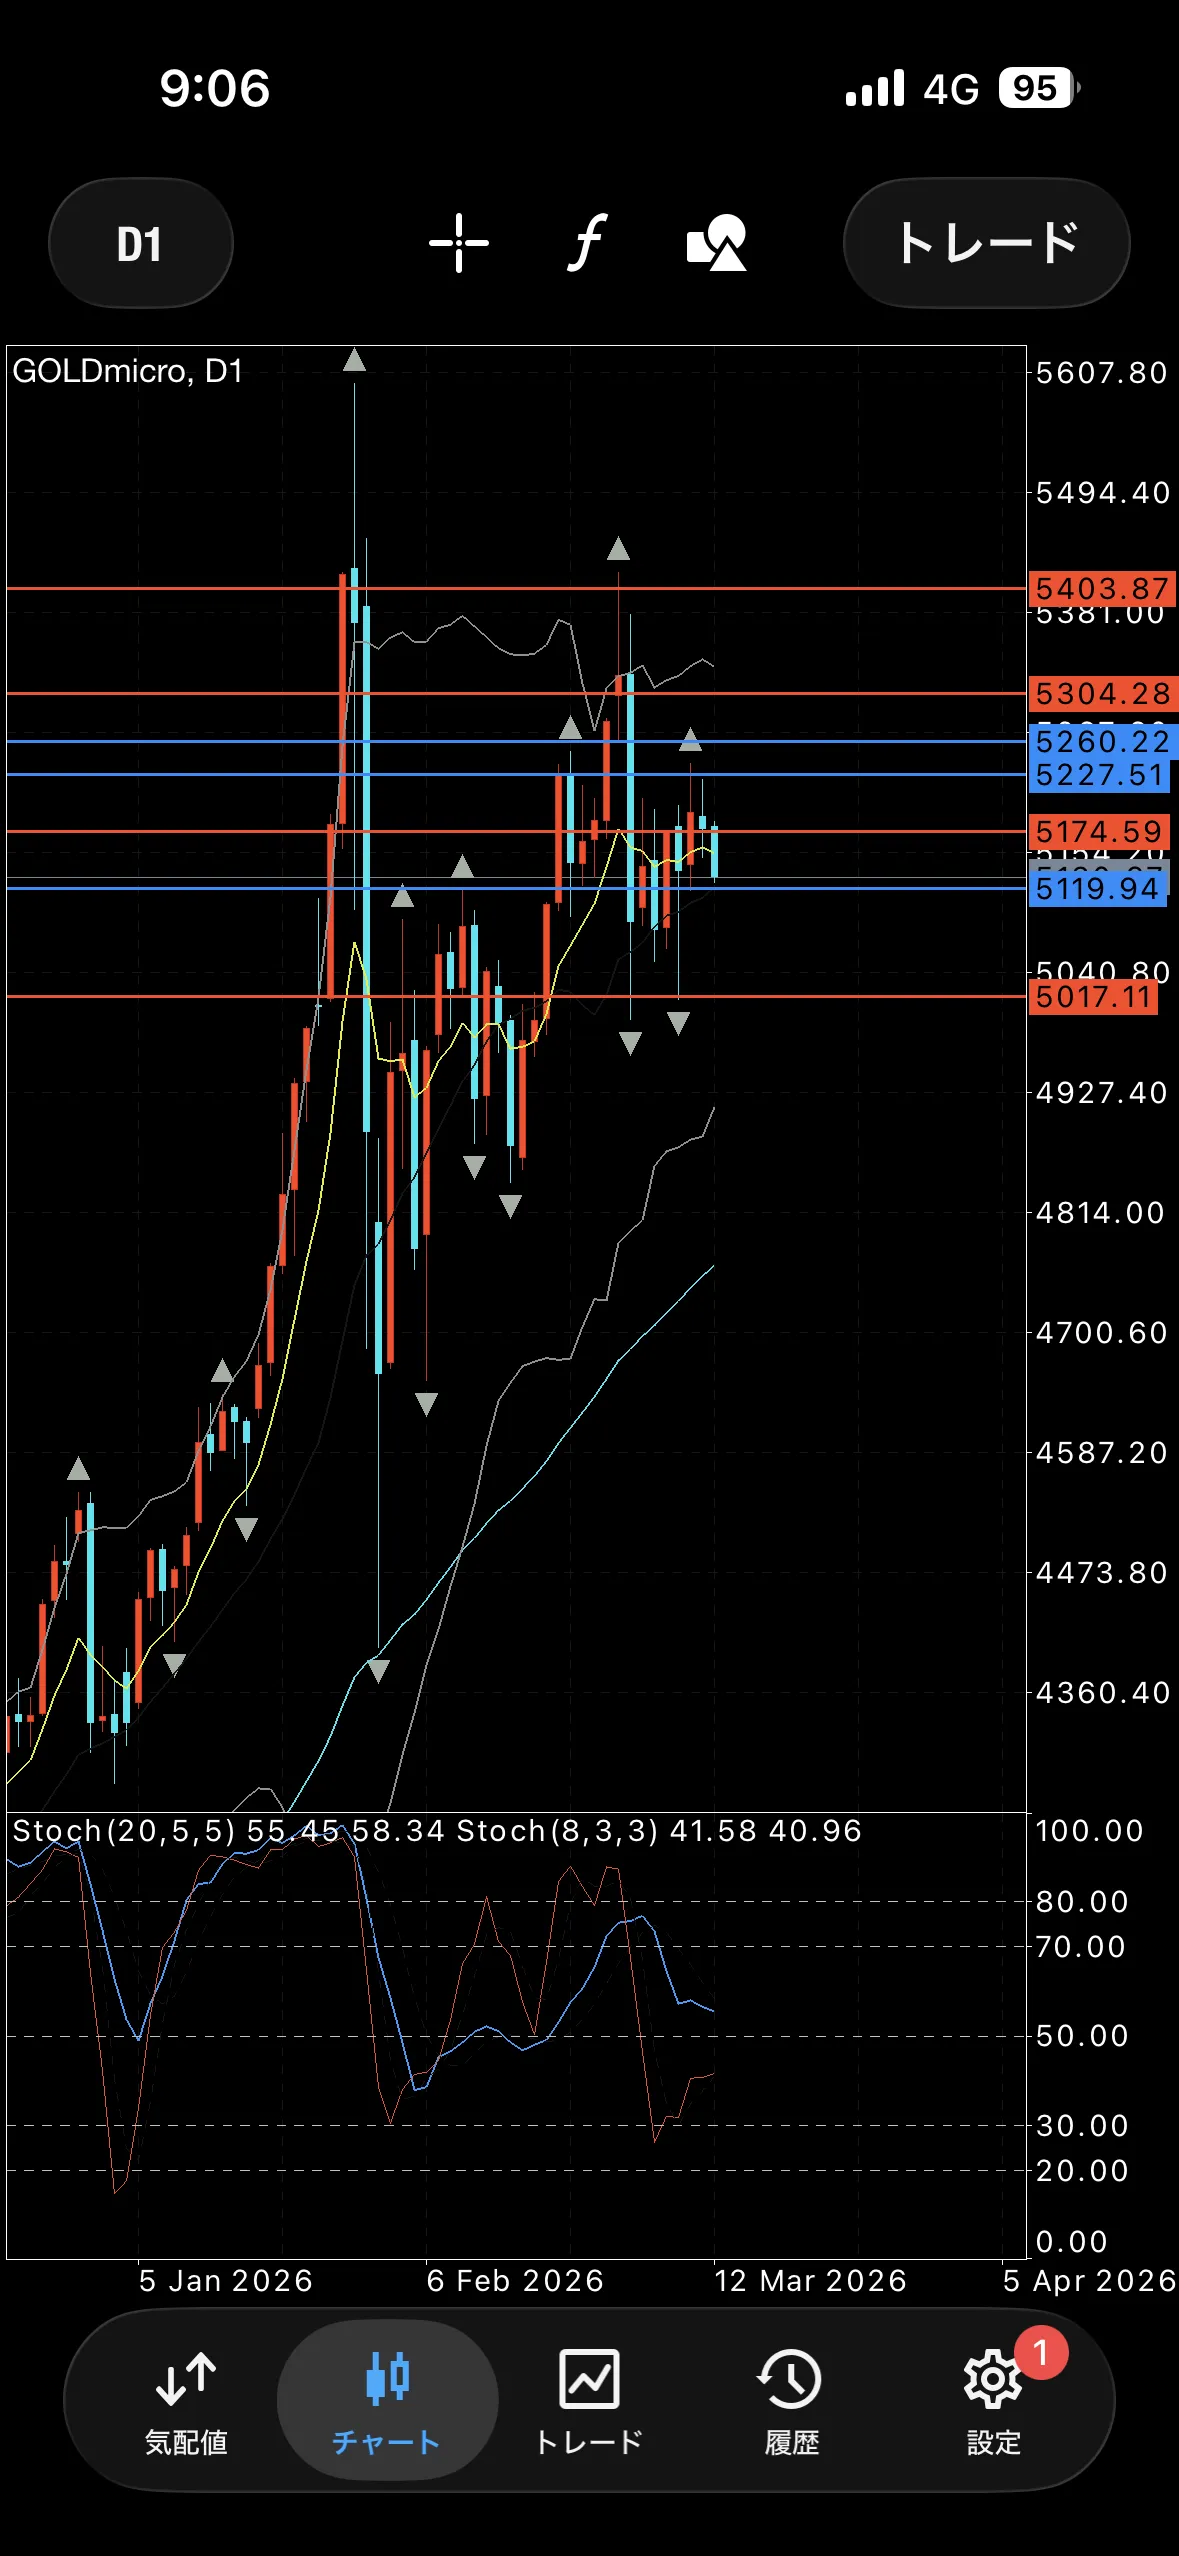
【Yesterday's daily chart】
Bearish candle
【Daily Oscillator】
Long-term up
Short-term hidden
【Perspective】
Up
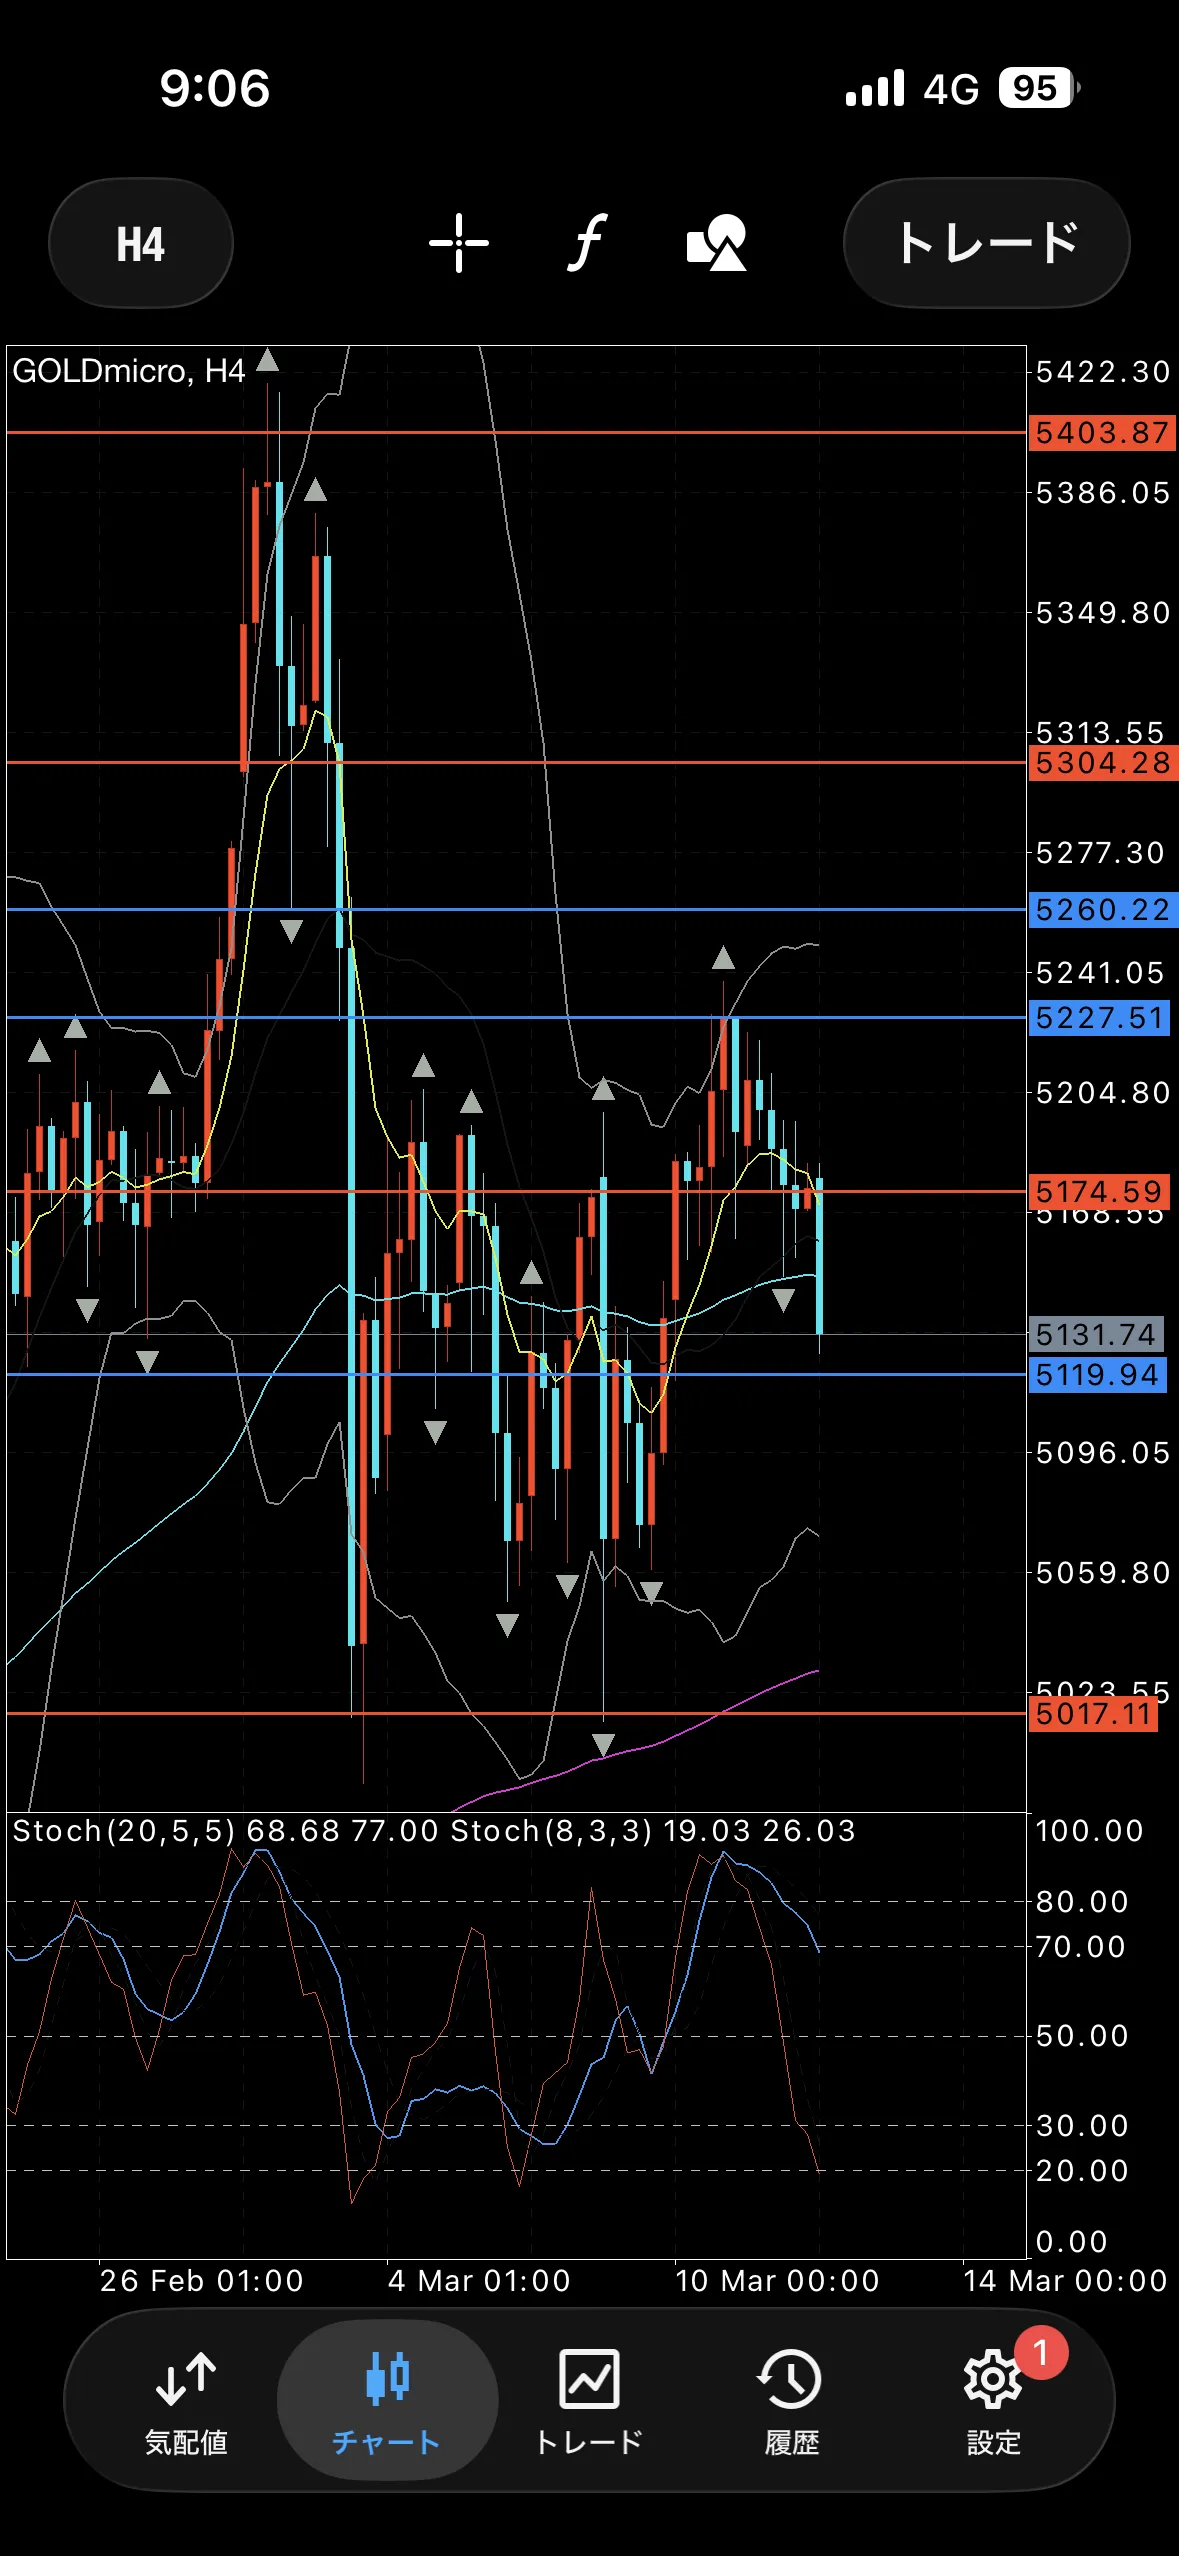
【4-hour chart】
From the right shoulder of the head-and-shoulders pattern, unable to break above the 5227 bearish candle; second bearish candle outside
This morning, almost at the center of the range
Due to the 75MA being parallel, there is a strong impression that it could fall sharply.
【Indicators being watched】
Bollinger Bands -2σ and 200 EMA
【Perspective】
Range
【Other short-term notes】
1-hour chart shows a downside bias due to breaking below 75/200MA
Will monitor the 30-minute 75MA level that became the origin of the decline, or the 15-minute 75MA touch where a pattern emerged during the drop
【Important horizontal support/resistance lines (all in the nearby zones)】
5227 ~ 5660
5120
5068
5017