

[Method] The "Valley-simple Own Trading Method" of Heaven and Earth — tested against the latest market conditions (Part 2)
【Method】Verifying Heaven and Earth’s “Valley Simple Independent Trading Method” on the Latest Market, Part II
This is Shirou!
Following the previous article,
we will continue the verification of Heaven and Earth’s Valley trading simple independent method on the latest market.
The previous article ishere
【Method】Heaven and Earth’s “Valley Simple Independent Trading Method”
Regarding the method,
it is a simple approach that trades at the current valley (1-hour chart) against the upper frame’s peak (4-hour chart).
An illustrative diagram
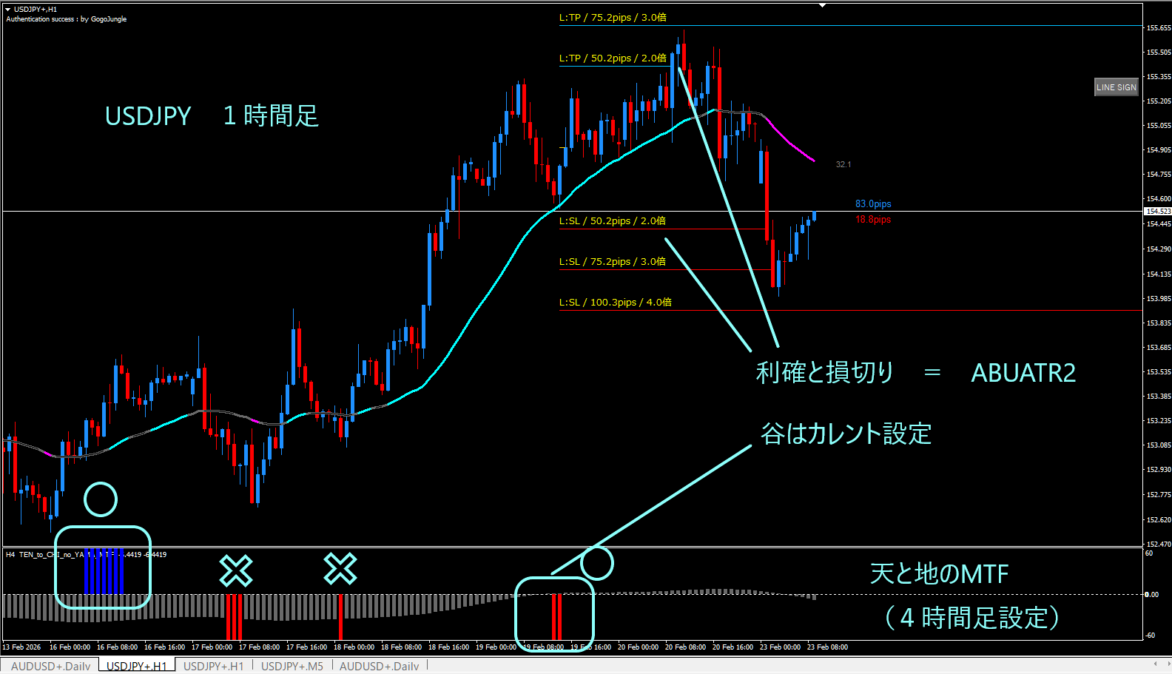
For take-profit and stop-loss, ABUATR2 is used.
【Method】Verifying Heaven and Earth’s “Valley Simple Independent Trading Method” on the Latest Market ②
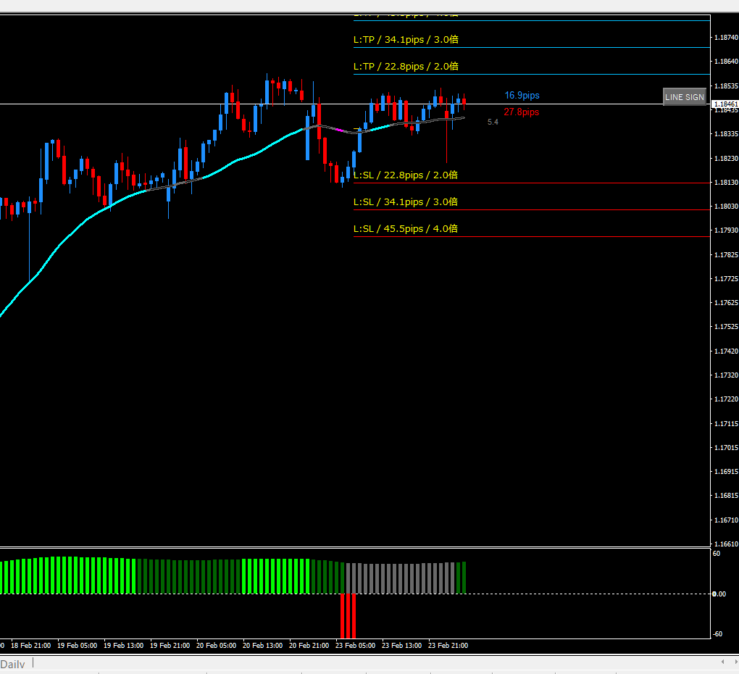
GBPAUD 〇
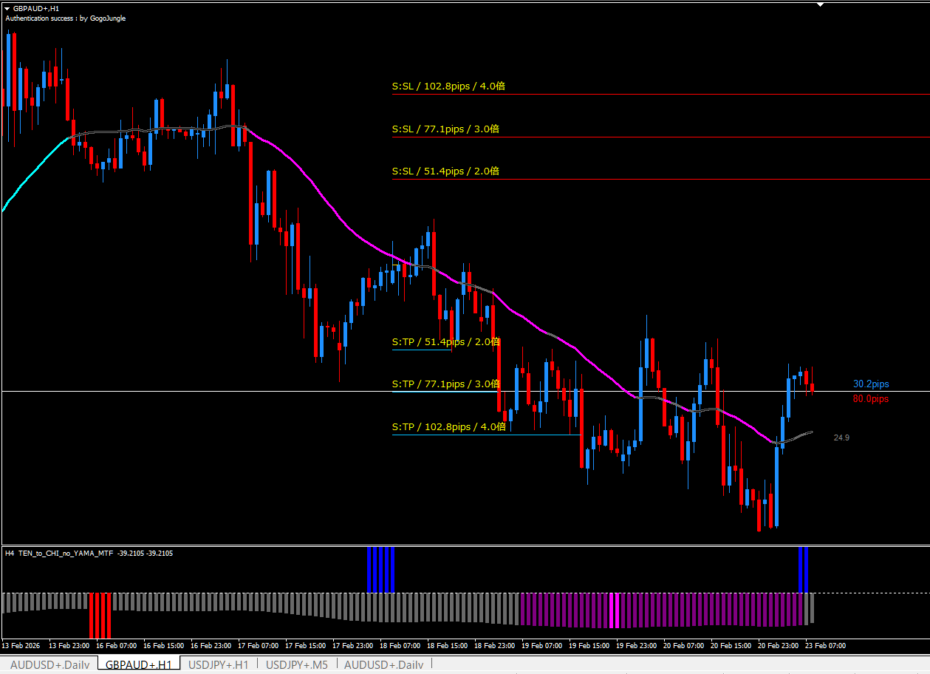
Current valley when upper-frame peaks are increasing.
The edge is high.
It’s neatly captured.
EURUSD ×
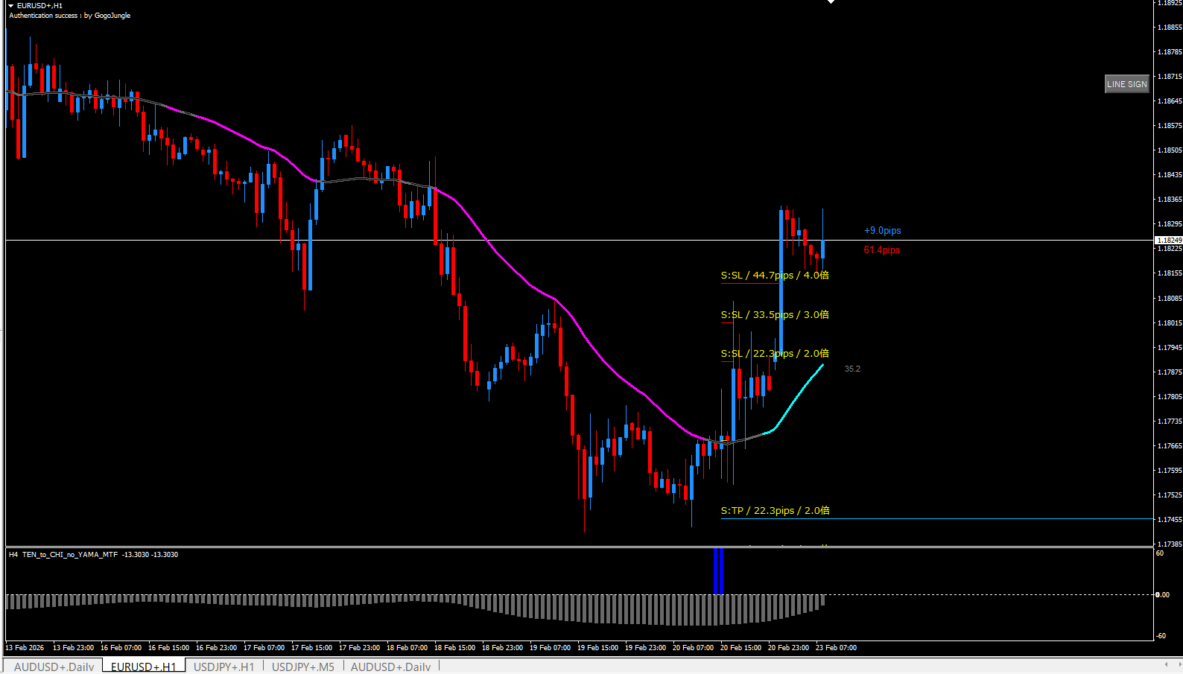
It hit stop-loss.
Because it was traded according to the rules, this is correct as a trading method.
EURJPY × 〇
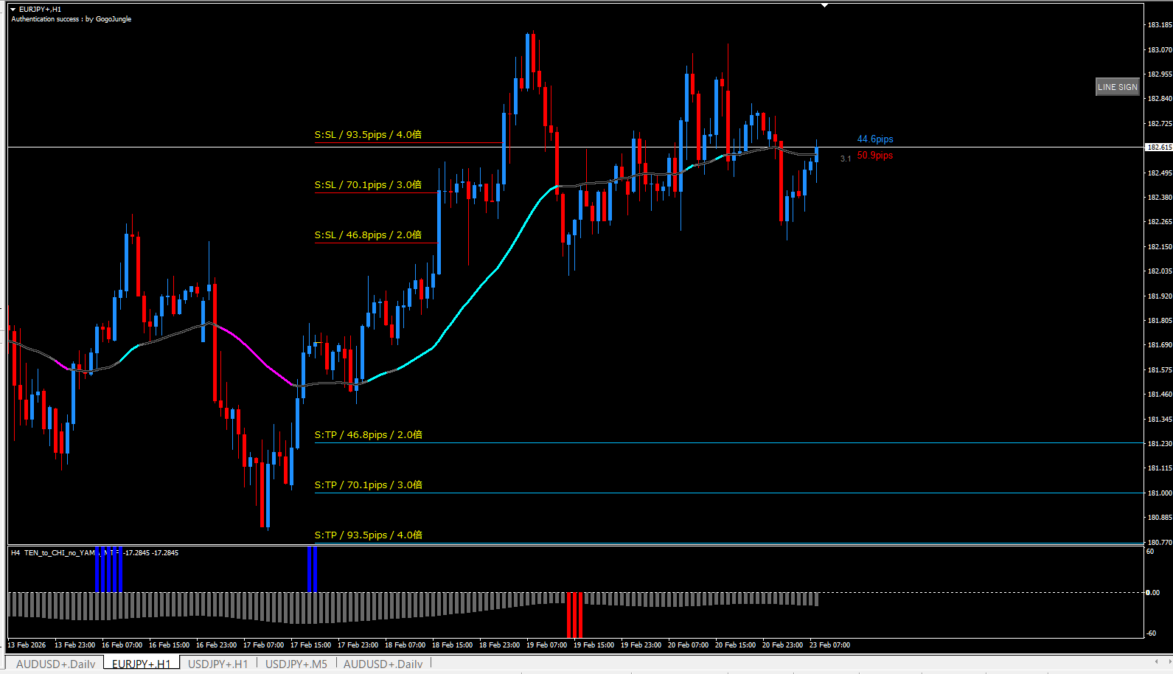
EURJPY. This also hit stop-loss.
From the look, it wasn’t a peak of the mountain, so the entry timing wasn’t bad, and it was a correct trade.
One more thing.
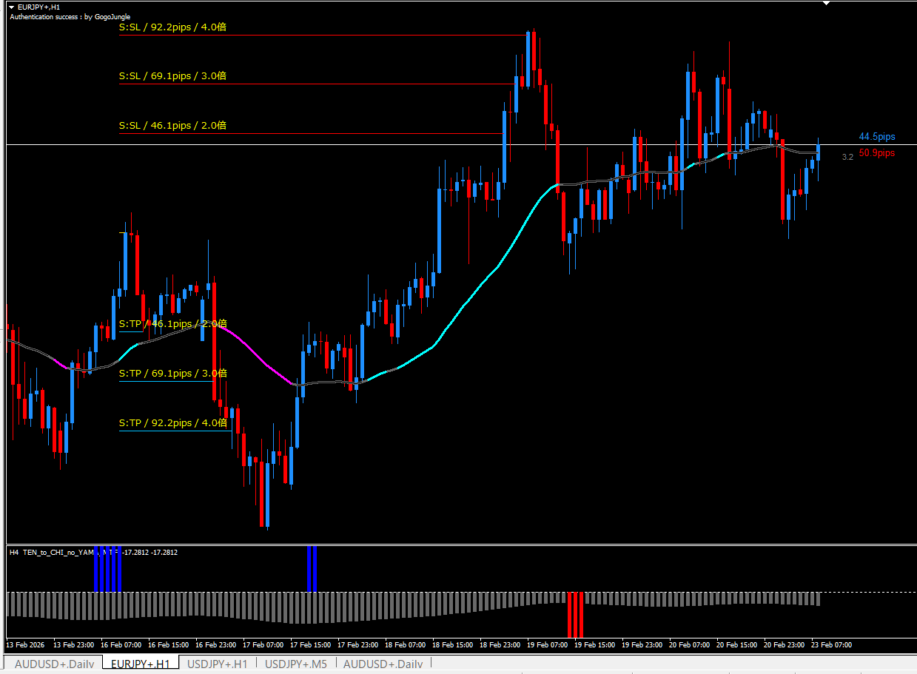
This one is neatly captured.
When there is this many peaks, there is a sense of security.
- EURNZD 〇
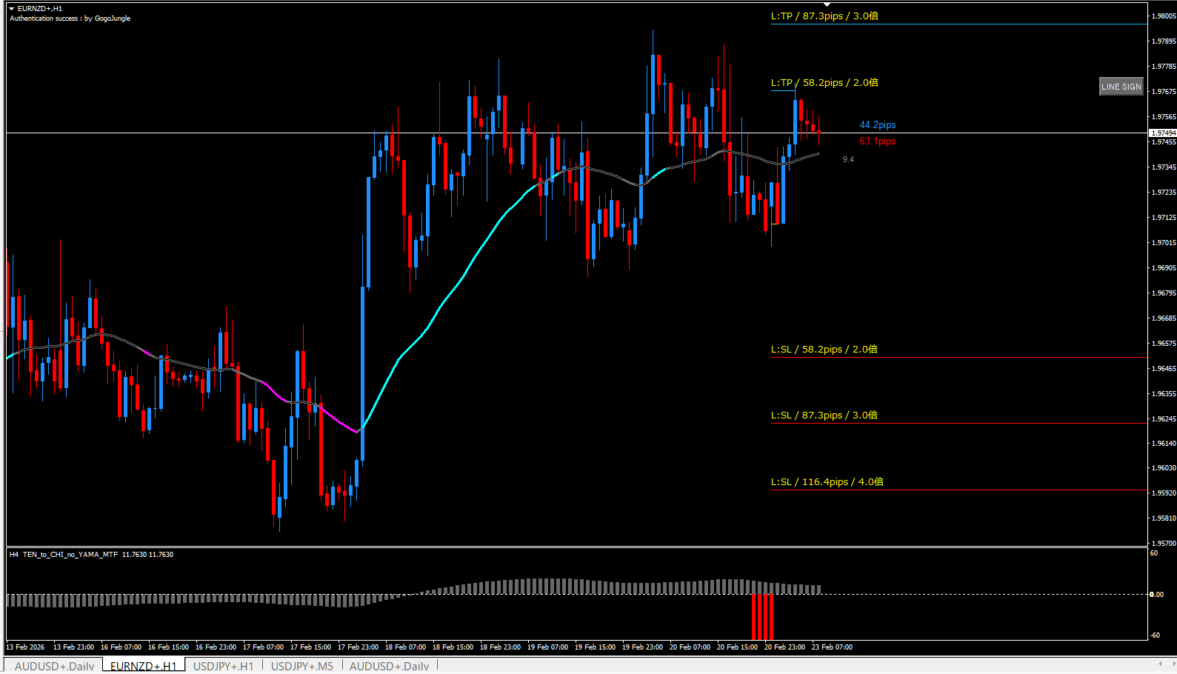
A buy point on the first pullback after the zero-line cross of the 4-hour peak.
This is also nicely captured.
However, overall, the 4-hour chart appears to be range-bound, so I don’t expect the profit margin to extend muchABUATR2 is at its limitor so I think.
EURGBP 〇
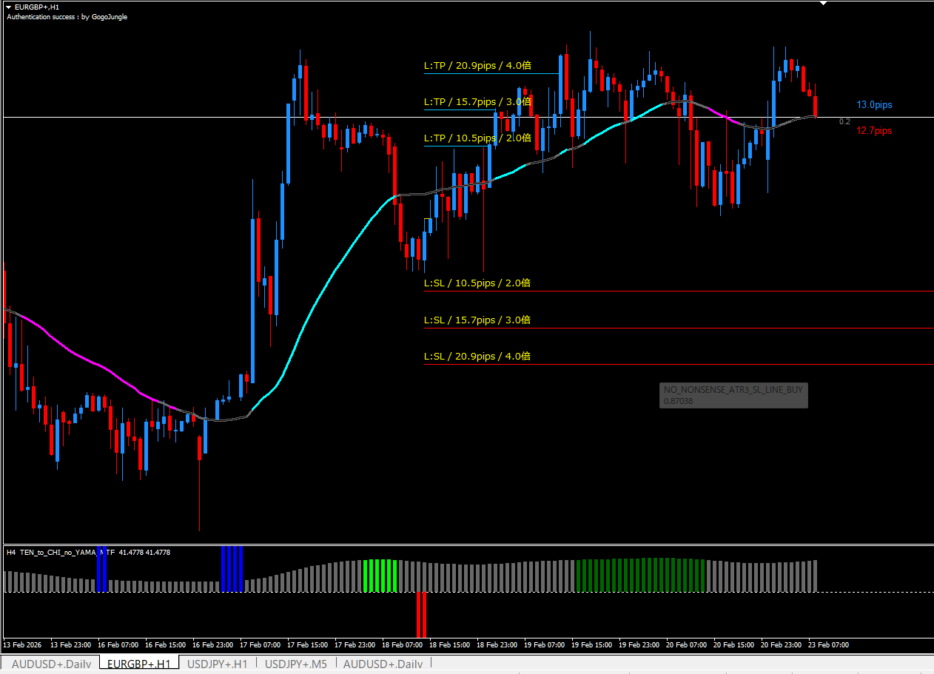
It has captured some, buta dangerous pointexists as well.
On the 4-hour chartpeak, this isoverbought max
meaning it could reverse.
EURCHF ×
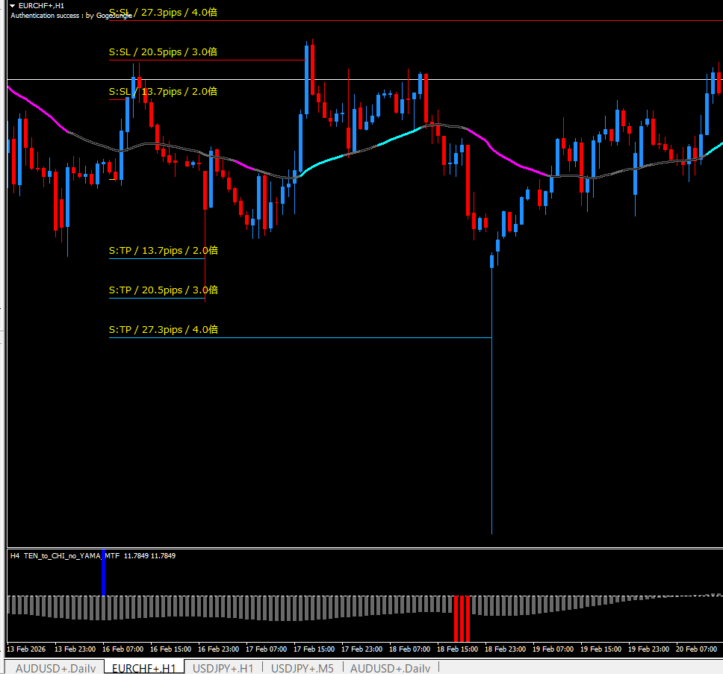
Entry condition is correct, but it’s being hunted.
As a method, it’s correct.
EURCHF 〇

Right at the point where the 4-hour chart is about to perform a zero-line cross.
If the valley appears a little later, it would be a perfect point and the profit would extend, but even here it isn’t bad.
EURAUD 〇
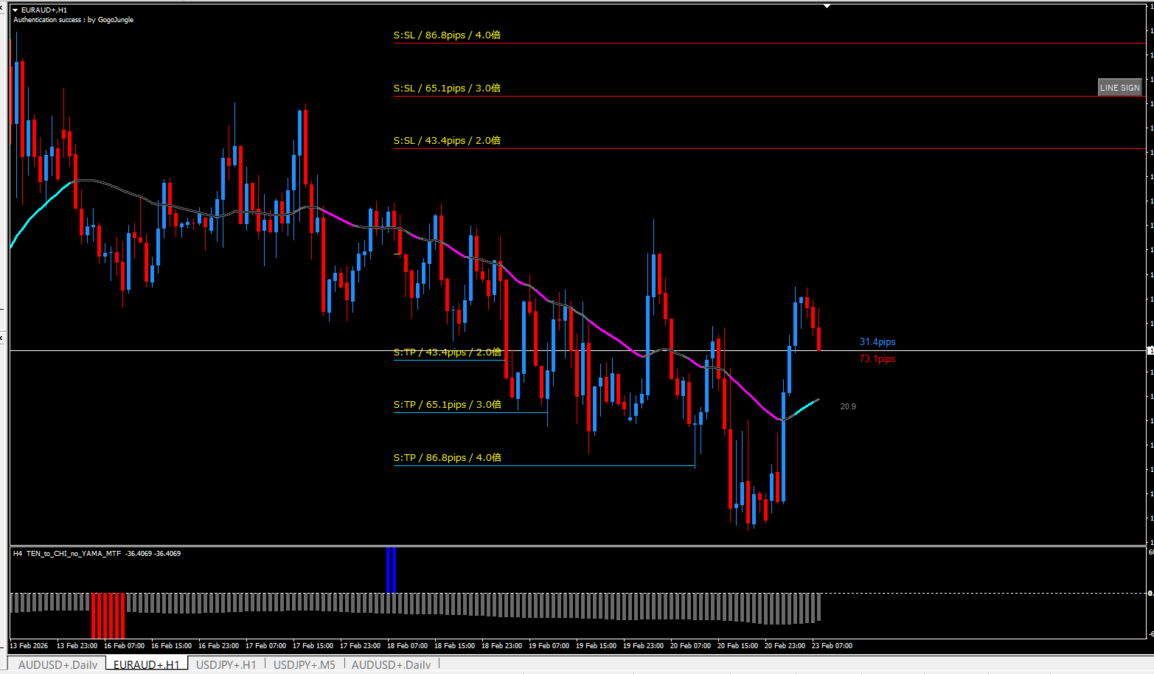
Current valley when peaks have increased a little. Favorable condition.
CHFJPY × 〇
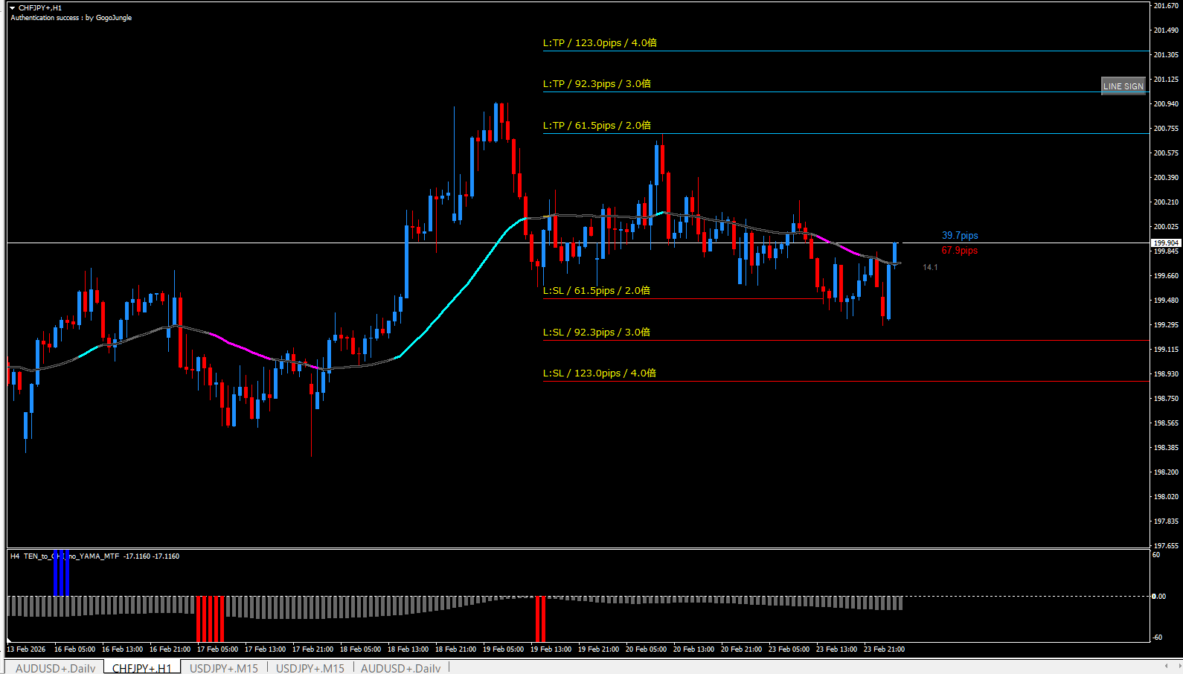
The peak on the mountain remains barely, but it looks ready for a zero-line cross.
After a zero-line cross, the edge is high, but if it stays in a downtrend without crossing, it’s a stop-loss.
After all, it’s desirable to target this valley when there is an upward peak.
One more.
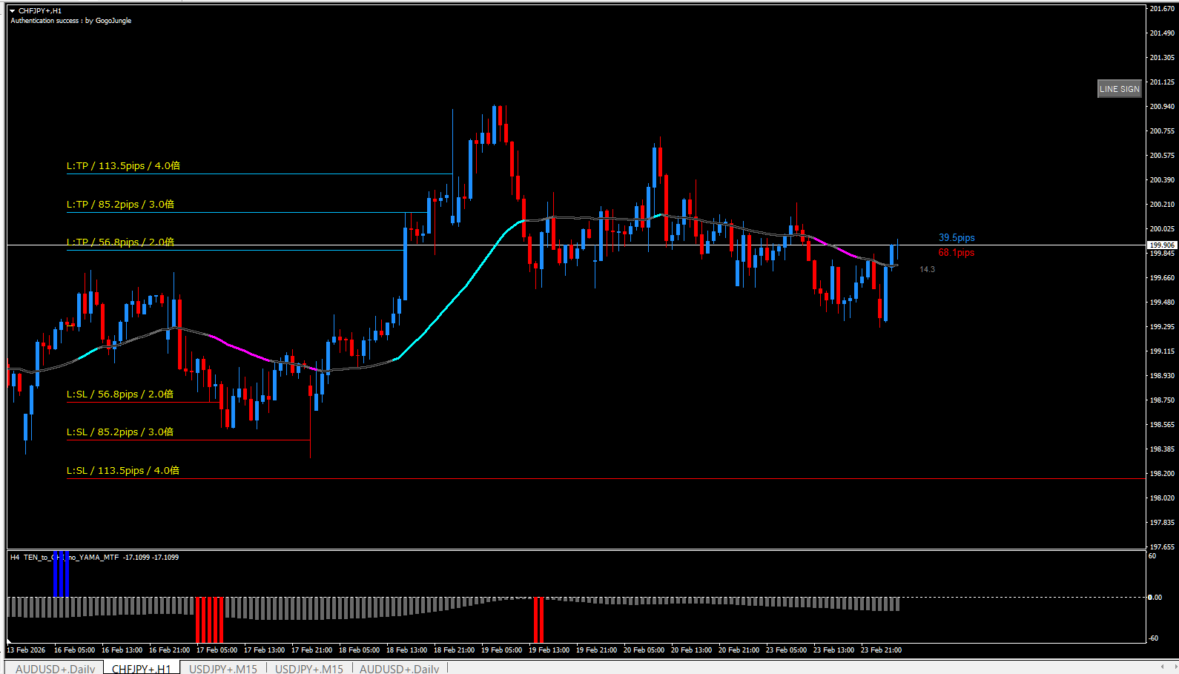
Entry conditions are correct. It’s a pullback selling point.
TP/SL were reversed, sorry.
CADJPY 〇
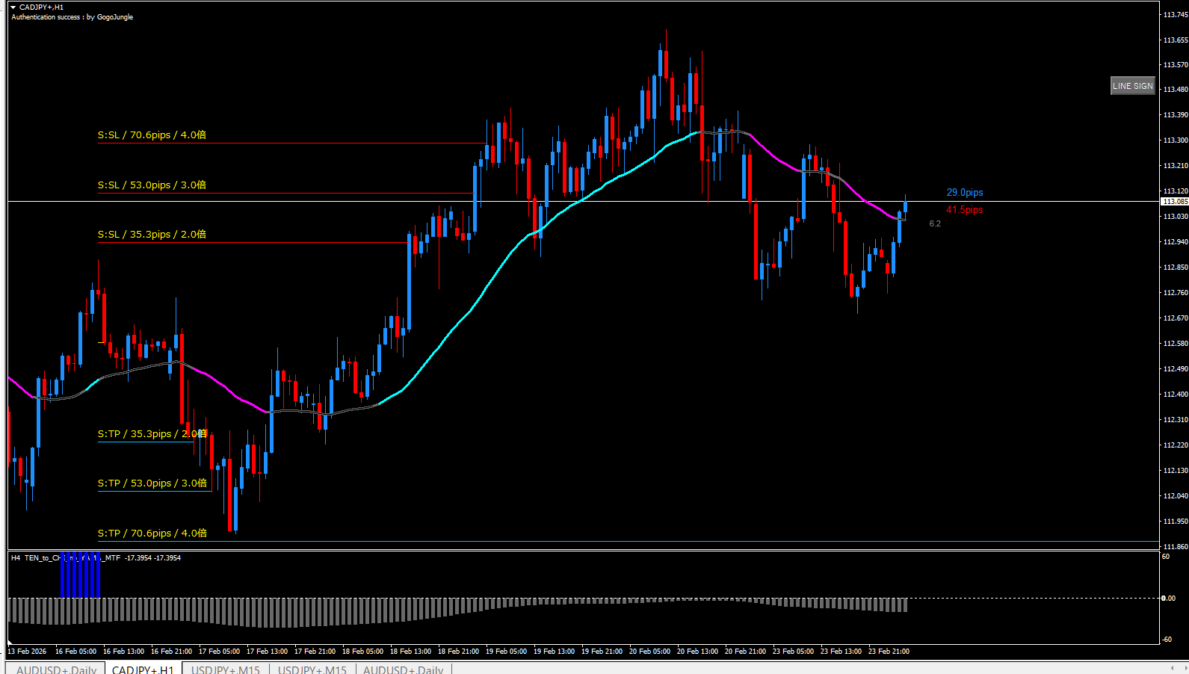
This also captures nicely.
If there is this much peak remaining, you’d like to extend profit to ABUATR3.
For example
- Enter twice
- One takes profit at ABUATR2
- The other moves to break-even
- Extend to ABUATR3
I think this is a good approach.
CADCHF × 〇
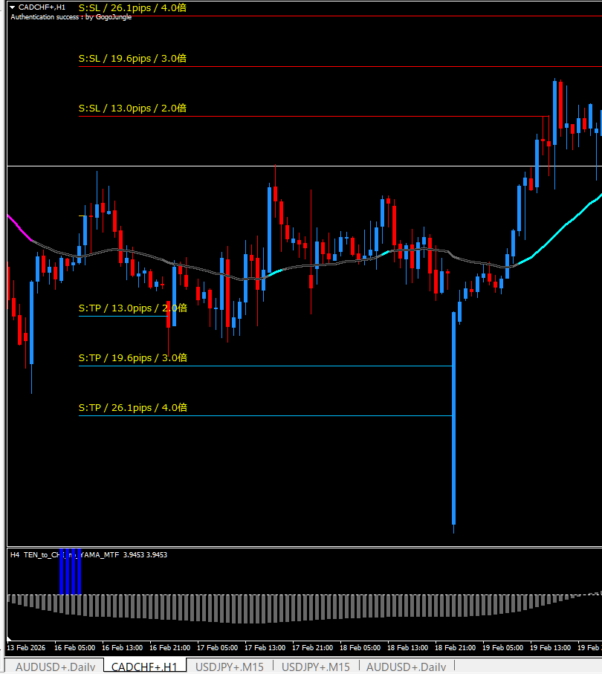
In the image, it seems like take-profit was achieved, but this is probably due to a weekend gap opening turned closing at the start of the week.
More likely, it was a stop-out.
Another thing.
Yesterday’s point. The valley was confirmed at 15:00.
A valley after a zero-line cross has high edge.
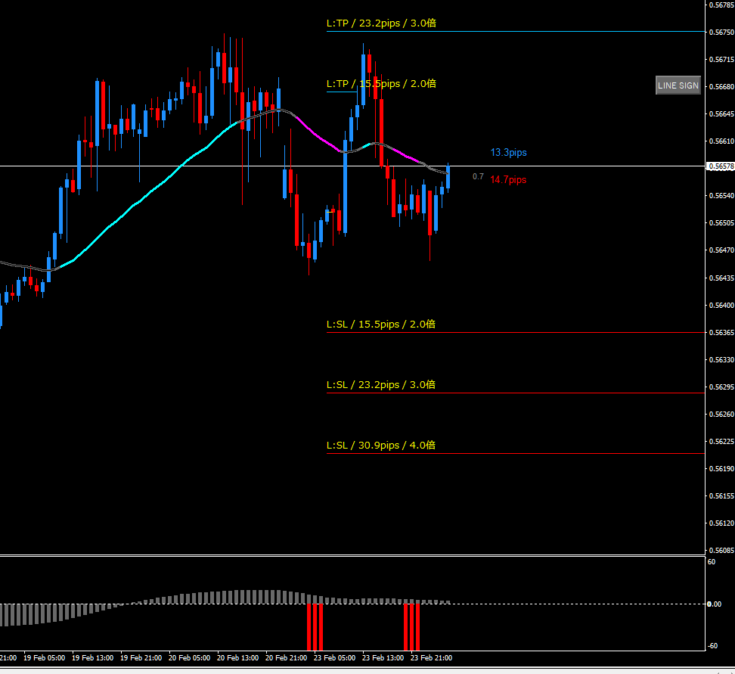
Note.

The valley at far right, this one, is
as the peaks are fading,it’s hard to call it a pullback buying point
It’s okay to enter, but smaller lot or take profits earlier is better.
If it were me, I wouldn’t enter.
AUDNZD Caution Point
Peak is overbought max, the peak.
A timing that seems to end that, i.e., a zone prone to decline.
There is a 4-hour peak and 1-hour valley, so it is a pullback buying point, but be wary when at the peak or near end of peak.
As you can see,
there is a tendency for a big SL hunt once (red whisker).
AUDUSD × ×
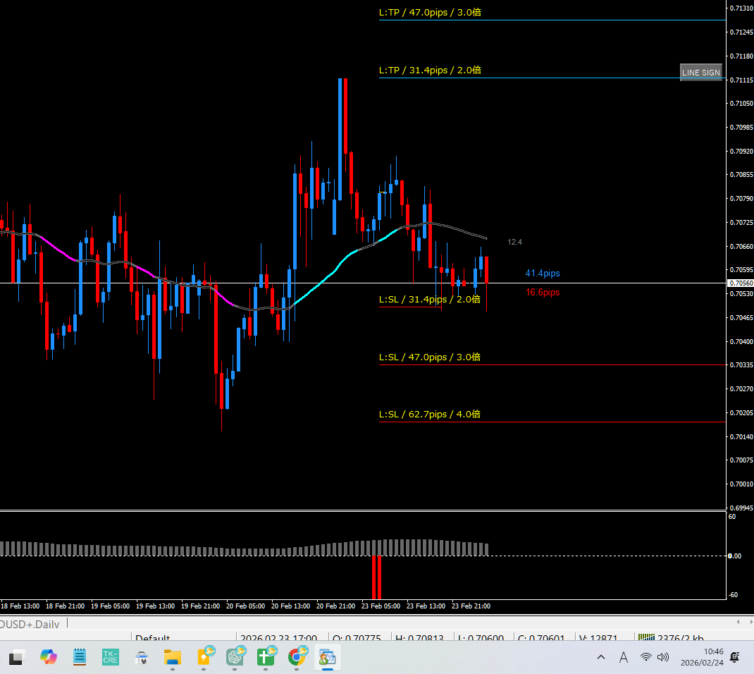
Since the valley occurs when the peak is rising, edge is high, but it was hunted.
The trading method itself isn’t bad, so it’s a correct trade.
This entry condition isn’t bad either.
After a range-like movement, it resulted in a stop-loss.
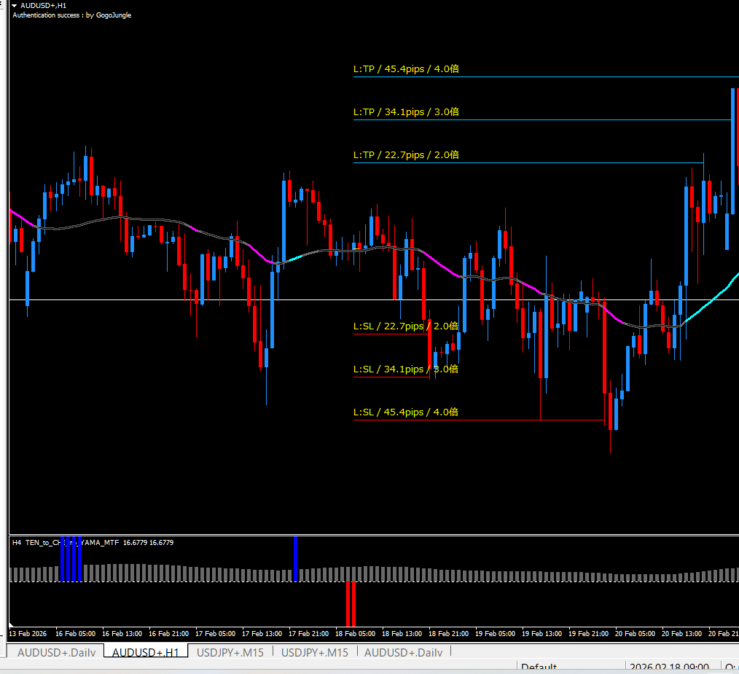
AUDJPY 〇
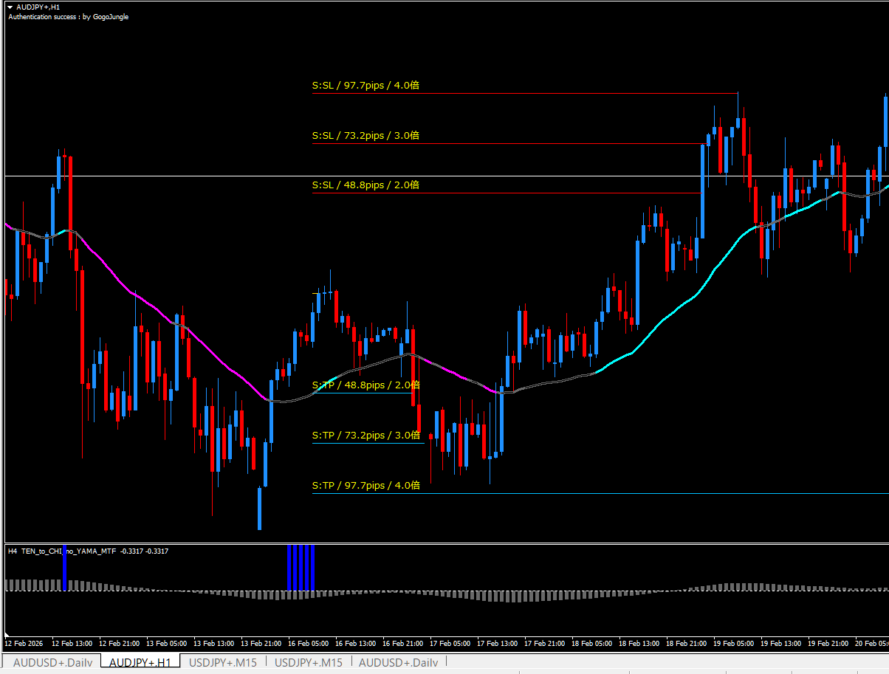
The first current valley after the 4-hour chart zero-line cross.
Edge is high.
Very clean for a return-selling.
AUDCHF TPSL not reached
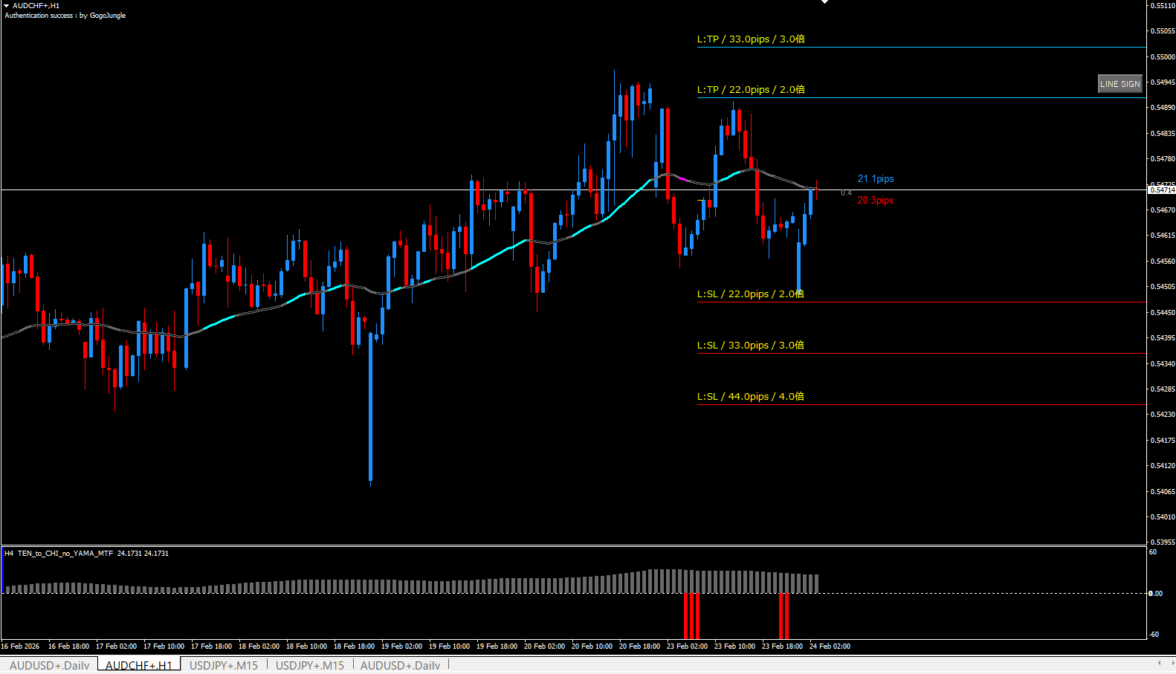
TPSL has not reached yet, but I’ll still note it.
When there is a solid valley, edge is high.
However, it fell before reaching ABUATR2’s TP.
Since the valley has appeared again, it should rise again.
AUDCAD TPSL not reached

This is also a current valley when there is a solid remaining peak.
Neither side has reached yet, but the entry condition is correct.
Data and Summary
Data are as follows.
- 28 currency pairs
- Wins 21
- Losses 12
- Win rate 64%
Since this is based only on the most recent market, it’s a rough data set, but I think it’s reasonably good.
If you also consider periods with fewer peaks or the peak and end of peaks, the win rate may rise a bit more.
Also, applying multiple entries is one possible approach.