

Translate the below html to English, keep format html, the result is not in markdown code and not break line, convert standard decode before translate: 2026/03/11ゴールド分析
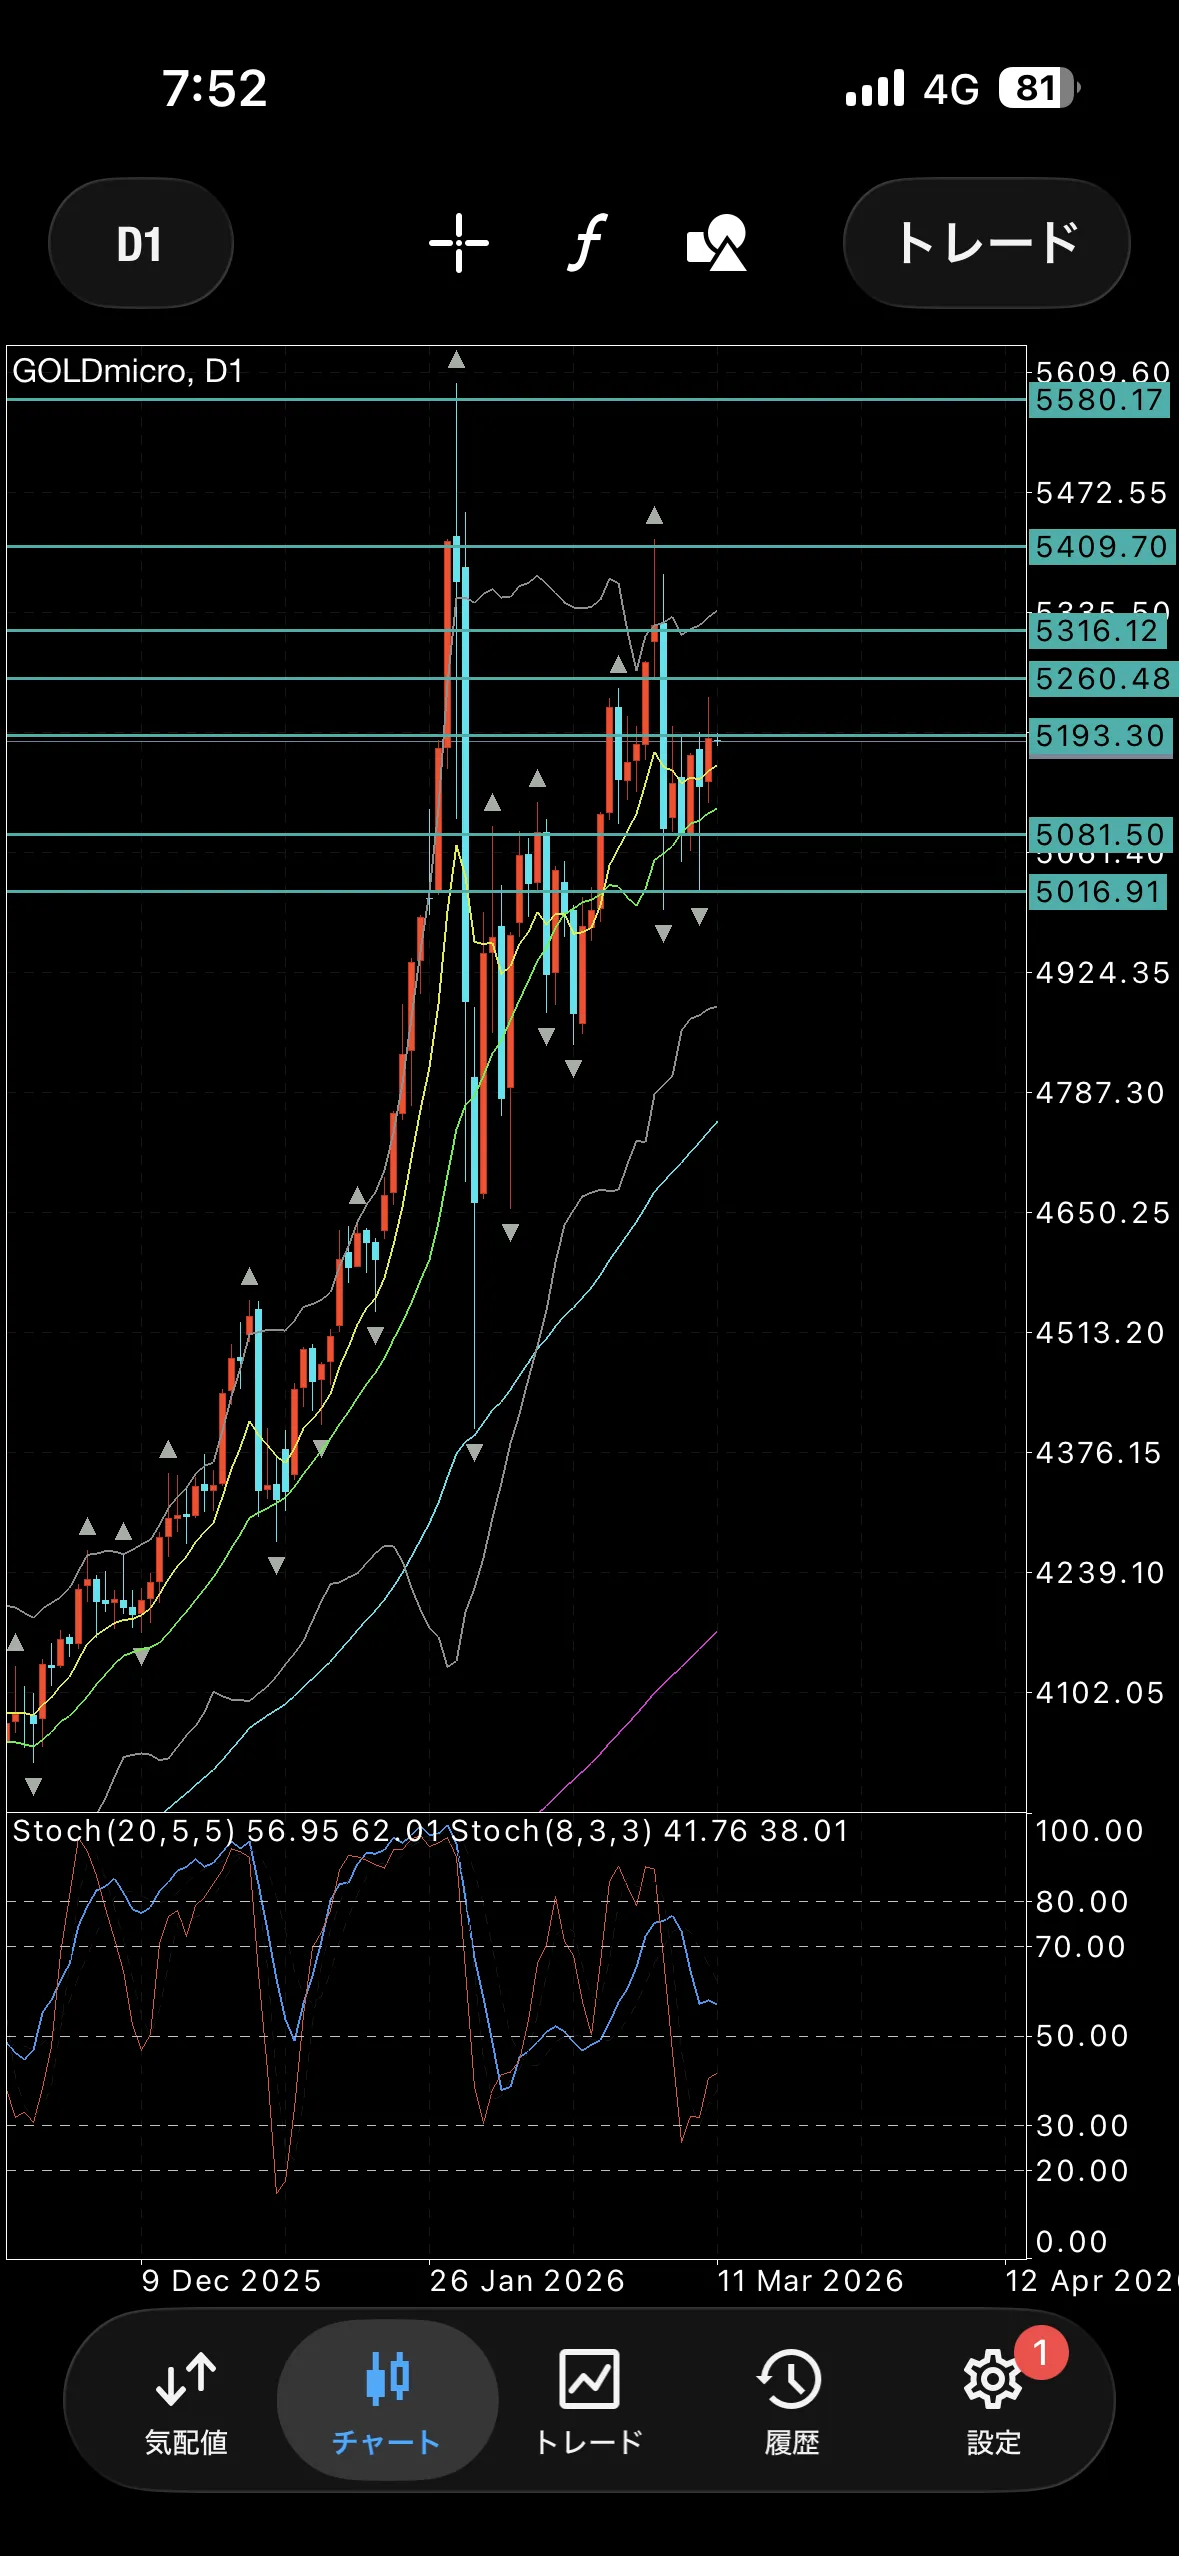
Daily chart: bullish candle.
Because it is a reversal that surpasses the previous day's bearish candle's starting point, buying is strong.
First, it seems the range upper limit around 5316 is the target.
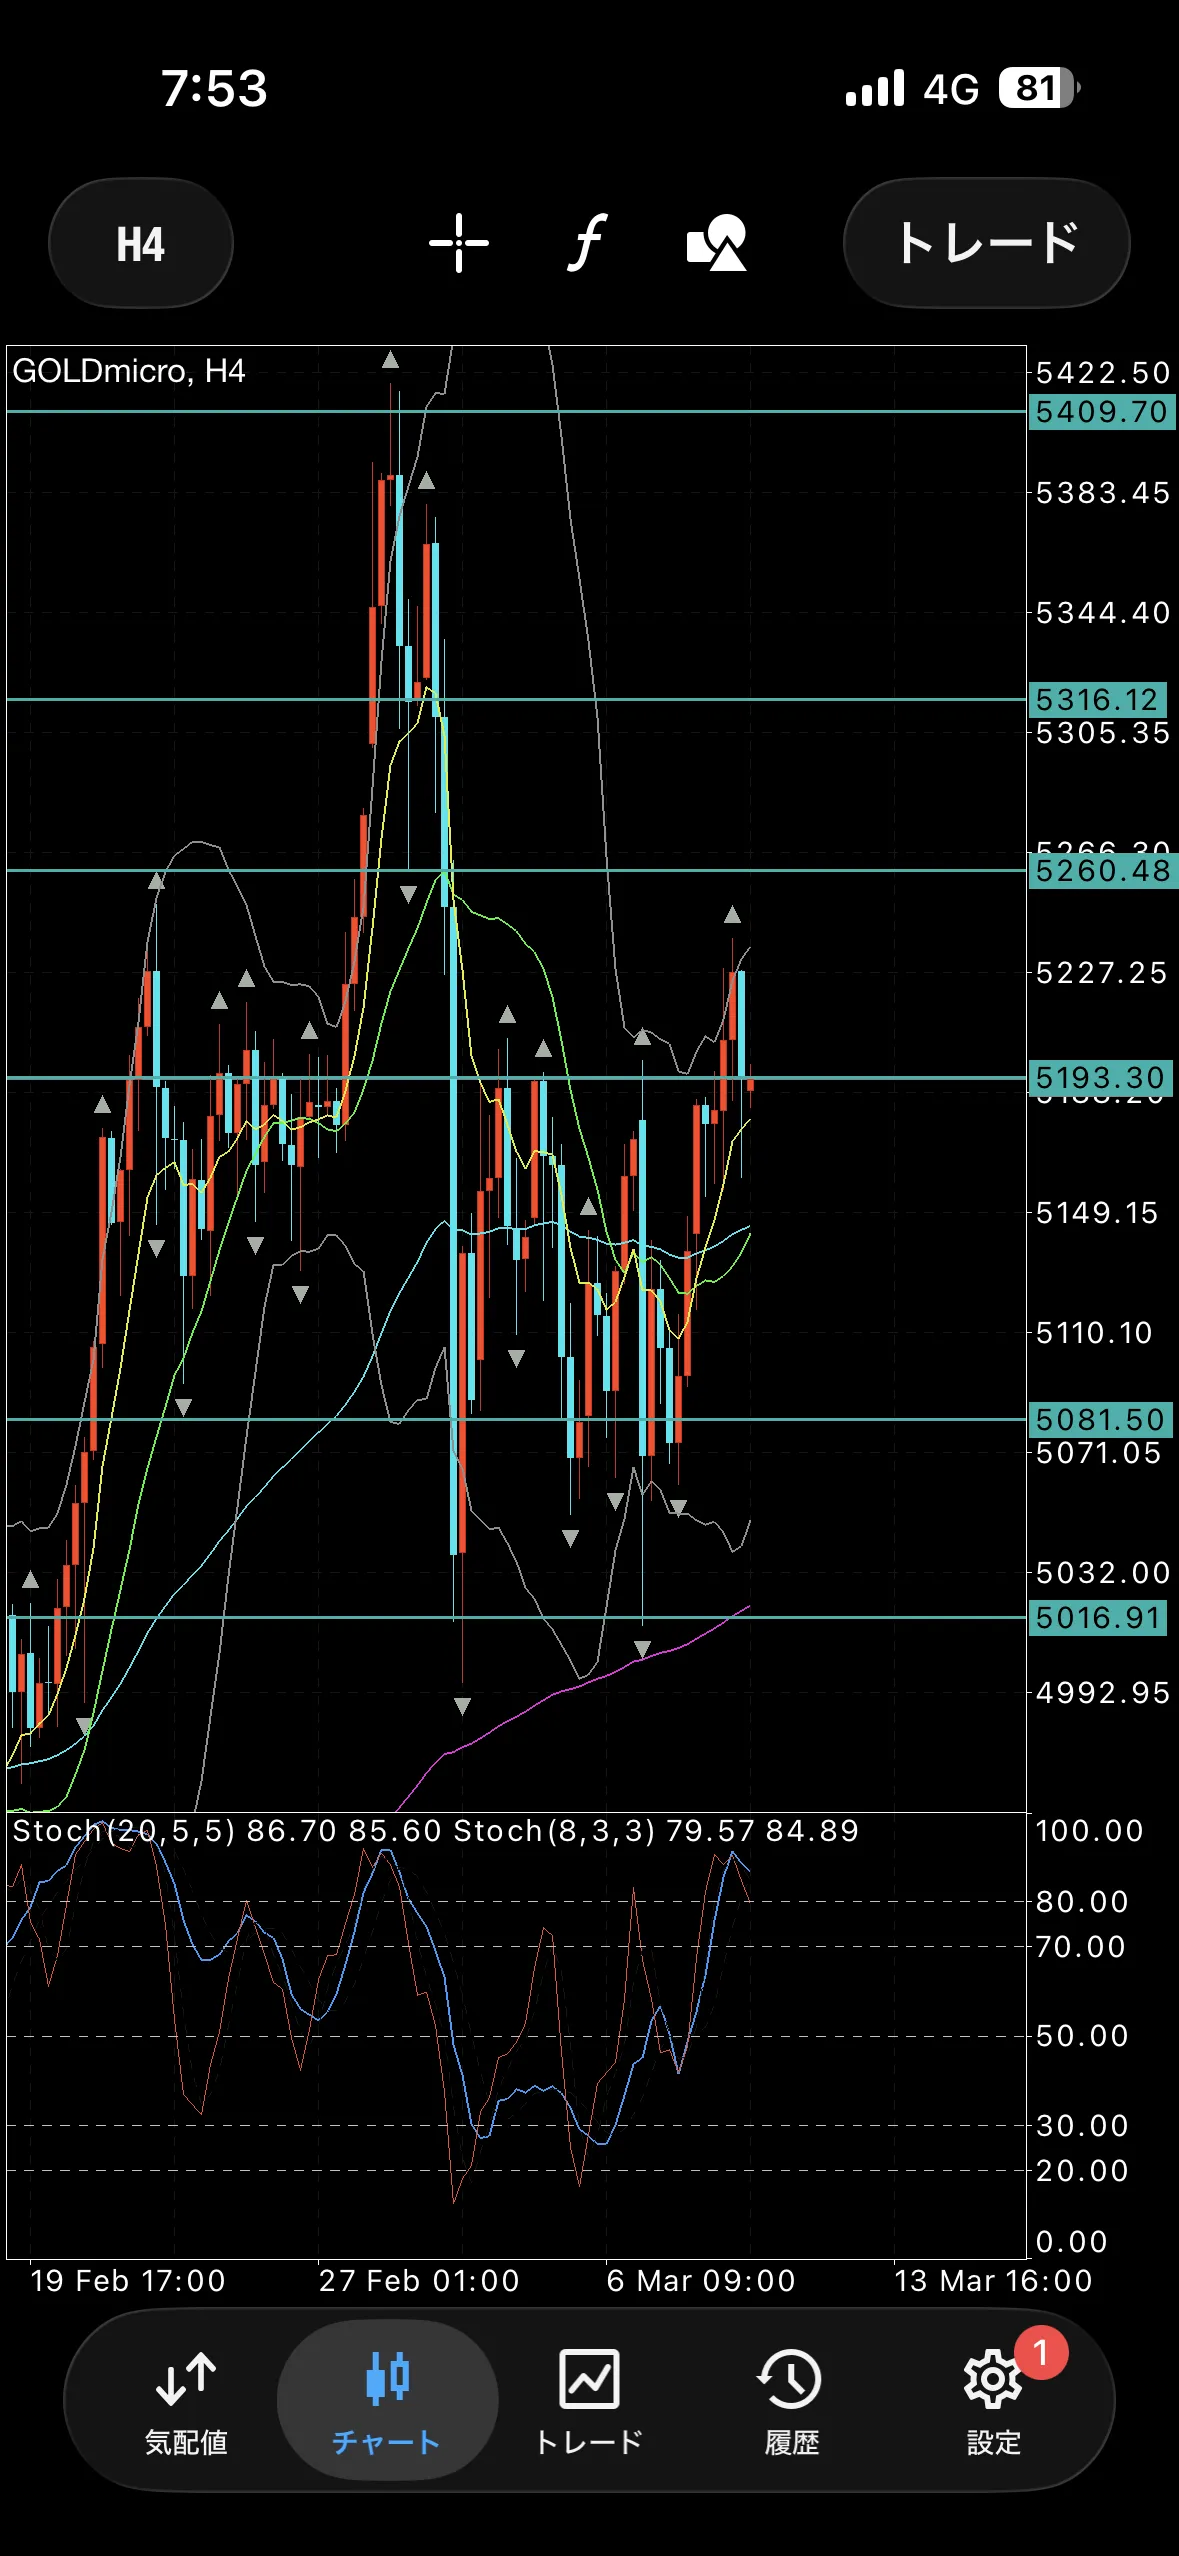
【4-hour chart】
Since the price has broken out of the range, the outlook is bullish until it dips below the horizontal line around 5193; if it goes below, it will re-enter the range.
There is an upward short-term moving average with a lower wick, so a certain degree of advantage is secured, but it's still around the middle line, so keep that in mind.
There is a long lower wick that betrayed the move from 5261 to 5316, so attention should be paid to price action here.
Long-term Stochastic rising,short-term Stochastic falling, so it may be prudent to wait for the lower bound of the short-term Stochastic first.
Buying defense line
5081
5016
Selling defense line
Near 5234~61 around the left shoulder peak to the three-peak neckline
Neckline real body 5316
Around the peak at 5409