

2026/03/10 Gold Analysis
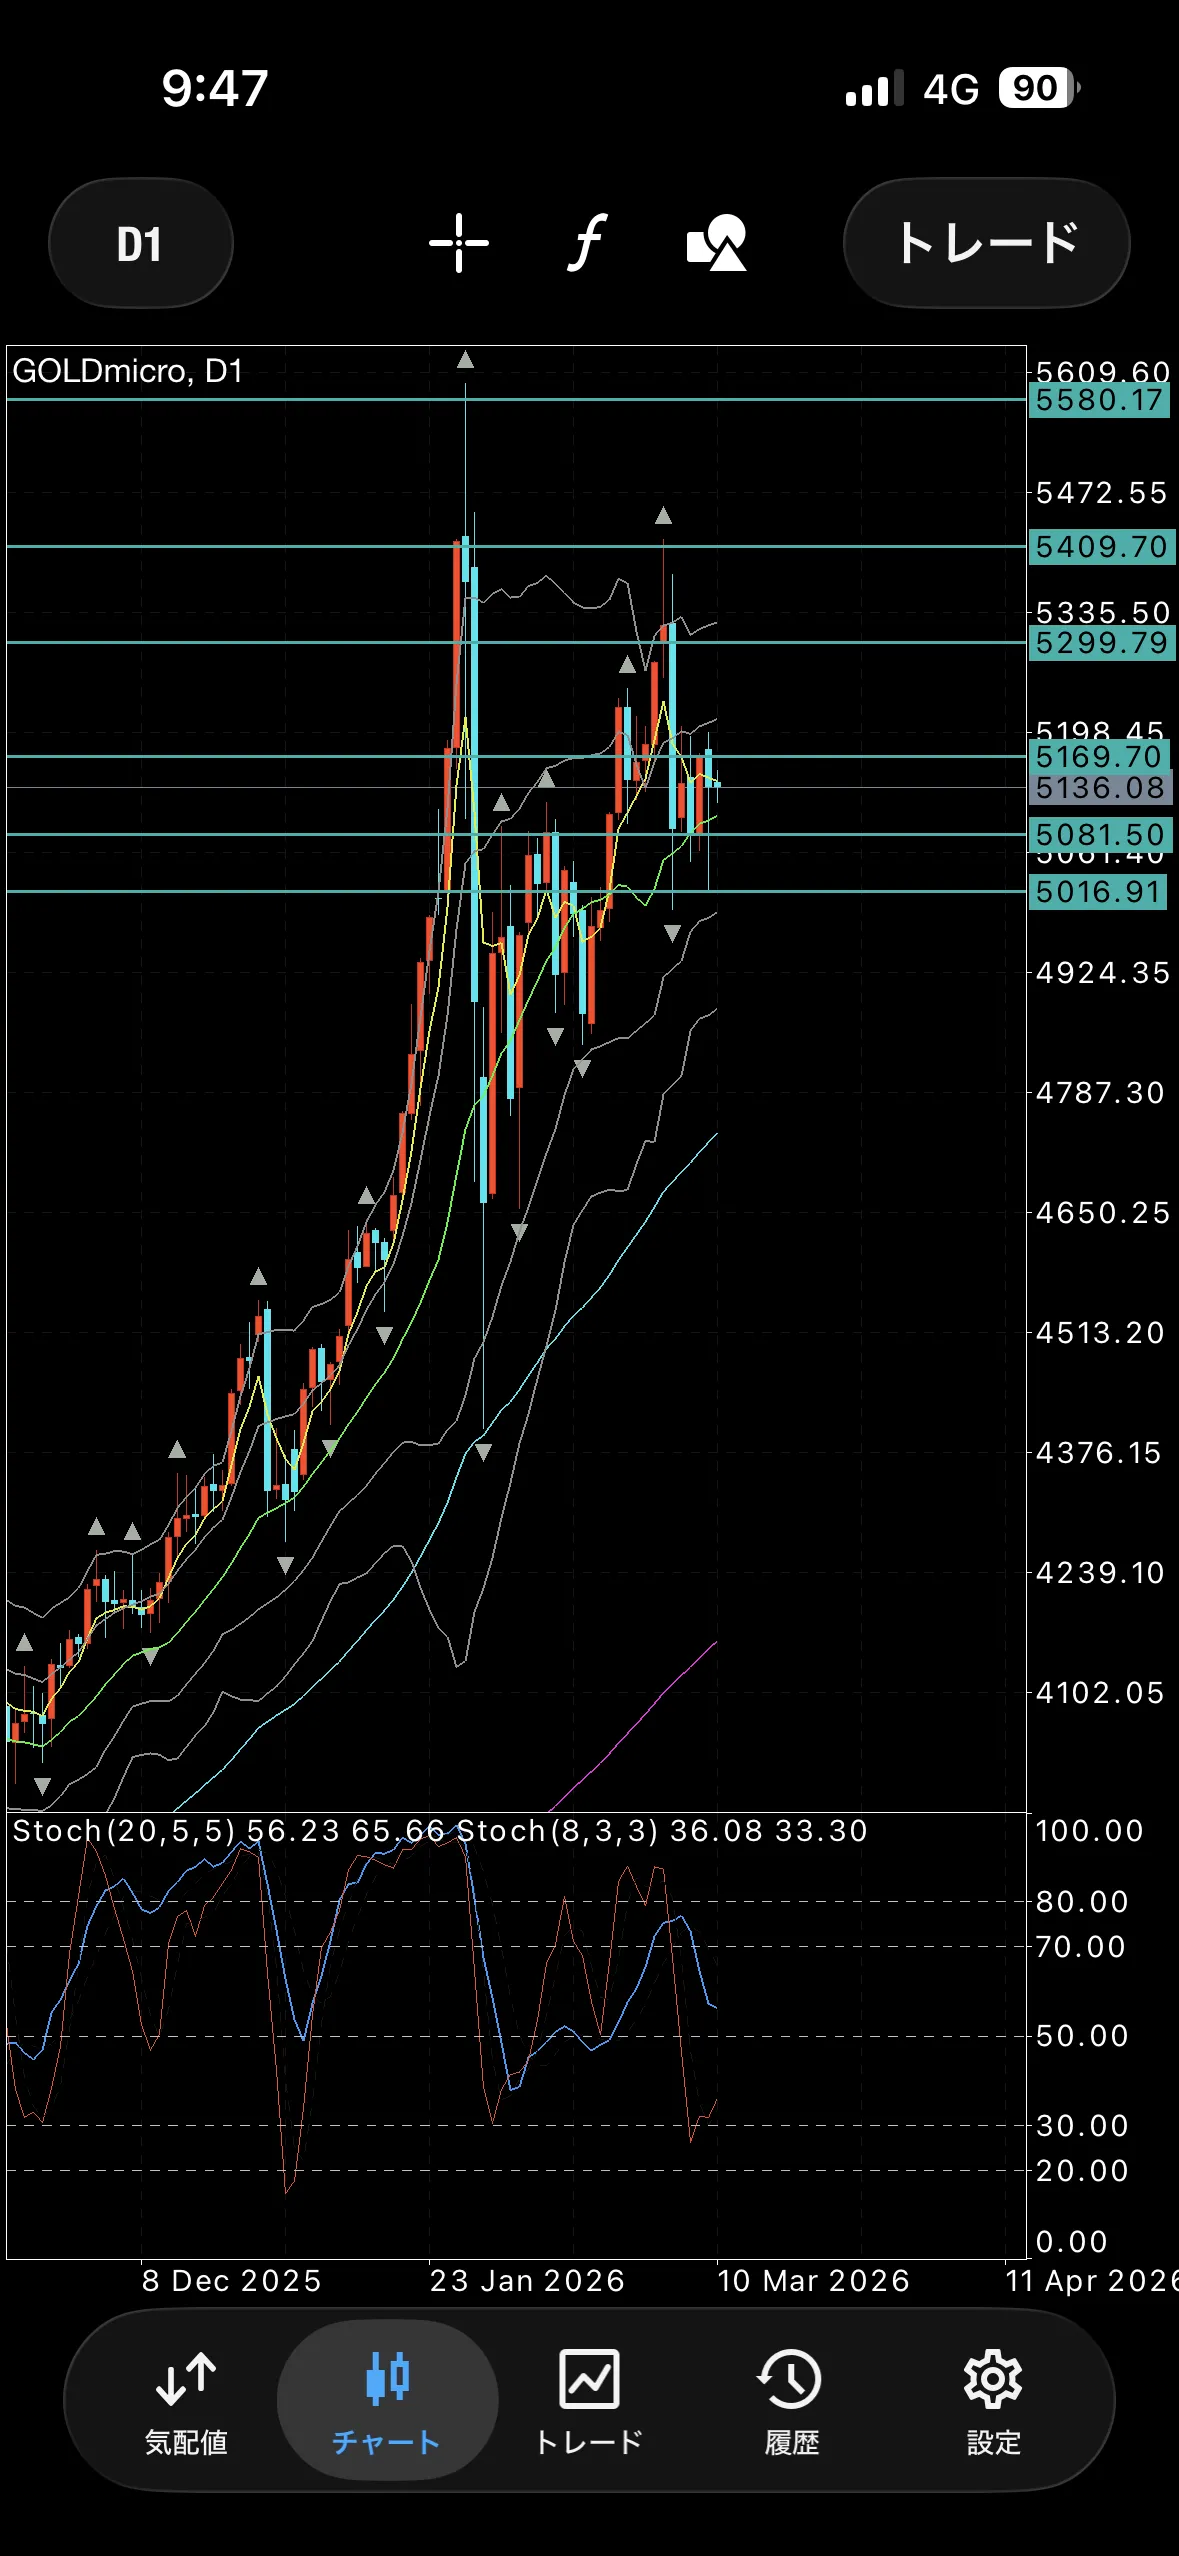
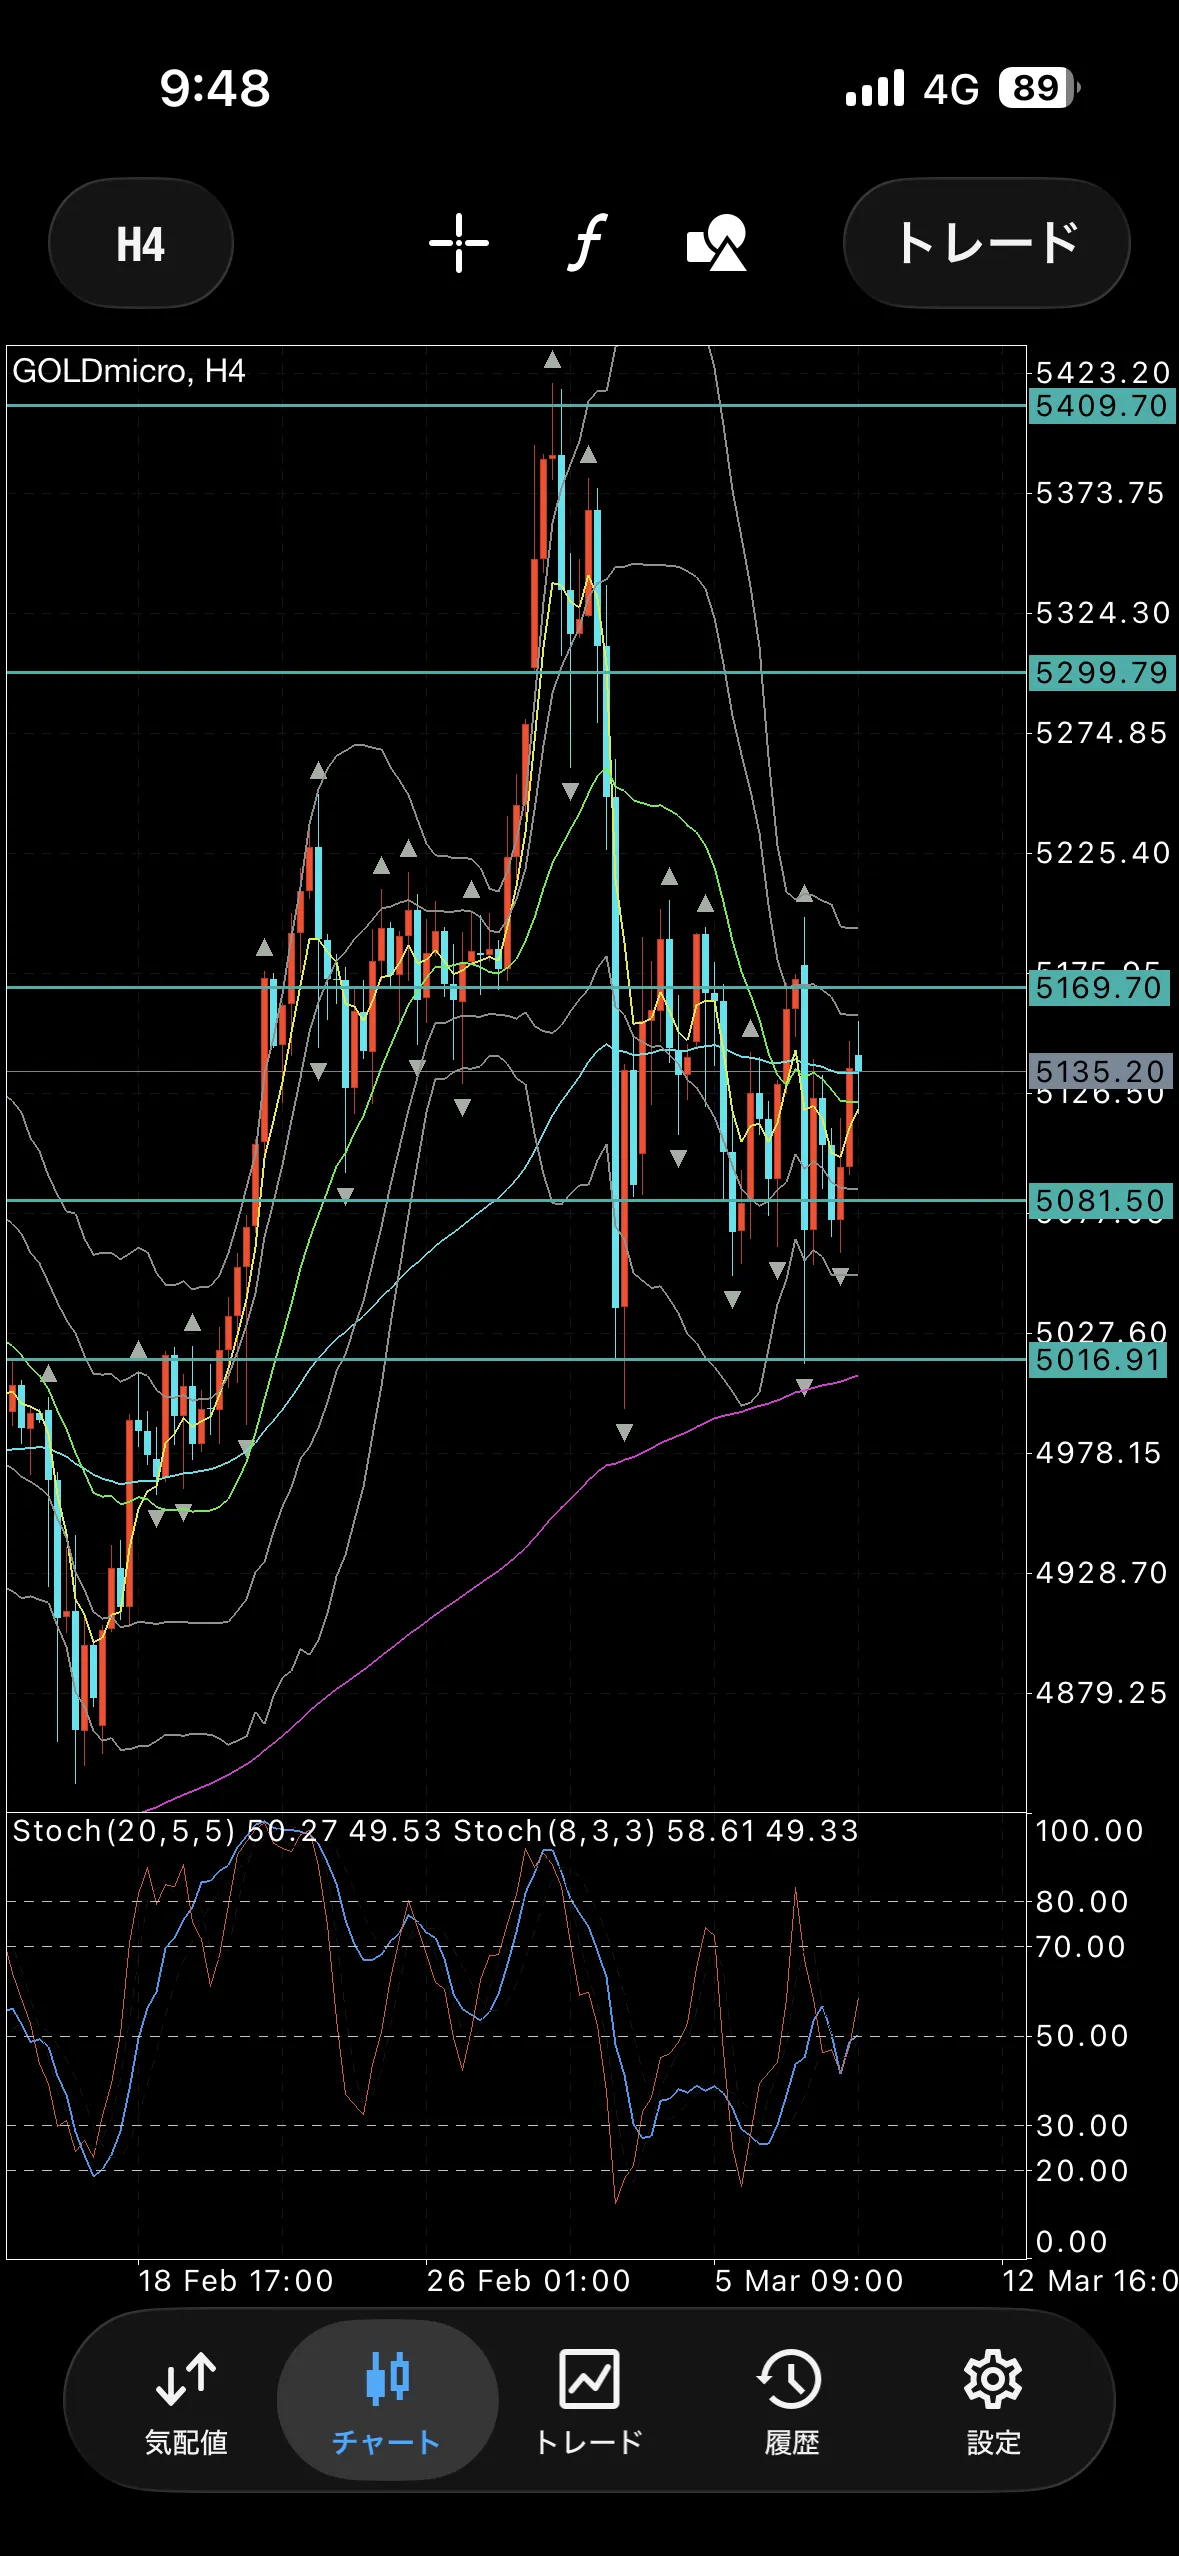
Both the daily and 4-hour charts are in a range.
The daily chart shows the short-term stochastics are hidden, while the long-term is up, giving an impression of waiting to buy.
In the short term it looks bearish, but in the long term it looks bullish, so it may end up being bought.
The 4-hour chart also suggests a range for both the indicator and stochastics.
Since it’s a lower-high pattern, it can be interpreted as bearish, but it can also be seen as being bounced around near the 200 EMA.
Buying defense line
Around 5081
Around 5016
Selling defense line
Around 5193
Around 5260
× ![]()