Discretionary Trader EA (Principles of Market Mechanics)
0
I will explain how to use the Market Principles EA 1.05.
Discretionary Trading and System Trading
Typically, EAs used in FX refer tofully automated tradingsystems trading.
They mechanically execute trades based on pre-determined logic.
However, such EAs can extract and recognize technical indicators and numbers from charts,but they find it difficult to recognize chart patterns like humans.
On the other hand, a discretionary tradercan recognize chart patternsand, from past experience,recognize high-probability situations, but may miss entry triggers due to a lapse in focus, or take profits too early or cut losses too late,which makes mechanical trading rules hard for them..
What kind of EA is Market Principles EA 1.05
The difference between Market Principles EA and a general EA is that from entry to exit,a general EA trades fully automatically, butin Market Principles EA, a discretionary trader selects the entry method and exit logic, and based on thatthe EA executes trades mechanically.If a discretionary trader recognizes chart patterns or Elliott Wave,with a simple UI operation, can instantly draw exit points and Fibonacci retracements on the chart!
A wide variety of mechanisms assist in realizing the discretionary trader’strading strategy.
This is a new type of EA that has not existed before.
UI descriptions for Market Principles EA

①~② Manual entry buttons and lot size
① = When you press the “BUY” button, you go long. When you press the “SELL” button, you go short.② = The lot size is determined by the number in the “LOT”. 1.0 lot = 100,000 currency units
Common/Parameters settings

③ Exit logic button

Starting point when aiming for a long position is a bullish candle; starting point when aiming for a short position is a bearish candle. [Very important]
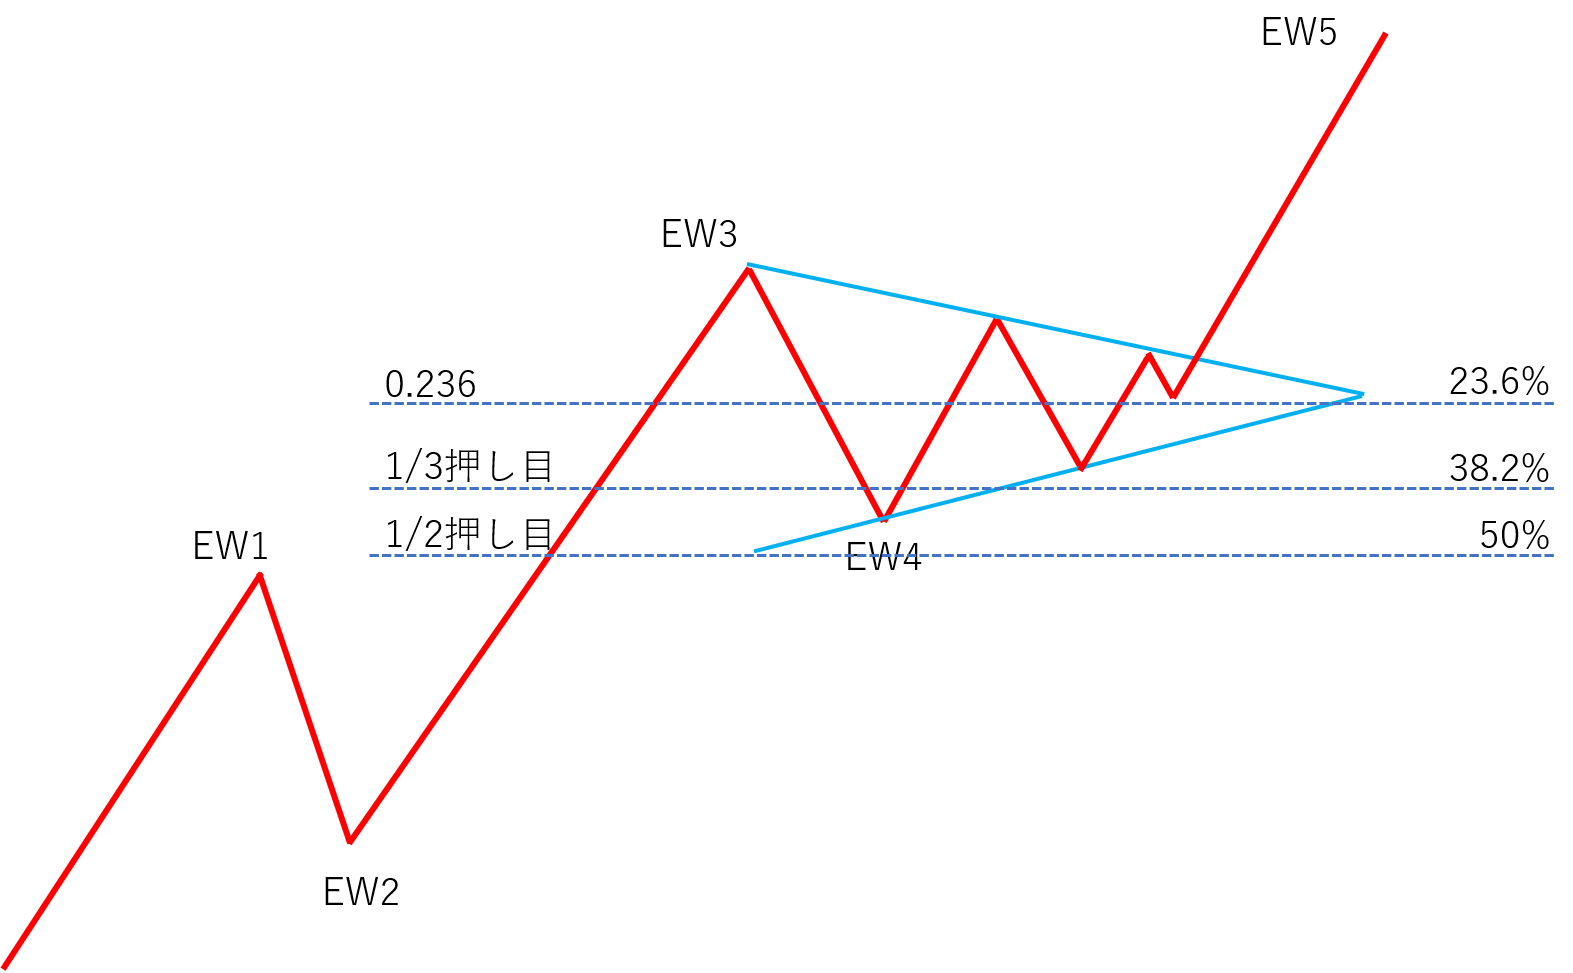
When selecting the “ELLIOT WAVE” logic
1 TP and SL
(1) Scenarios aiming for the third wave target price
T/P... Elliott Wave third-wave target price (calculated by proprietary logic)
S/L... Starting point of Wave 1 in Elliott Wave

(2) Scenarios aiming for the fifth-wave target price*
*When Wave 3 is confirmed and the fifth-wave target price is displayed on the chart
T/P... Elliott Wave fifth-wave target price (calculated by proprietary logic)
S/L... Wave 2 of Elliott Wave

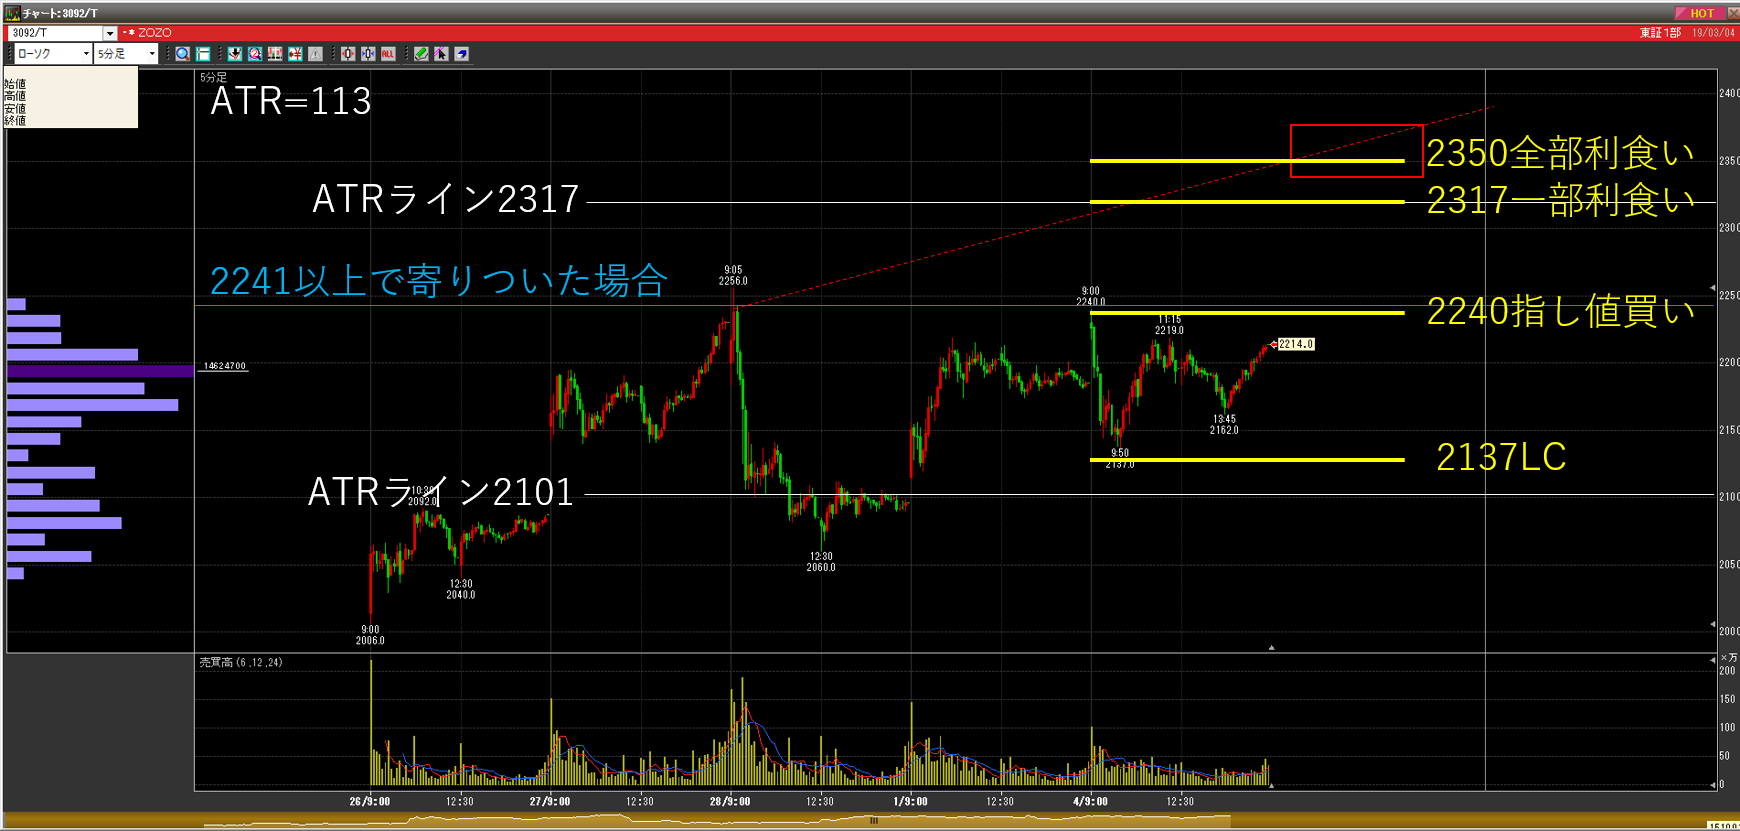
2 Moving S/L
(1) Break-even by width from entry price to target price × 0.5
*Default value is false, so there is no move to break-even.
(2) Half-profit at width from entry to target × 0.7 (70% trigger)
(3) After reaching 70% trigger, move S/L to midpoint between entry price and 70% trigger
3 Others
If RSI reaches 80 while holding a long position or 20 while holding a short position, perform full close (RSI full close true).
Overview

When selecting the “ELLIOT WAVE” logic and parameter settings

When selecting the “CHART PATTERN” logic
1 TP and SLT/P... the chart pattern’s target price, highest attainment point S/L... the next opening price after the chart pattern's red “□”, for long at the bottom and for short at the top
2 Moving S/L
(1) Break-even by width from entry price to target price × 0.5
(2) Half-profit by width from entry price to target price × 0.5
3 OthersIf RSI reaches 80 while holding a long position or 20 while holding a short position, perform full close (RSI full close true).

When selecting the “CHART PATTERN” logic and parameter settings

④ How to initiate a trade
 The entry line is drawn in the UI, and if any of these lines reaches the trigger and enters the trade,everything is cleared (disabled), preventing unintended averaging down.
⑤ Exit (manual)
Using these horizontal lines or trendlines, you can determine exit points.
As a premise, if there is a horizontal line or trendline in the profit direction at the current rate, only line touch is considered. If there are horizontal lines or trendlines in both profit and loss directions, you can choose line touch or closing price break.

⑥ Clear all lines at once and indicators

indicator

Trading recordsDisplays combinations of indicators, win rates for long and short per currency pair, and average PIPS gained.

If you think the performance is odd
Possible causes of malfunction are as follows.Unexpected entry or exit actions occur suddenly
1. Is the magic number of Market Principles EA used on other currency pairs or timeframes overlapping? 2. Is the RSI on the timeframe you are using not reaching the threshold? (only for exits)An entry trigger is reached but no entry is made
1. Is auto-trading enabled (smiley face)? (Is the face in the top-right not a frown)? 2. Is there any error in the entry trigger? 3. Is the magic number of Market Principles EA used on other currency pairs or timeframes?S/L movement not working well, and no exit at T/P
1. Is the price range from entry to S/L trigger wide enough? 2. Is the price range from entry to T/P wide enough?3. Is the magic number of Market Principles EA used on other currency pairs or timeframes?
When you enter with “CHART PATTERN,” TP shows but SL does not
Initially set stop loss is a result of the close break of the boxed area enclosed by □, so it is normal for SL not to be displayed.Contact for issues
If you have any issues, please contact us using the form below.
[contact-form][contact-field label="Name" type="name" required="true" /][contact-field label="Email" type="email" required="true" /][contact-field label="Site" type="url" /][contact-field label="Message" type="textarea" /][/contact-form]
Currently reported issues
We apologize for the inconvenience.These are the issues currently reported.
1. After pressing “CHART PATTERN” and entering, the entry is set to the initial TP/SL rather than the CHART PATTERN exit point.
→ Fix in progress. After entry, if you press “CHART PATTERN,” it works normally, so until the fix is complete, please follow that procedure.
2. For “CHART PATTERN” and “ELLIOT WAVE,” during break-even or trailing stop movement for profit protection, the stop loss toggles between regular stop loss and break-even/profit-protection SL.
→ Fix in progress.
3. For certain profit-taking points in “CHART PATTERN” and “ELLIOT WAVE,” settlements do not occur
→ Checking the status of the issue
About Elliott Wave theory
Here we explain how to utilize Elliott Wave theory in the Market Principles EA.
First, please view the video below: “How to capture the first wave of Elliott Wave on the right side of the chart.”
How to capture the first wave of Elliott Wave on the right side of the chart (Video)
https://youtu.be/EdAqWJDSXg4How to generate Elliott Wave with Market Principles EA (Video)
After watching the video “How to capture the first wave of Elliott Wave on the right side of the chart,” please watch this video as well.https://youtu.be/UArThj1EuWE
About chart patterns
Market Principles EA can output target values for chart patterns such as pennants, flags, ranges, and triangle consolidations quickly and easily.
The method is very simple: just enclose the real bodies of the candlesticks that are in consolidation with [□].
https://youtu.be/8eth1uc-KLU
How to receive Market Principles EA for free
Click the button below and complete the required procedure.
× ![]()