

March 9 – This Week's USD/JPY Strategy

Reviews & videos can be viewed here
Good morning everyone.
The USD/JPY gap on Monday opened about 30 pips higher.
Currently the gap has not closed.
USD/JPY MT4 daily chart (note the number)
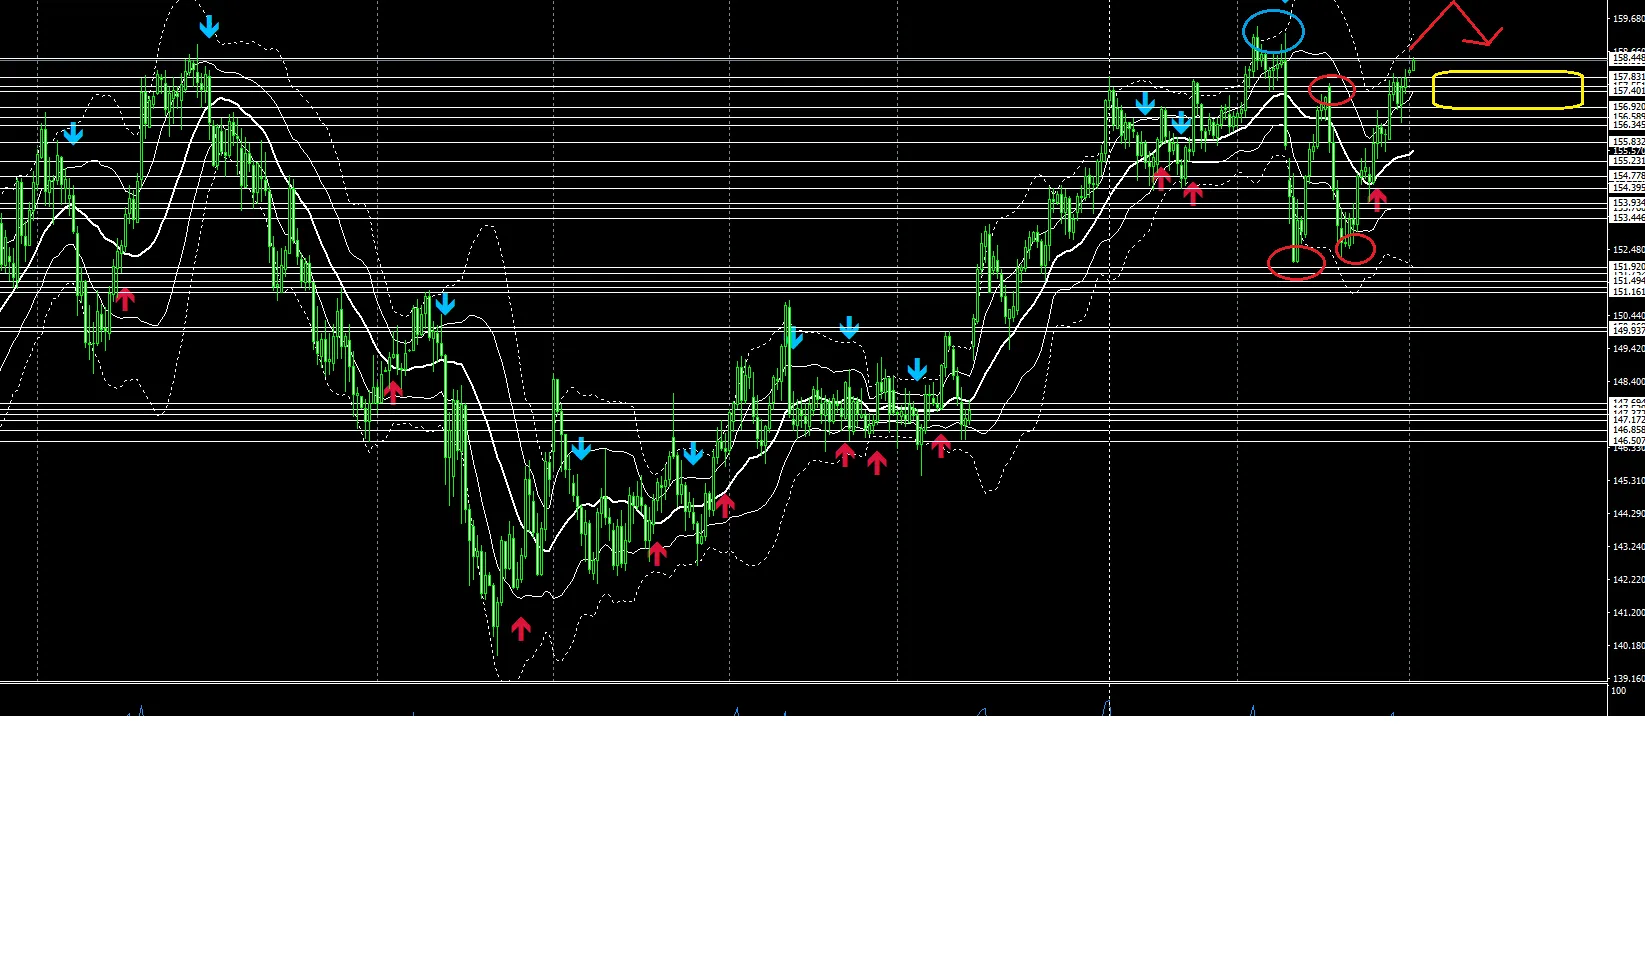 The lower red circle indicates a slight higher low.
Since the price has risen above the upper red circle, I’m imagining the movement might target the recent high blue circle.
If it breaks above, as shown by the red arrow, there will be a pullback/downward adjustment for a while.
If it doesn’t happen like this, perhaps it will range in the yellow square area.
For now, the key point is whether the gap will close.
If it closes, that could become a temporary buying opportunity.
Since the area below the gap has been ranging, it probably won’t break out all at once...
This is how I’m reading the chart.
There are no notable US indicators due tomorrow.
Is it following equities? Not necessarily; USD/JPY behaves a bit differently.
This morning the Nikkei fell to around 51,000 yen, meaning it dropped about 10,000 yen from the peak.
Even on the 1-hour chart, the move is doing the same as the USD/JPY chart.
What goes up, must come down; what goes down, goes up.
Rising to fall, falling to rise...
If it breaks out of the range, the market expands.
Same here.
Ultra-elite traders will chase the red line on a 1-minute chart, focusing on the moments of long-to-short transitions and watching the chart closely for those points.
Right now, the 1-minute chart for USD/JPY is a "buy."
If you’re waiting to sell, assume there will be a gap close about 50 pips below, and then consider selling USD/JPY after switching from buying to selling.
If possible, I’d like to quickly capture a sell break at the Elite Trader S-line.
Thank you for your continued support today as well.
Anyway, for traders who want to succeed in trading, to earn a living from trading, here is my recommended product—the trading techniques you can learn on your own—these are the methods:
× ![]()