

2026/03/08 Gold Weekend Analysis
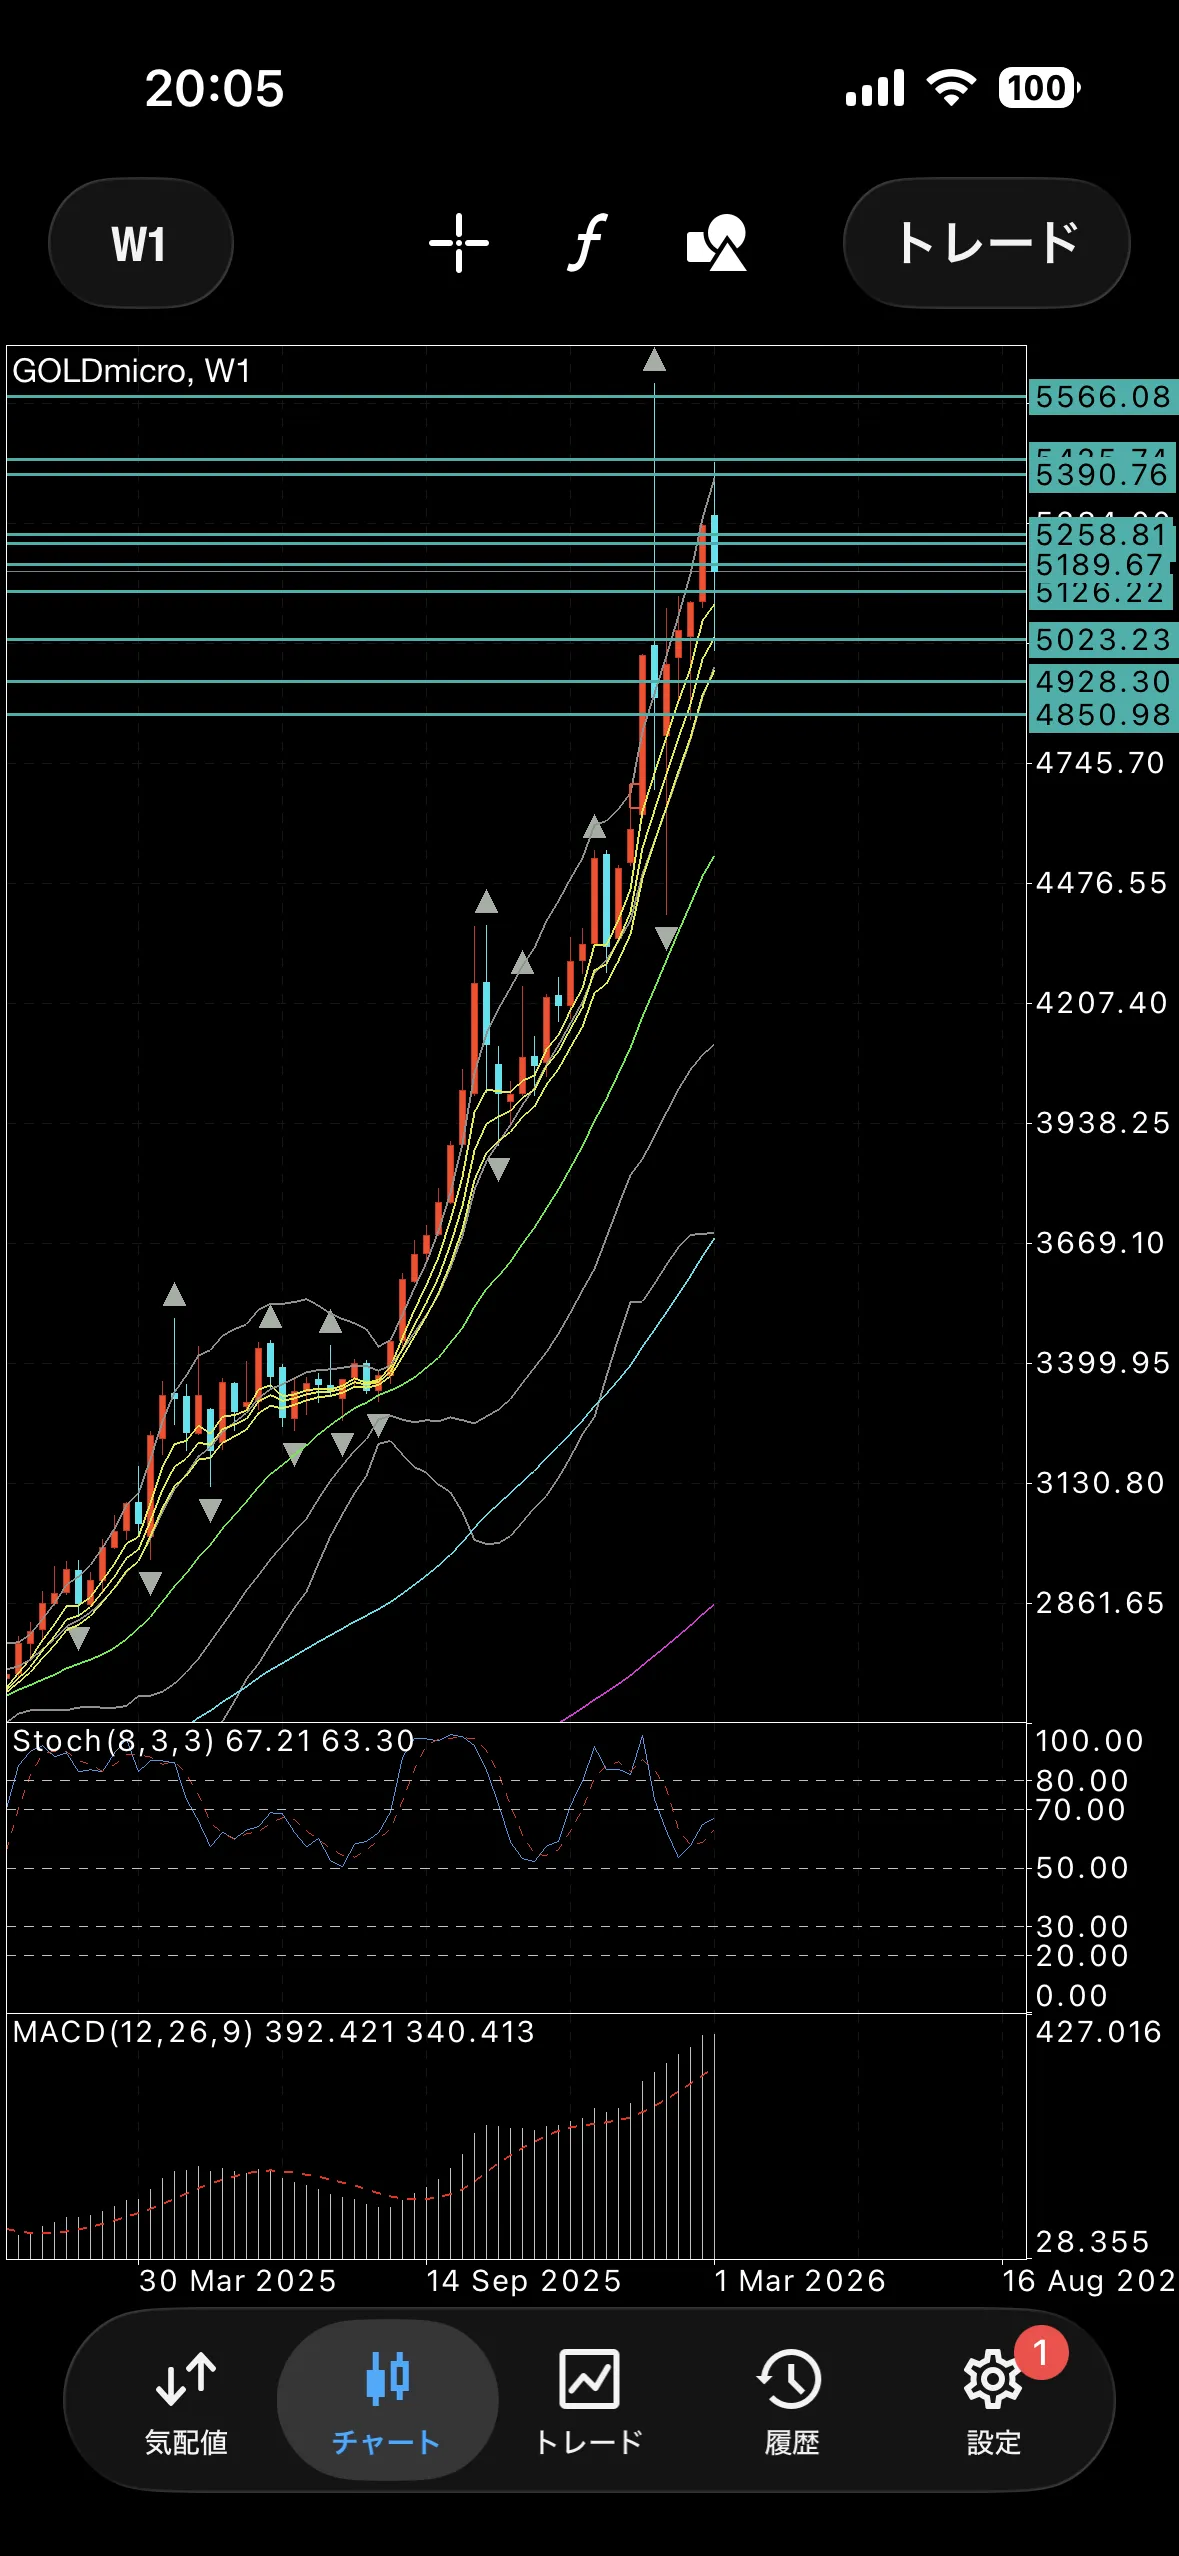
Weekly chart remains bullish as BW continues, so the uptrend persists.
There was a bearish candle, but it is a long lower shadow against the short-term MA cluster, so there is a high likelihood of a pullback being formed.
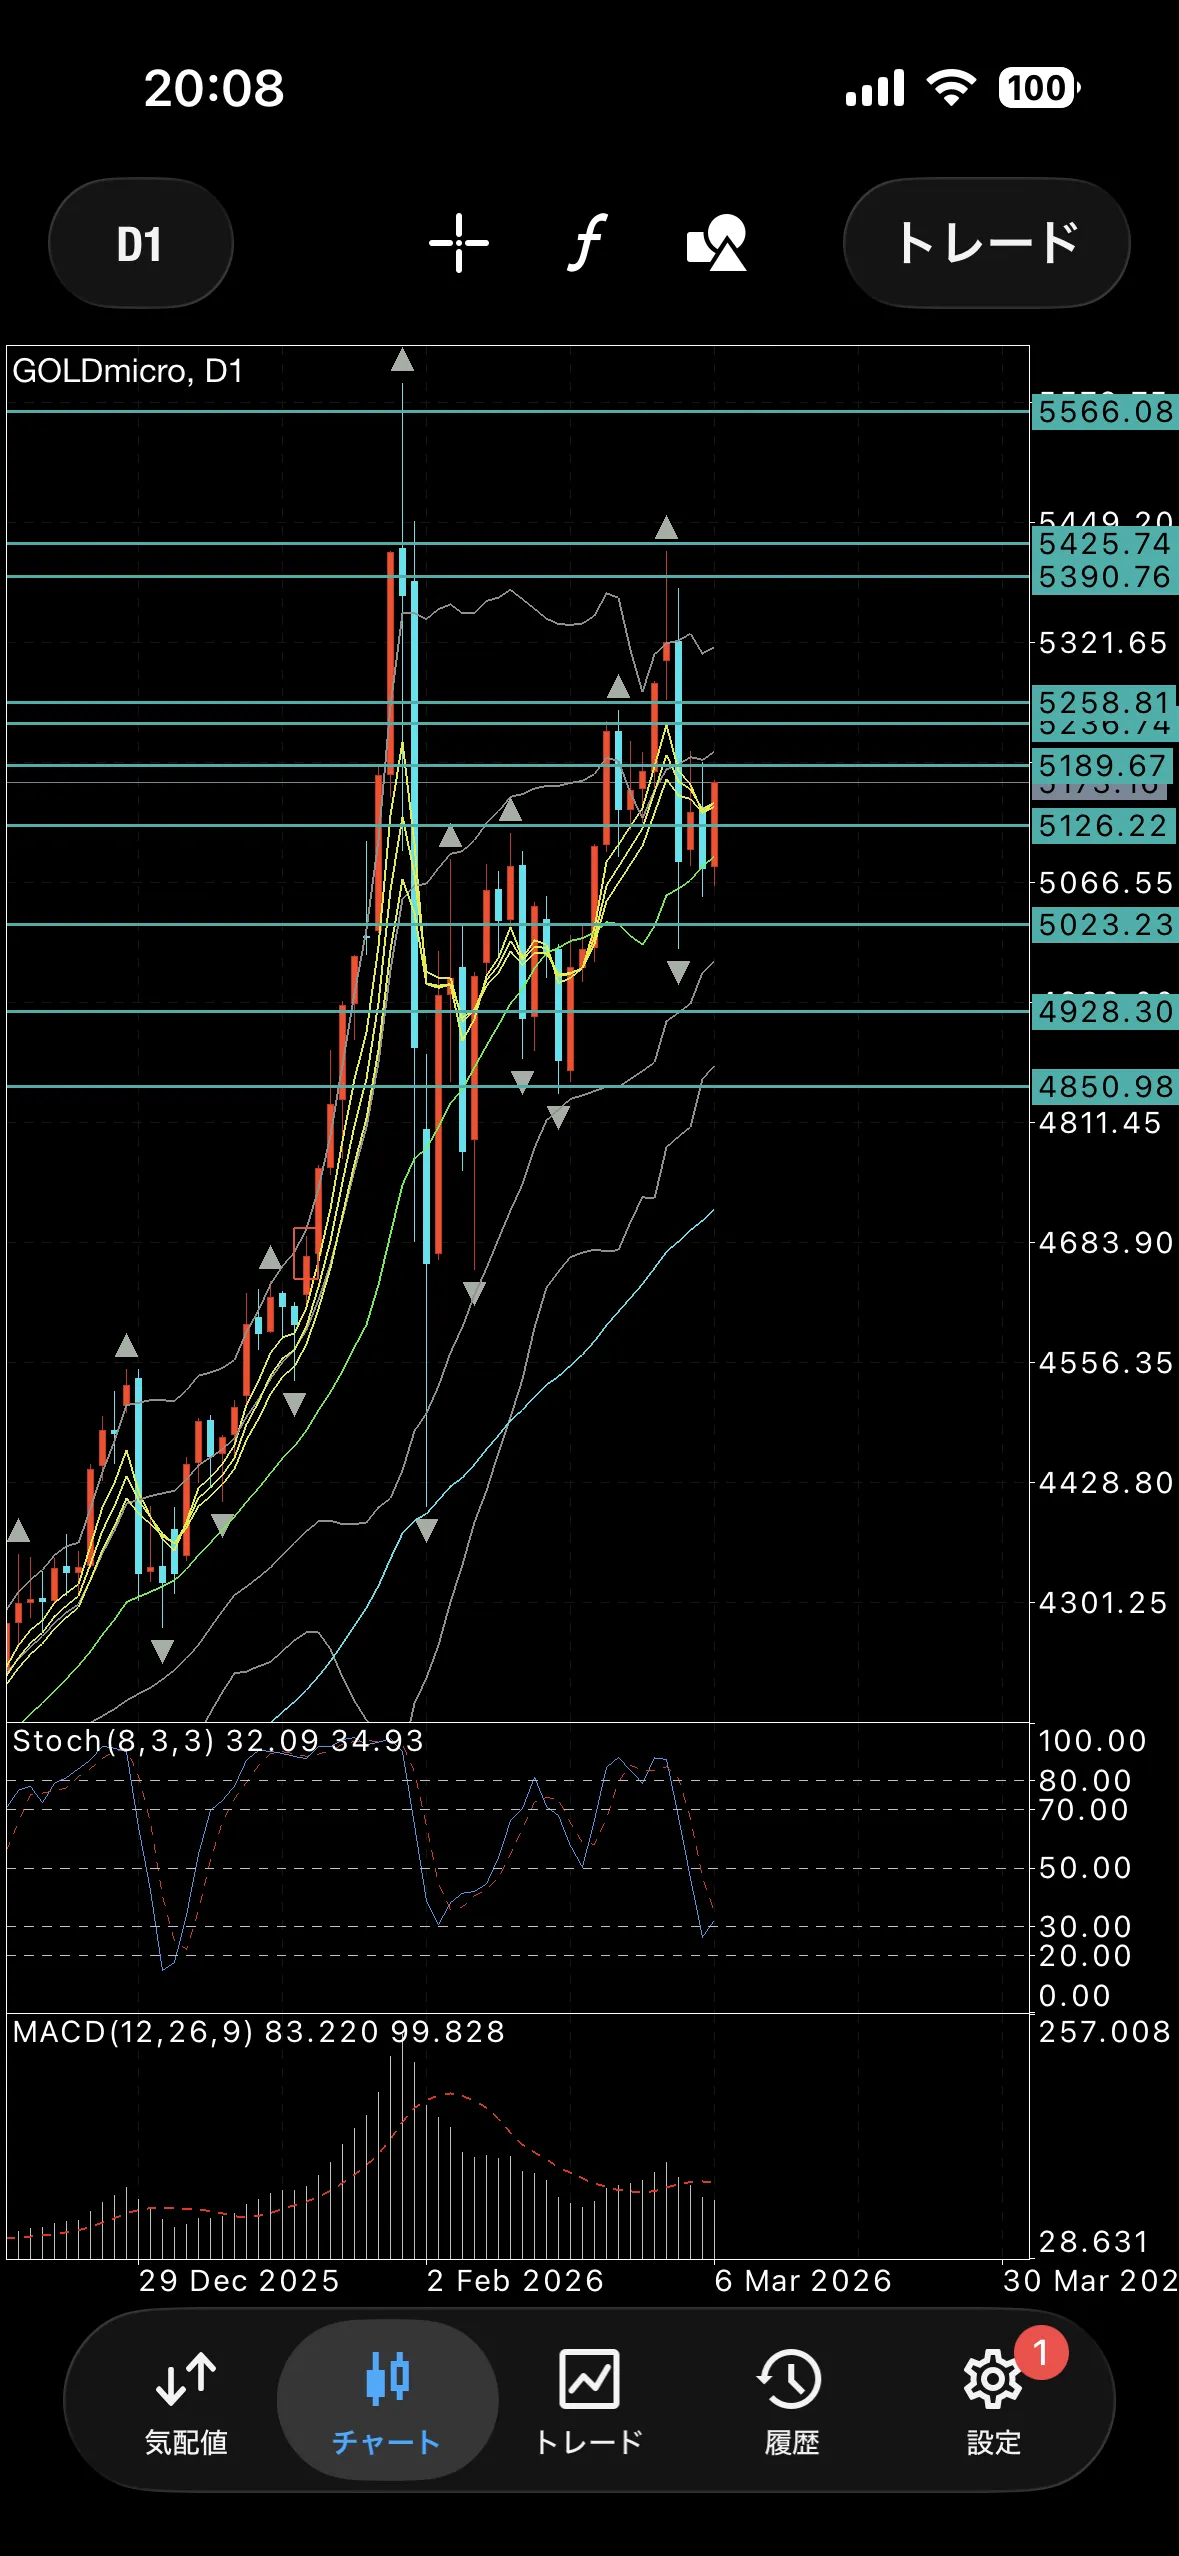
Daily chart shows around the 30 level of Stochastic and an outside day from the middle band.
Since the short-term MA cluster with a higher wick has also broken out, it gives the impression of buying strength.
I’m not sure how far the weekly wick will be filled, but it seems there could be a turn to the upside.
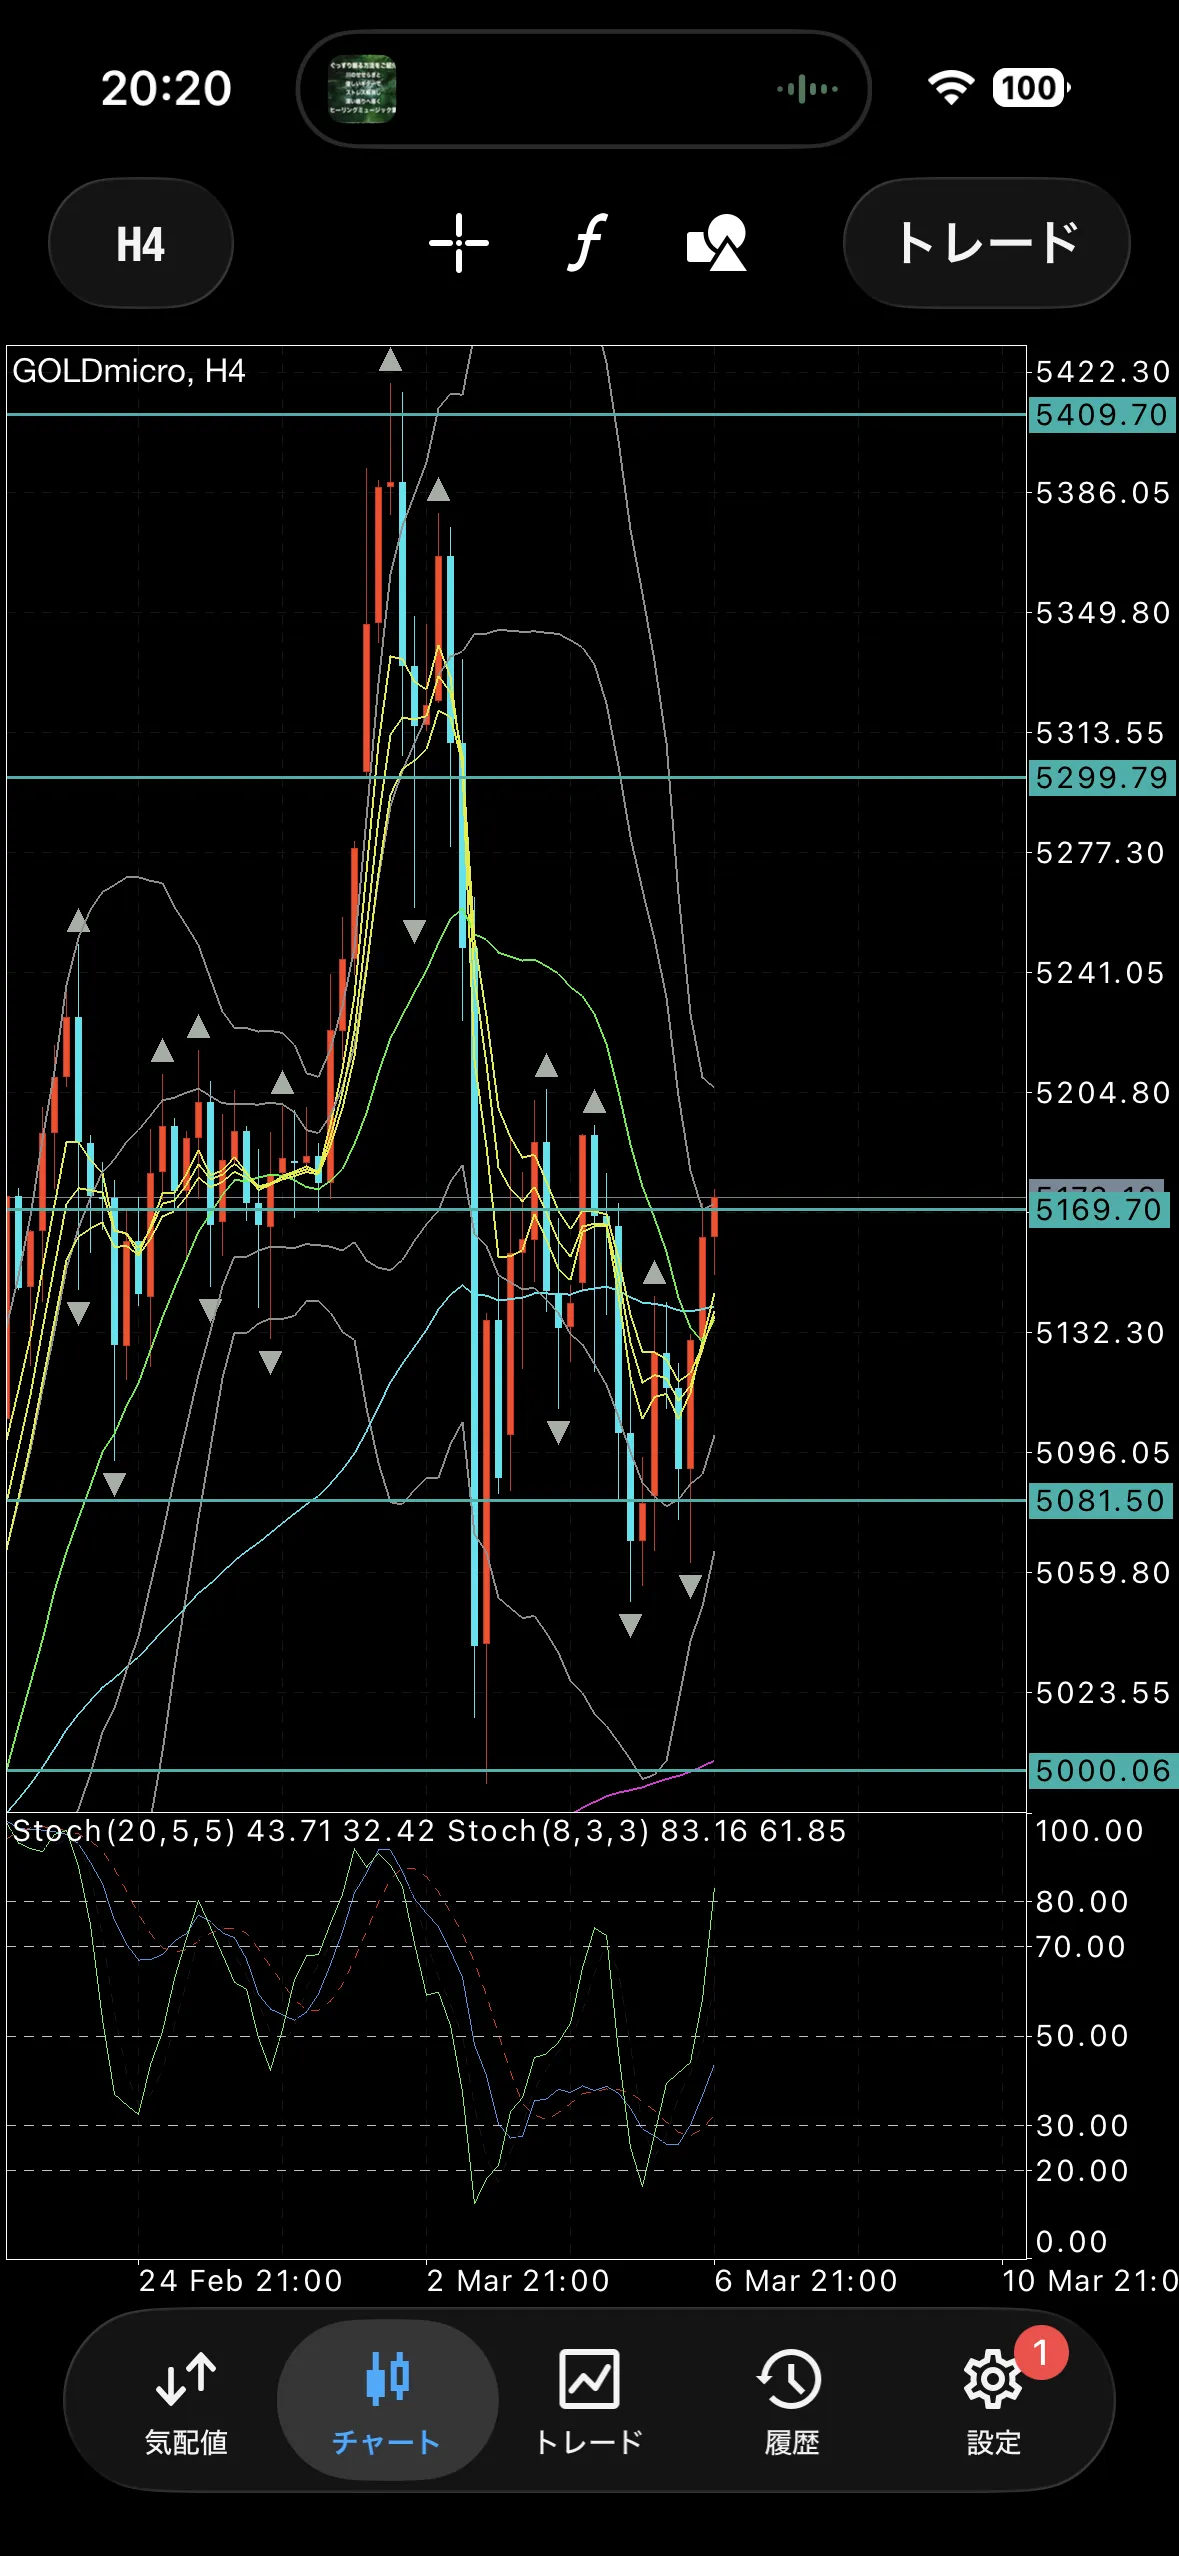
The 4-hour chart is in a range near the right shoulder of a descending triple top pattern and has not yet broken out upward; although a full upside reversal cannot be declared yet, two outer candles have been confirmed, so as long as it does not break below here, the outlook remains bullish.
The 75MA is becoming nearly flat, so a range-bound movement could start from here.
Defensive trading line
5409
5299
5169 (current level and weekly body confirmation line)
5081
5000