

Sales exceed 260 units!! 【'Line Alert'—a high-precision line indicator for trading, covering trend pullbacks, retracements, and counter-trend entries】
“Which line, in which direction, and how to attack it”
A line-and-bottom sign indicator that organizes at a glance
Channels, trend lines, highs/lows, and horizontal lines.
Even though you know every line is important,
“Ultimately, where should I enter?”is the most悩ましい part. (Note: original Japanese)
The 'Line Alert' is a tool that combinesfour types of linesand
bottom and top signsto surface only the entry points for pullbacks, retracements, and counter-trend on the chart.
“押し目・戻り・逆張り”entry points on the chart.
-
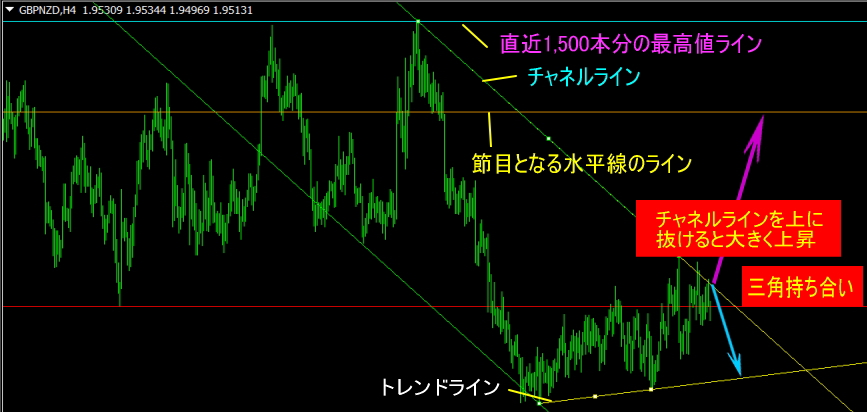
Channel line:
Shows the range of pullbacks and retracements within the trend,gives a guide on how long to waitas a reference. -
Trend line:
Visualizes the direction of the major trend,clearly indicating which way to aim for in the trend-following approach. -
Lowest/highest value line:
Indicates the most noticeable recent lows/highs, suggesting take-profit or counter-trend candidates. -
Pivot-level horizontal line:
Visualizes price zones that have repeatedly faced resistance,and functions as a line that’s easy to move through once broken.. -
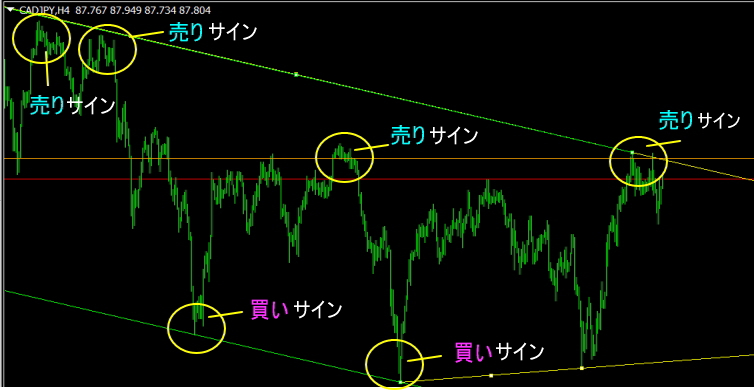
Bottom/top sign:
Marks major turning point candidates with circles,and provides guidance on how far to hold a position..
1. First, decide the direction from the orientation of the channel and trend lines
“Are we aiming up today or down today?”.
2. Once the direction is decided, wait for the price to approach the lines.
Focus only on moments when the price touches lines—pullbacks, retracements, new highs, new lows, etc.“the instant it touches the line”.
3. Combine with bottom/top signs and other indicators to
decide if the line is likely to rebound or break outand enter accordingly.
Organize the lines not as a vague concept, but as four distinct lines plus bottom/top signs,
making the decision for pullbacks, retracements, and reversals simpler.
.
※Final buy/sell decisions, lot sizing, and capital management are at the sole discretion of the user.
First, a look at the most recent results!
Product page contains recent performance results, please take a look.
August 11, 2023: Product page updated!
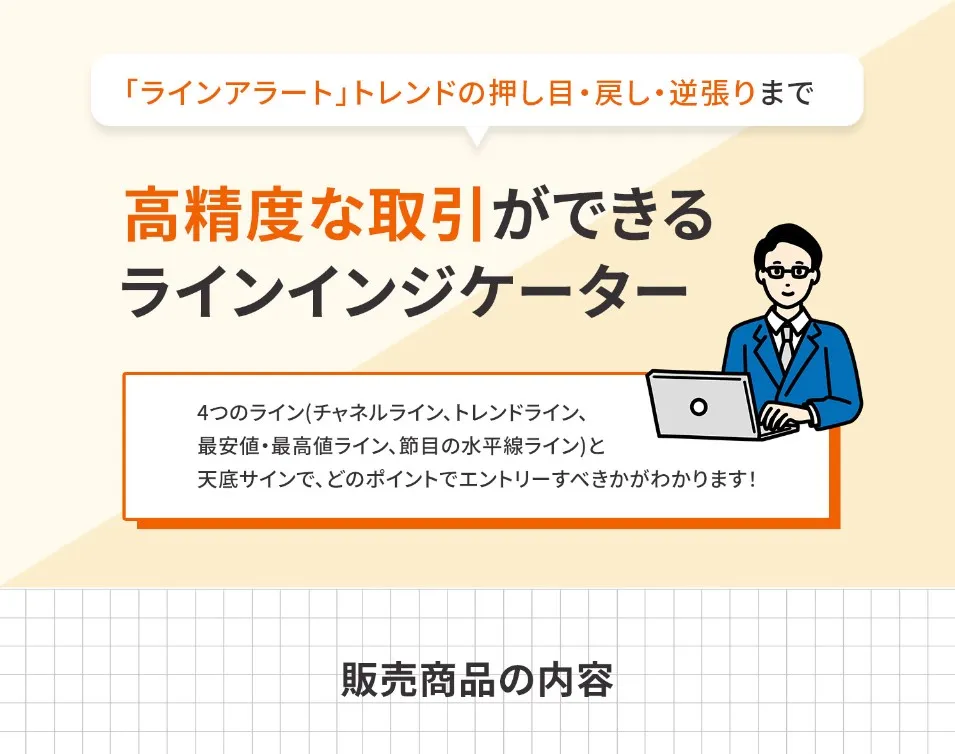
With the four lines (channel line, trend line, lowest/highest line, pivot horizontal line) and bottom/top signs, you can see exactly where to enter!
<Upgrade information>
On August 12, 2022, updated to a non-repainting version of the bottom/top sign indicator.
※This is an online community product.
Two products are bundled as a set below.
① Line Alert Indicator
② Bottom/Top Sign Indicator
<Product description video (no audio aside from the initial advertisement)>
Purchase here!
https://www.gogojungle.co.jp/tools/indicators/37454
① Line Alert Indicator
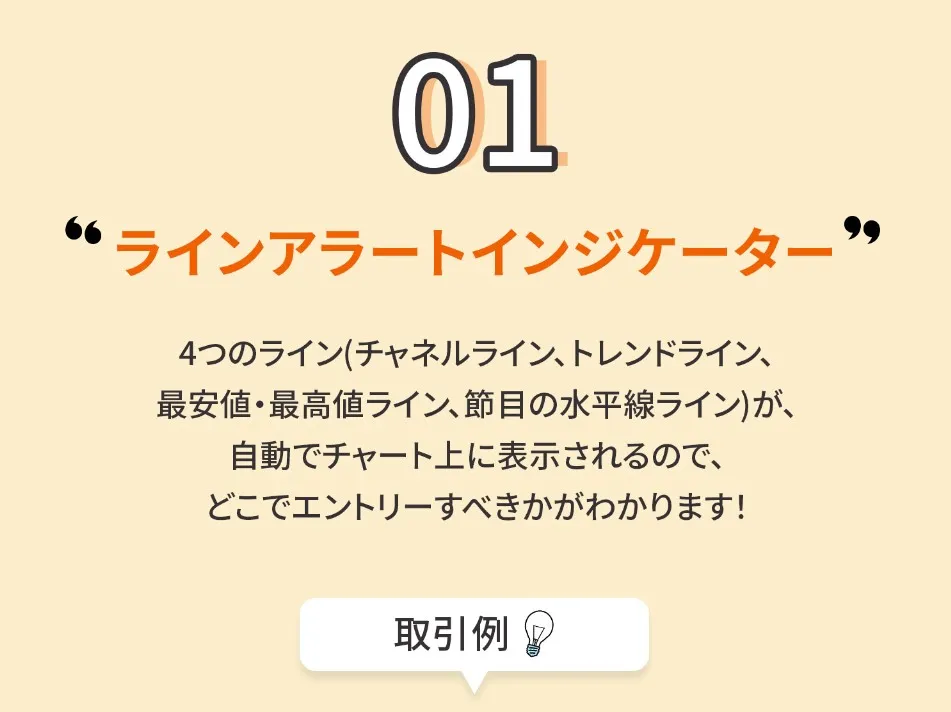
Four lines (channel line, trend line, lowest/highest line, pivot horizontal line)) are automatically displayed on the chart, showing where to enter!
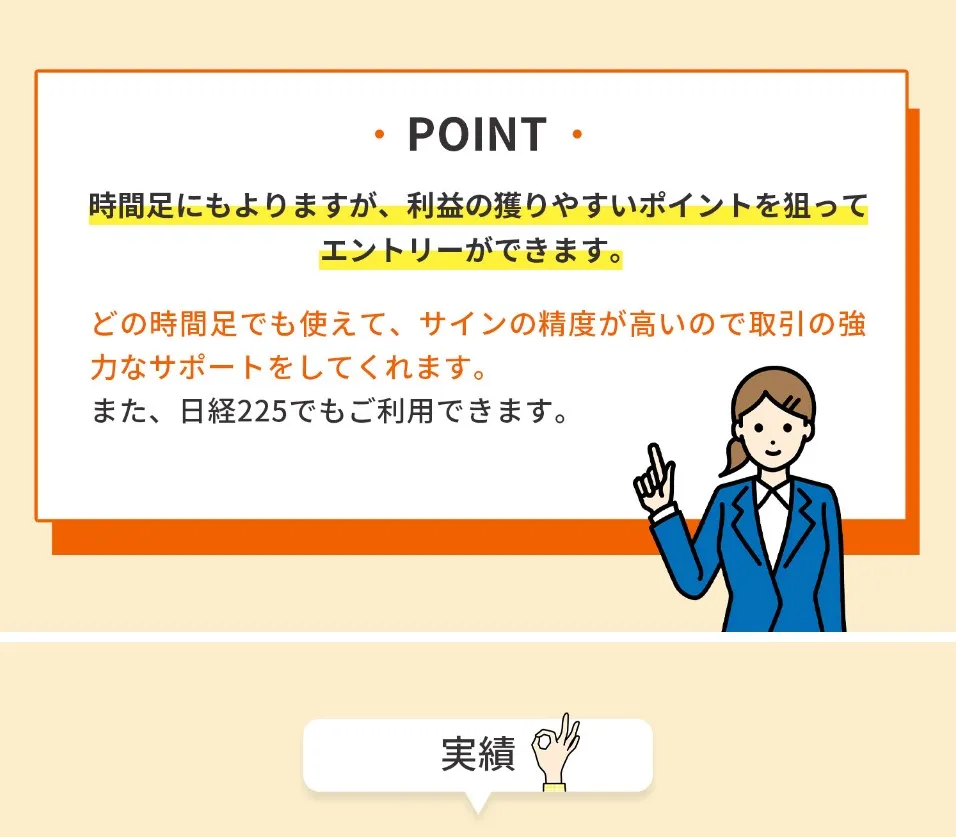
Works on any timeframe and the sign accuracy is high, providing strong support for trading. Also usable for Nikkei 225.
【Indicator Features】
・Compatible from 1 minute to monthly charts ・Entry opportunities average 2 times per day per currency on 5-minute charts ・Allows precise pullbacks and retracements in trends, with possible counter-trend entries. ・Parameters allow changing the number of candlesticks used to calculate each of the four lines. ・Comes with a detailed usage manual.
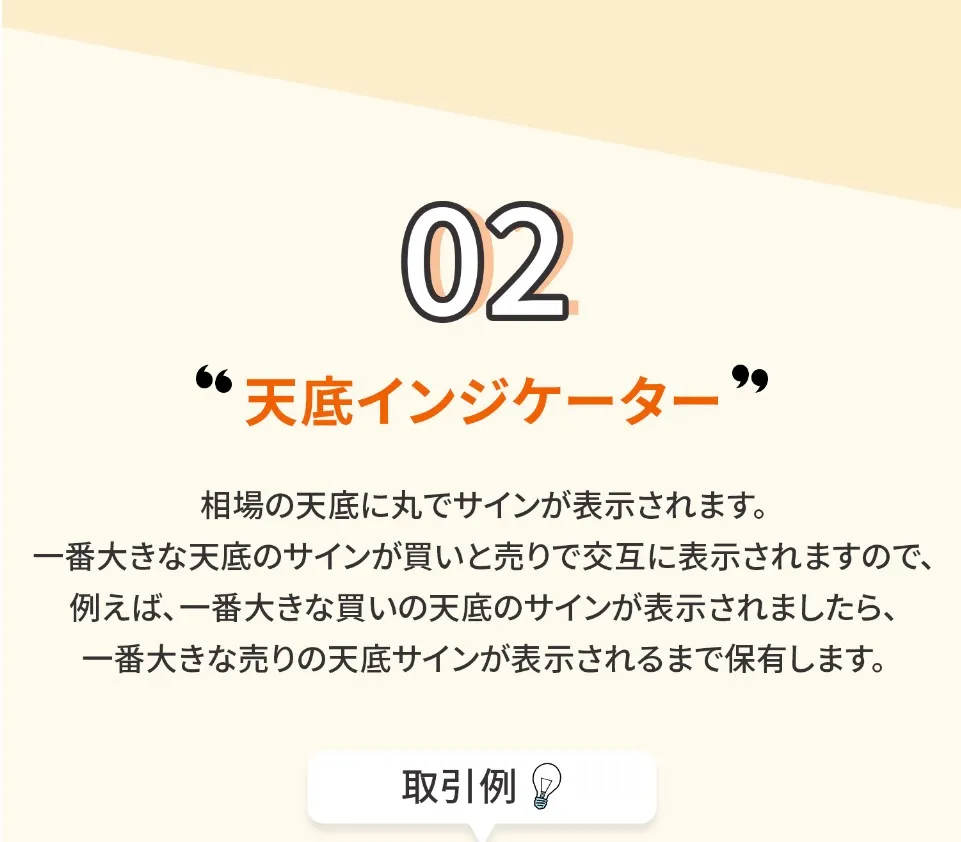
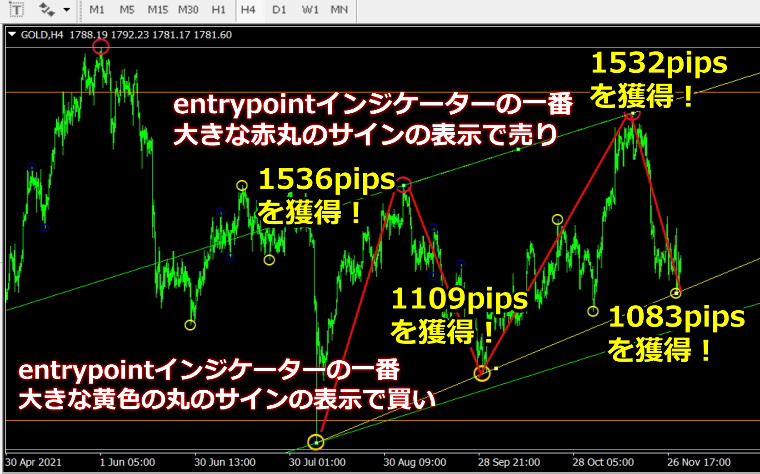
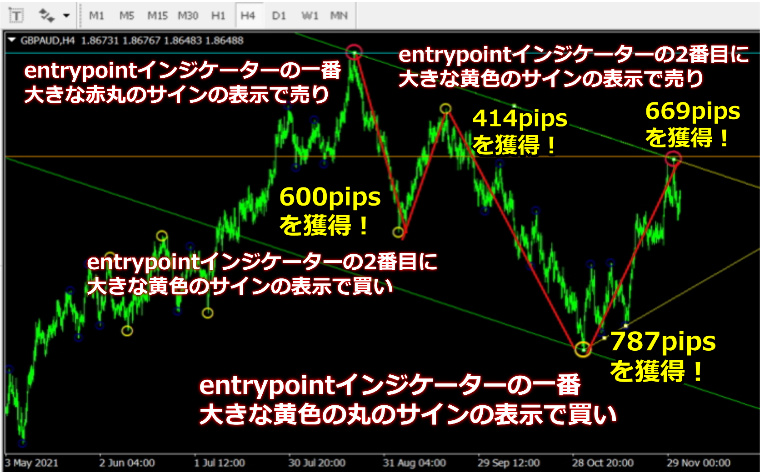
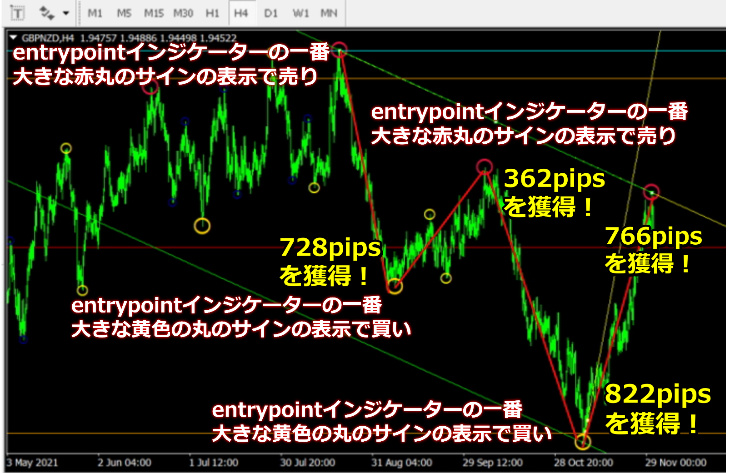
② Bottom/Top Sign Indicator
Bottom/top signs are displayed as circles at major turning points. The largest buy turning point sign and the largest sell turning point sign alternate, so for example when the largest buy turning point sign appears, hold until the largest sell turning point sign appears.
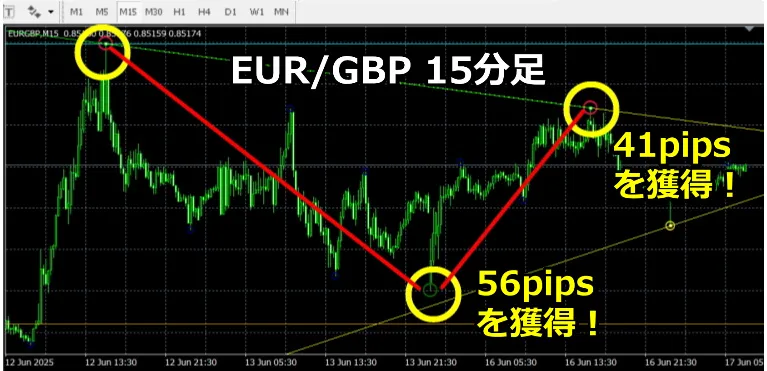
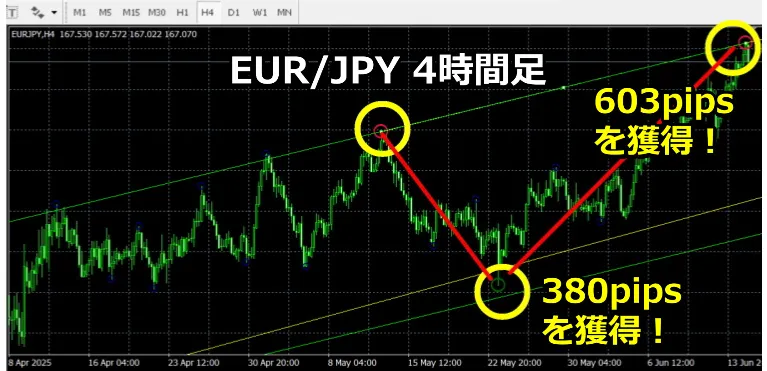
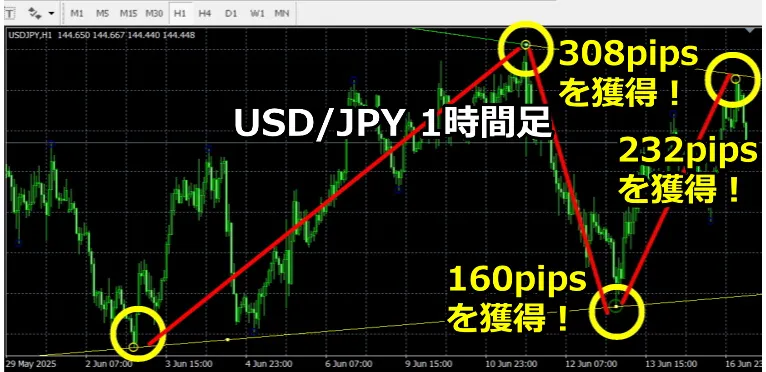
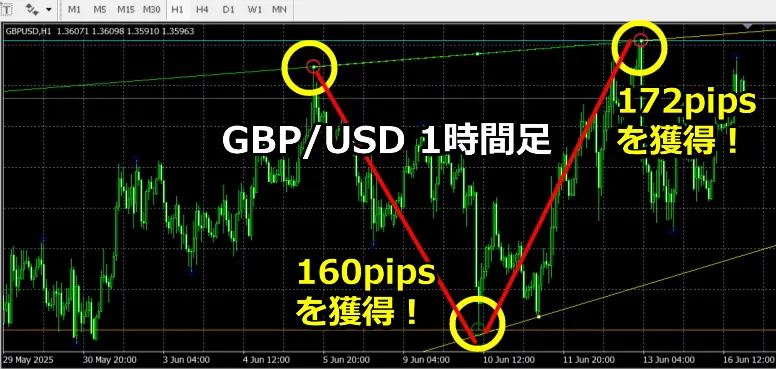
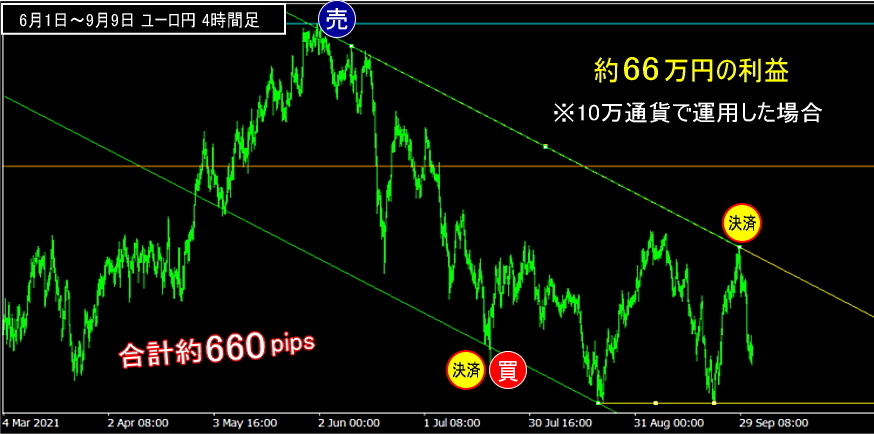
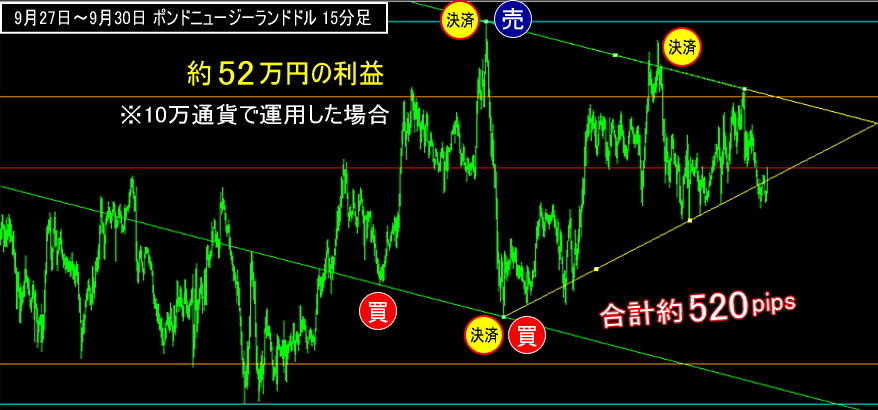
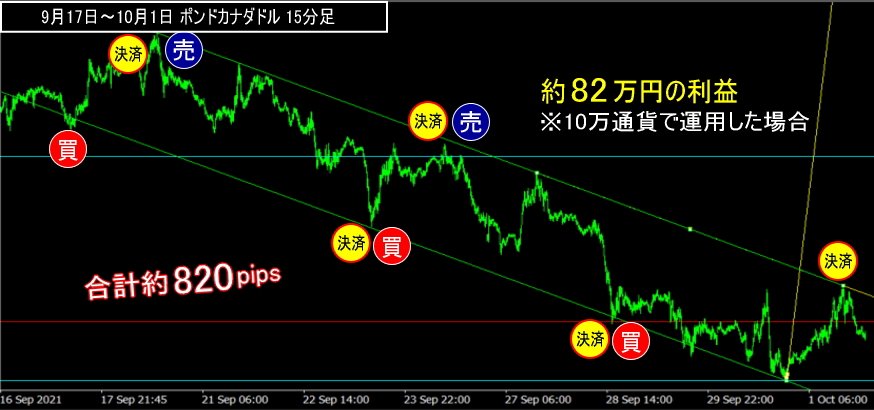
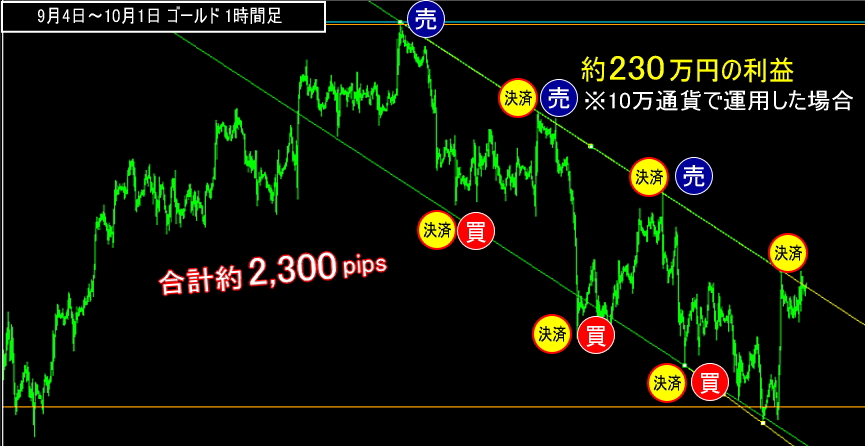
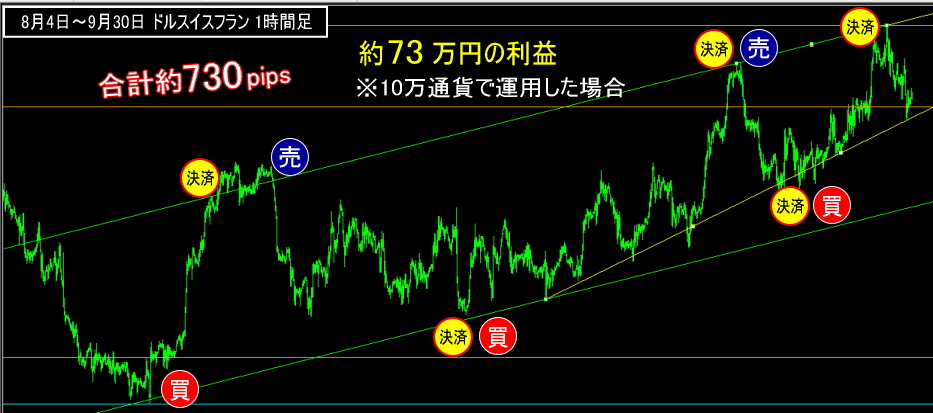
Trading examples: GOLD 4-hour chart
GBP/AUD 4-hour chart
GBP/NZD 4-hour chart
Bottom/Top Sign Indicator performance
Results as of May 2022.
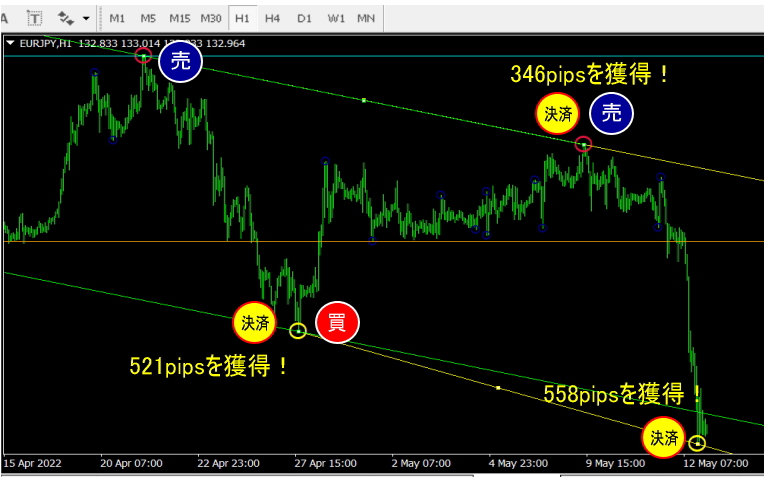
Taking profit on sell and buy signals, a maximum of558 pipsin a single trade!
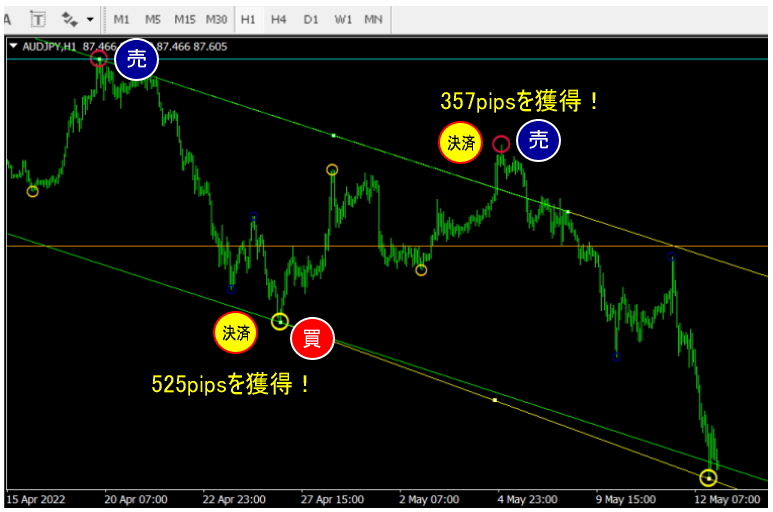
Taking profit on sell and buy signals, a maximum of525 pipsin a single trade.
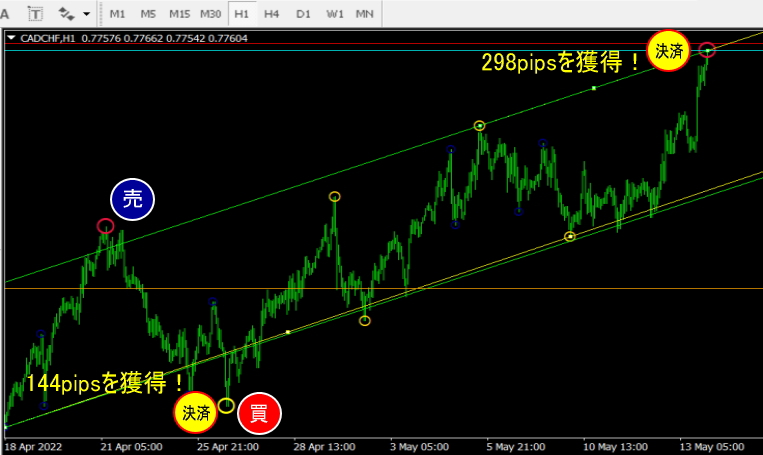
Taking profit on sell and buy signals, a maximum of298 pipsin a single trade.
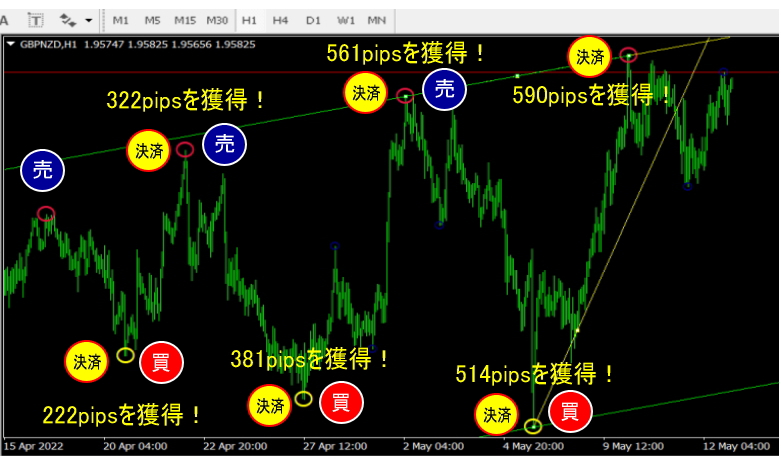
Taking profit on sell and buy signals, a maximum of590 pipsin a single trade.
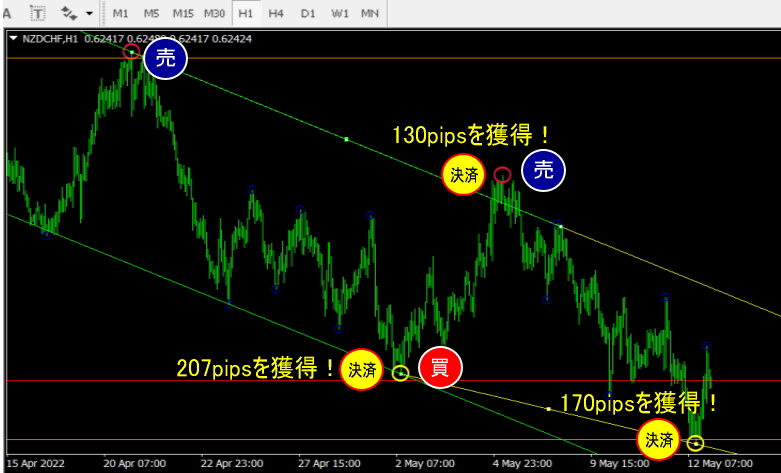
Taking profit on sell and buy signals, a maximum of207 pipsin a single trade.
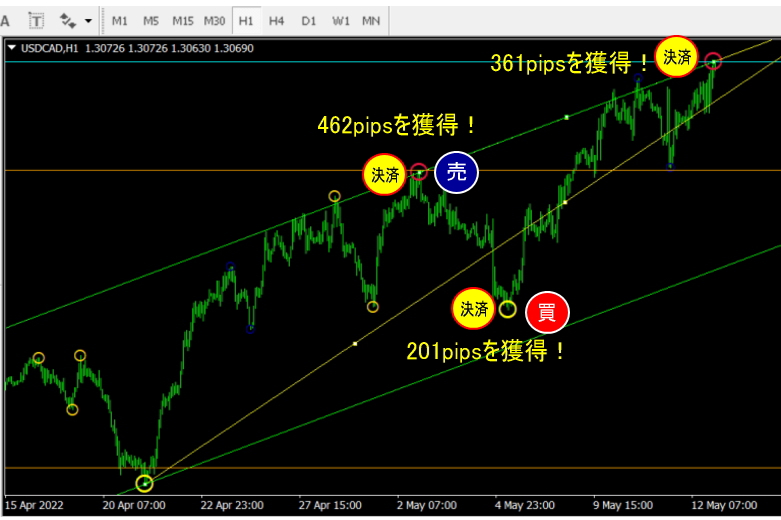
Taking profit on sell and buy signals, a maximum of462 pipsin a single trade!
Purchase here!
https://www.gogojungle.co.jp/tools/indicators/37454
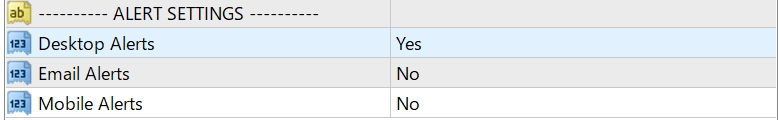
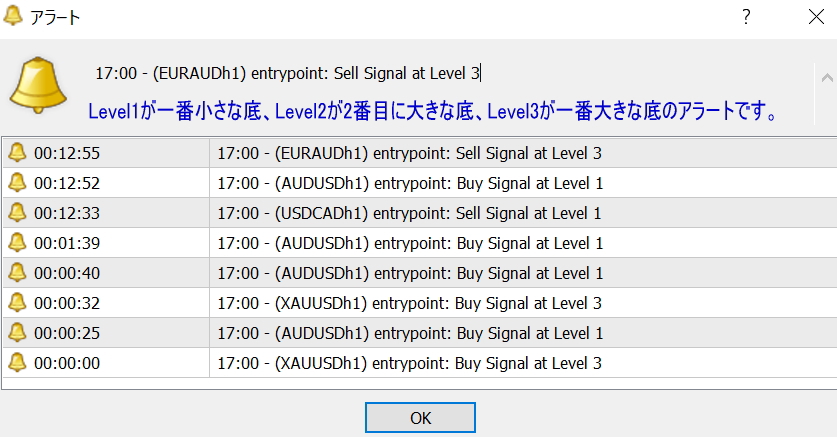
The Bottom Indicator includes an alert function (popup, email notification, smartphone notification) that notifies when signs appear.
【Fits well with these combinations】
On one MT4 screen, these indicators can be displayed together, and the following combinations are recommended.
①https://www.gogojungle.co.jp/tools/indicators/37692
“Breakout Outline” detects points where large trends begin!
②https://www.gogojungle.co.jp/tools/indicators/38003
“Channel line indicator that can ride the trend” lets you ride upward (or downward) trends to capture large pips!
【Frequently Asked Questions】
Q: Can beginners use this tool to make money?
A: It significantly increases the chance of profitability. It is recommended to enter at the moment the largest bottom/top sign appears, or when a candle touches the top or bottom of the channel line.
Q: Is any time frame suitable for trading?
A: Yes.
Q: Can I use this with any brokerage?
A: If the broker supports MT4, basically you can use it anywhere.
Q: Can this be used for scalping?
A: 1-minute to 5-minute = scalping, 15-minute = day trading, 1-hour to 4-hour = day trading or swing, daily = swing; usable on any timeframe.
Q: I’m considering using this product together with“The Ultimate Sell Signal Indicator” which can sometimes yield 600+ pips in one go!https://www.gogojungle.co.jp/tools/indicators/38800)
What do you think about this combination?
A: Yes, when the yellow box appears followed by a large arrow signaling entry, it acts as a filter for selective entries, and this combination is a good pairing.
Q: The manual covers line meanings; what about other marks?
Please explain the meaning and usage of each color circle (brown large, green large, yellow medium, blue small).
A: Brown large circle and green large circle indicate a major turning point; yellow medium circle and blue small circle indicate smaller turning points.Basically, use brown and green large circles as references.
Q: Is this indicator buffer-type or object-type? Can it be used for binary options?A: This is an object-type indicator. It can be used with binary options.
https://www.gogojungle.co.jp/tools/indicators/37454
If you join the free online community within Gogojungle’s My Page, we would be grateful.