

【March 6, 2026】Heaven and Earth Series 3 Types × Chart Verification (EURUSD)
This time is a continuation of the previous article. For environmental recognition, the Deisuing chart, and Prime Combo Signal will be mainly explained.
・ Voices of people who actually used Prime Combo Signal
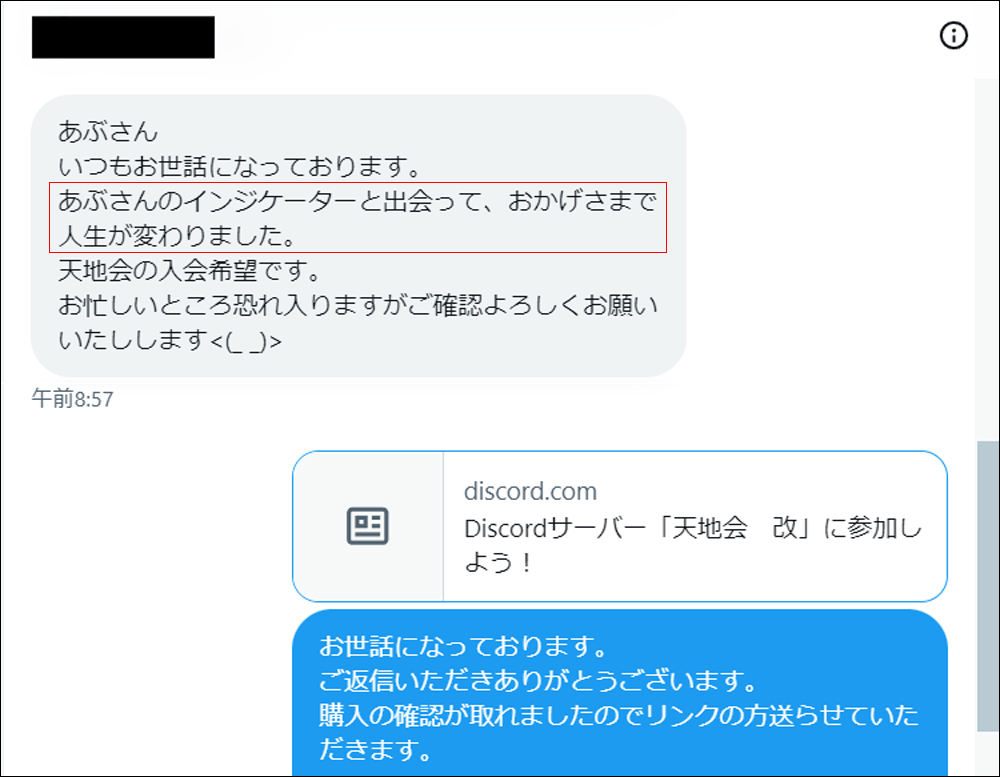
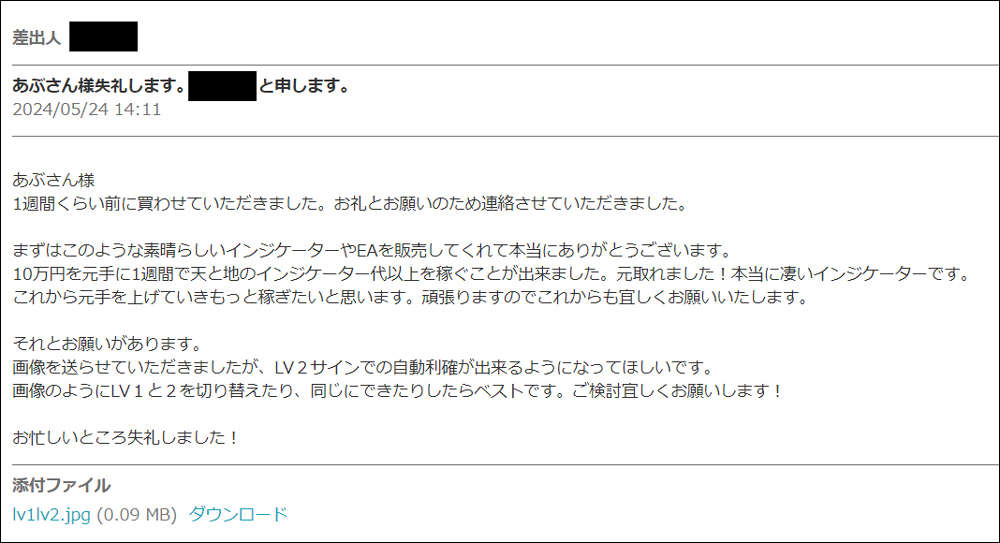
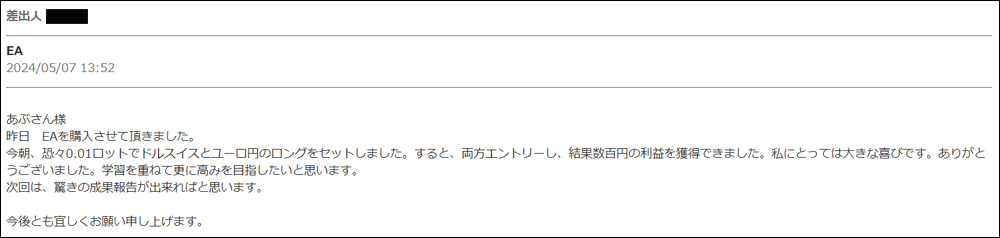
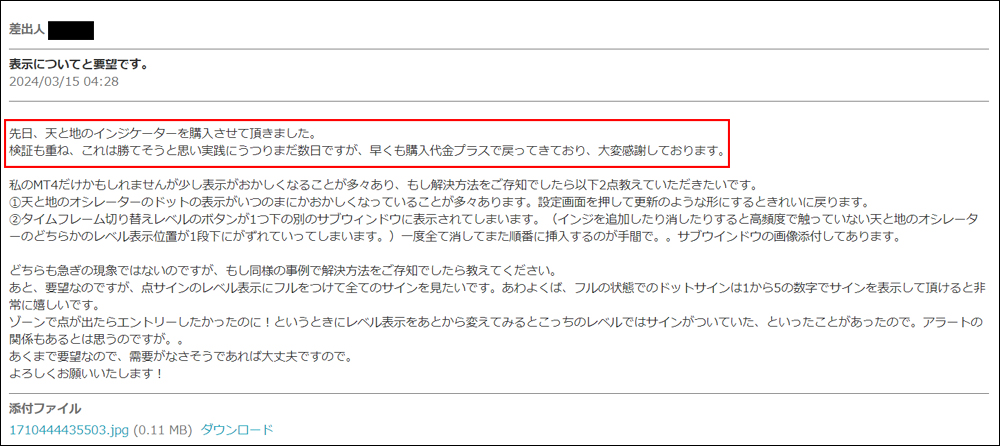
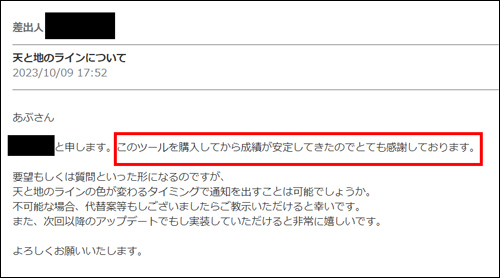
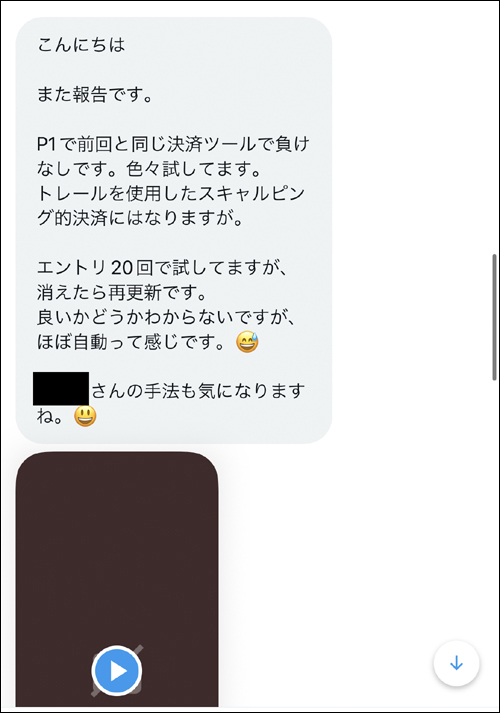
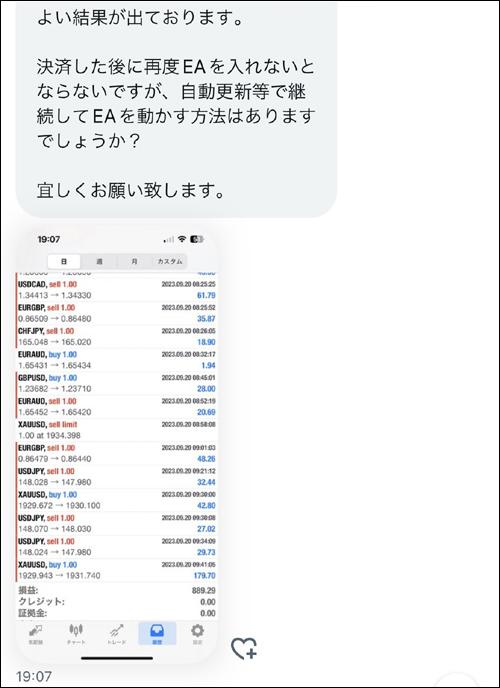
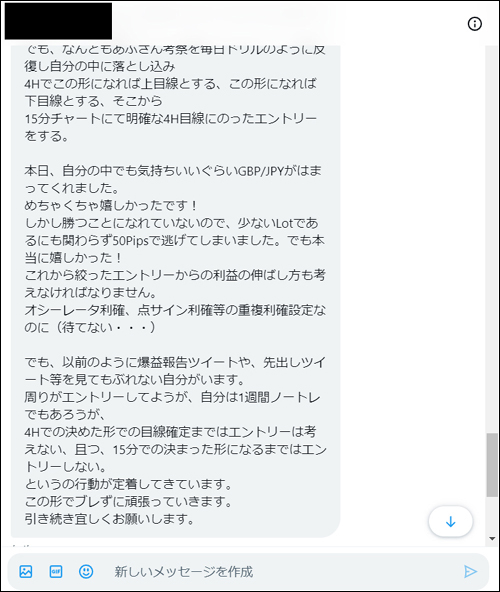
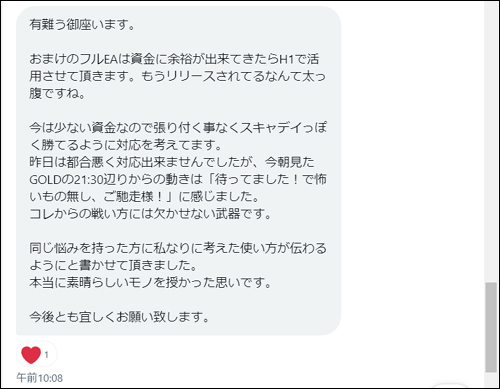
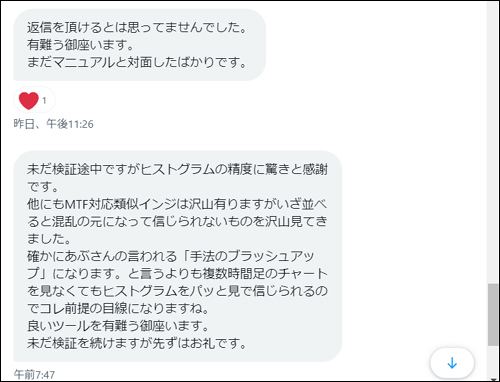
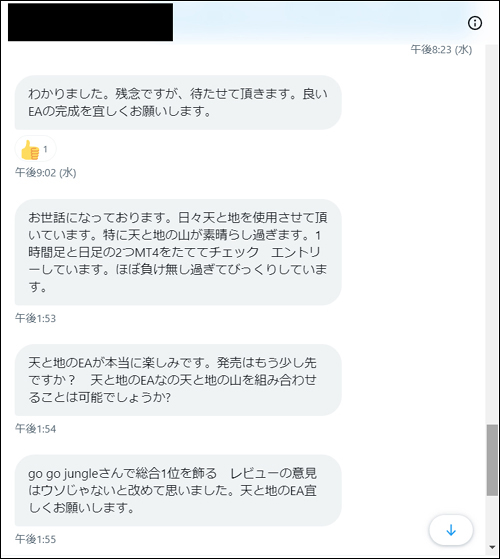


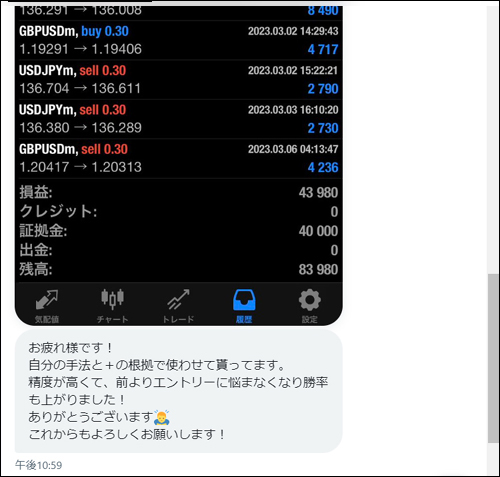
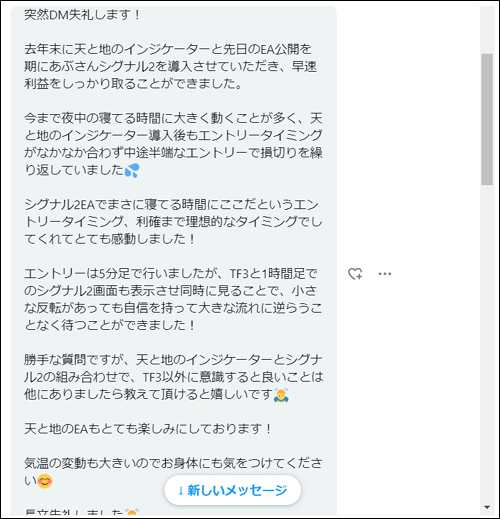
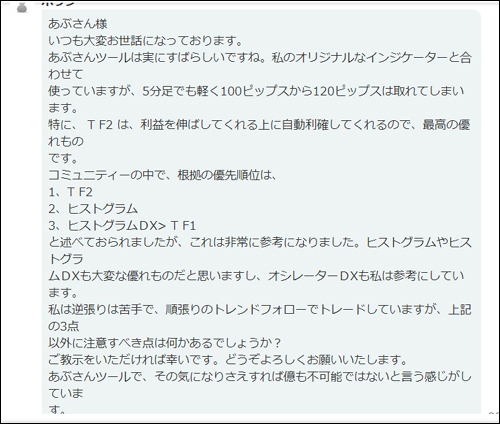
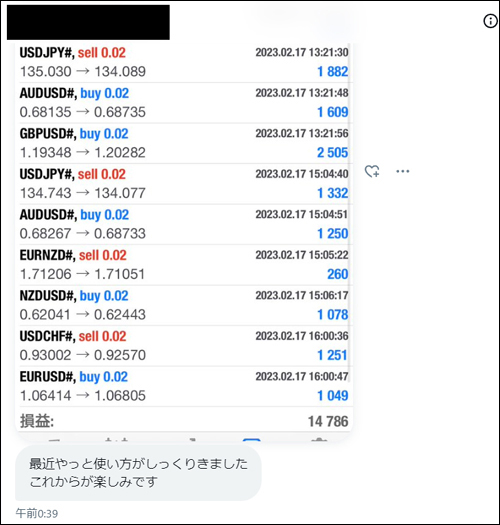
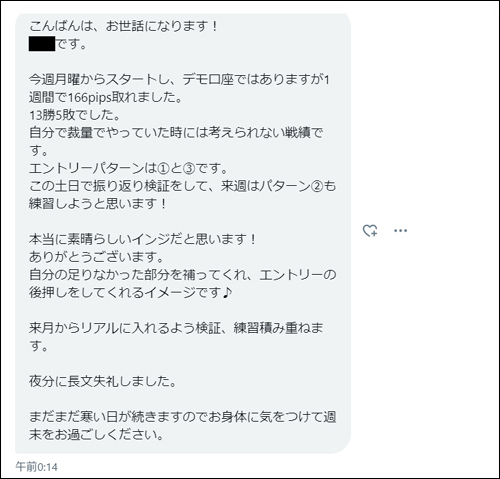
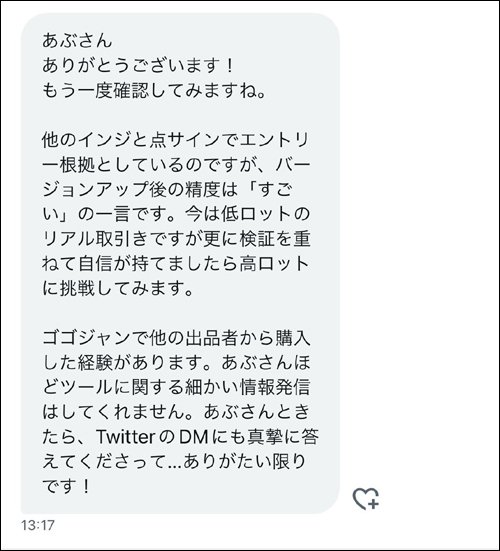
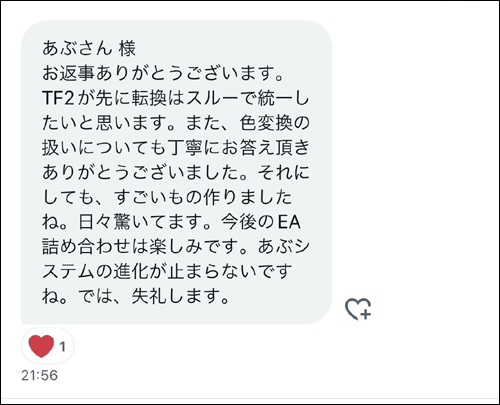
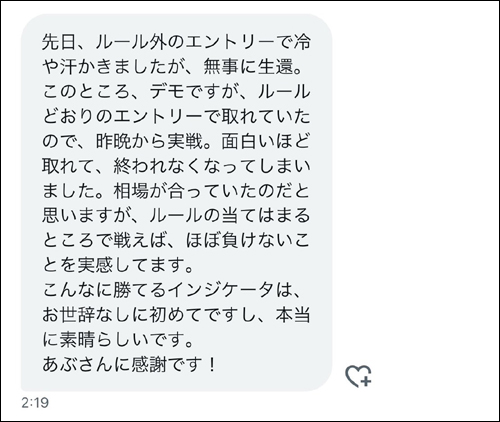
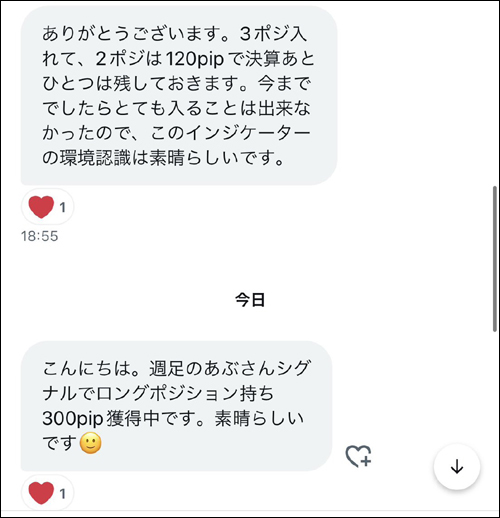
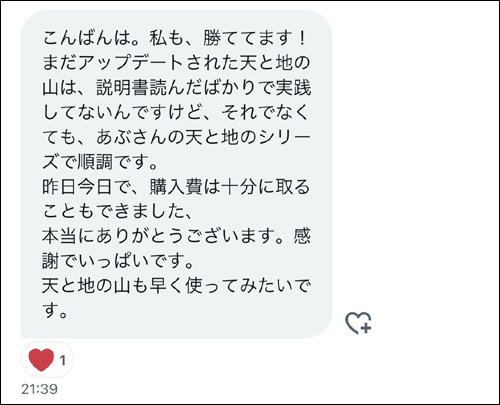
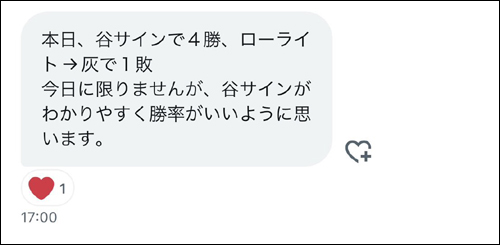
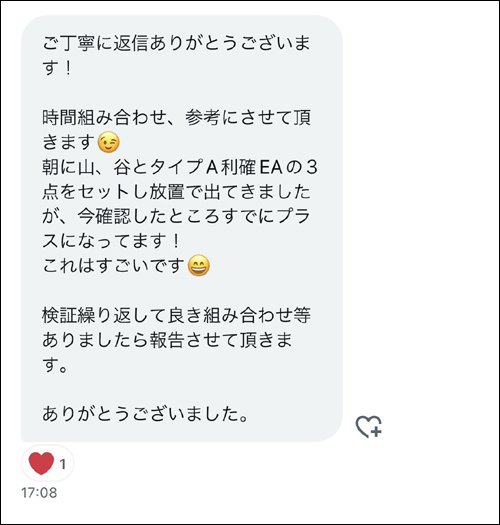
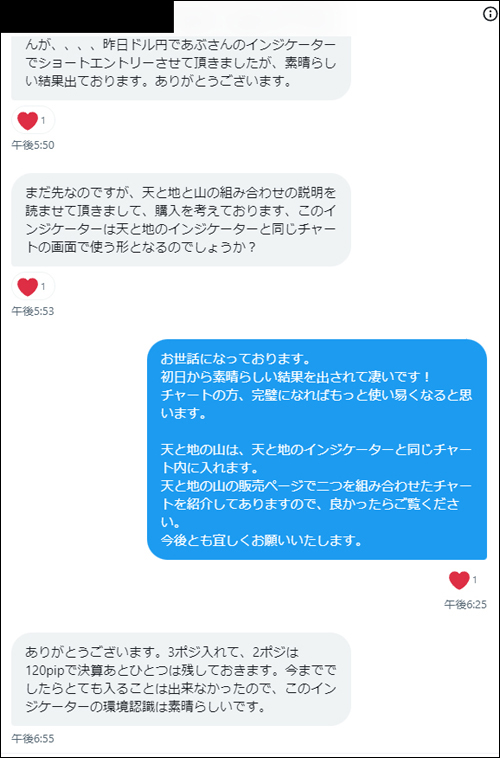
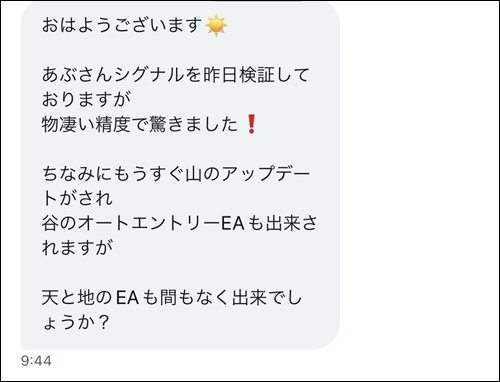
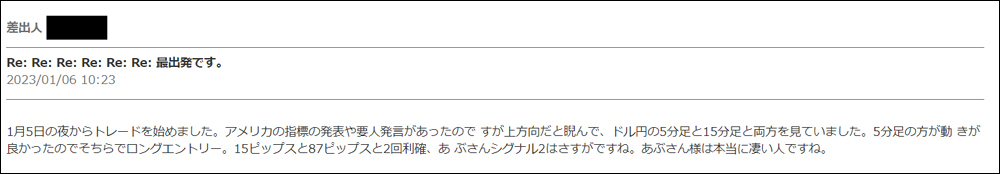
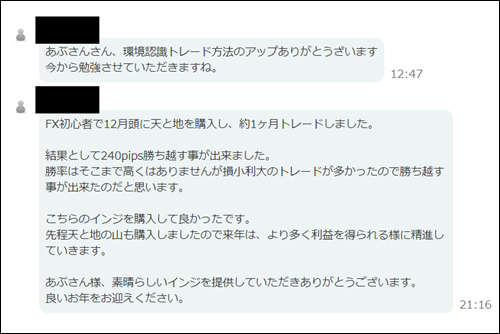
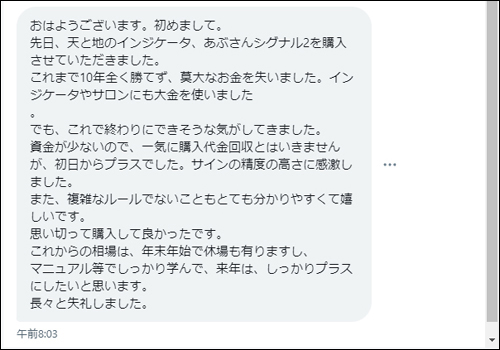
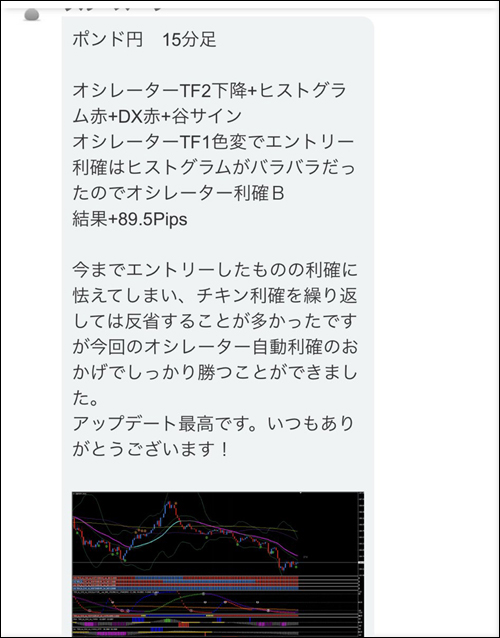
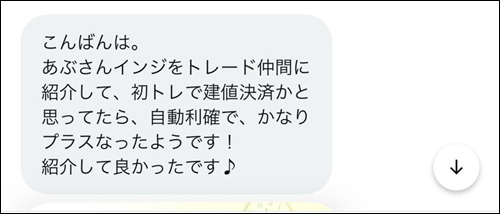
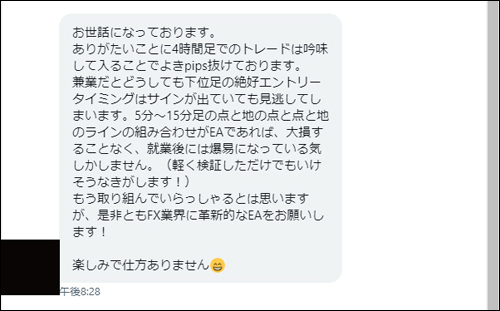
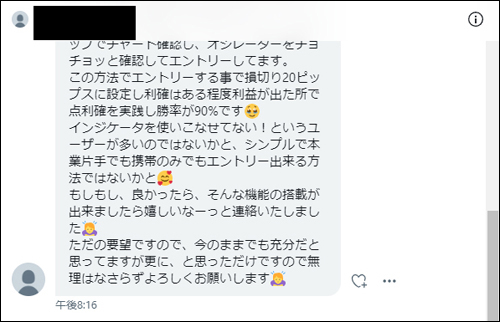
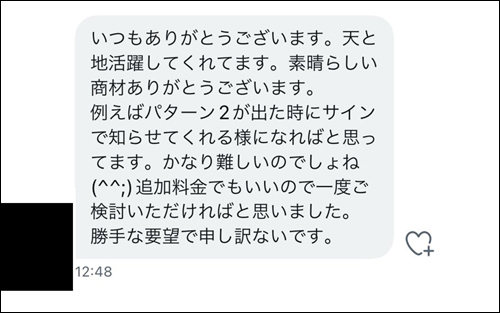
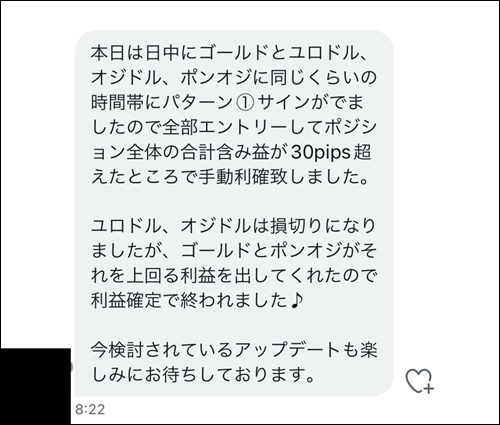
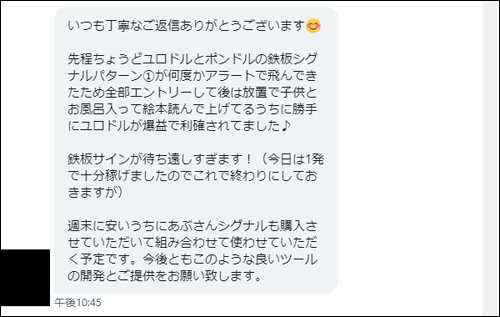
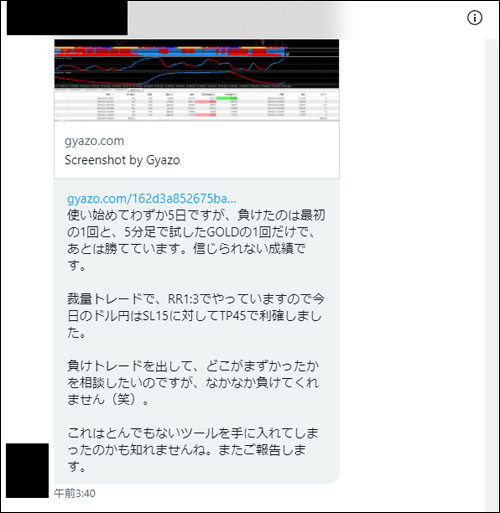
・In articles linked below, we introduce valuable DMs, reviews, posts from users and monitors. We carefully select winning reports and other useful messages, so I’m sure they will be helpful for everyone. We update periodically, so please take a moment to read when you have time.
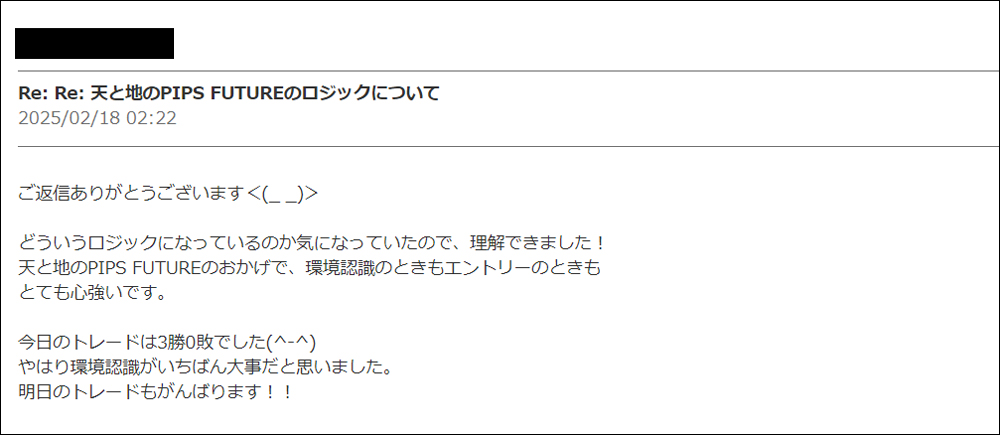
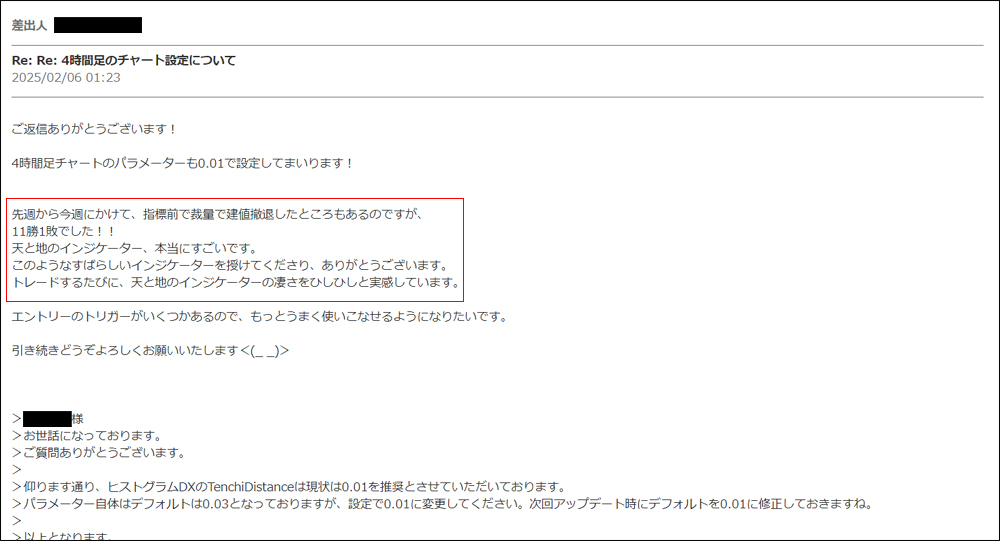
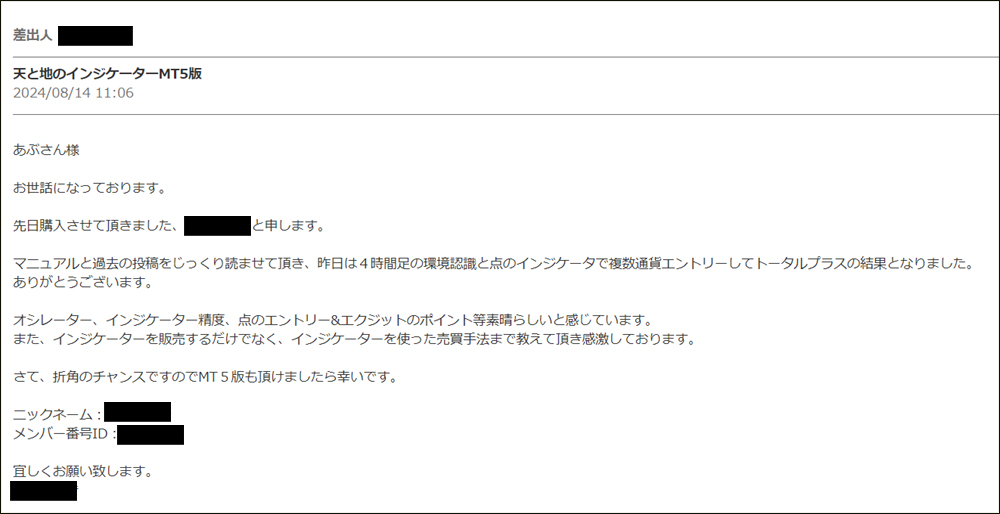
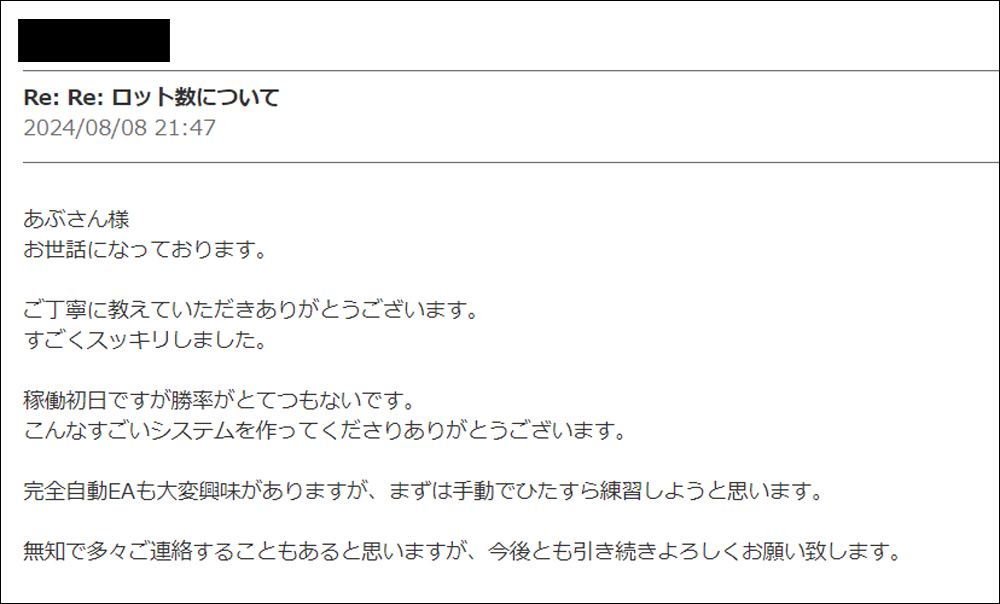
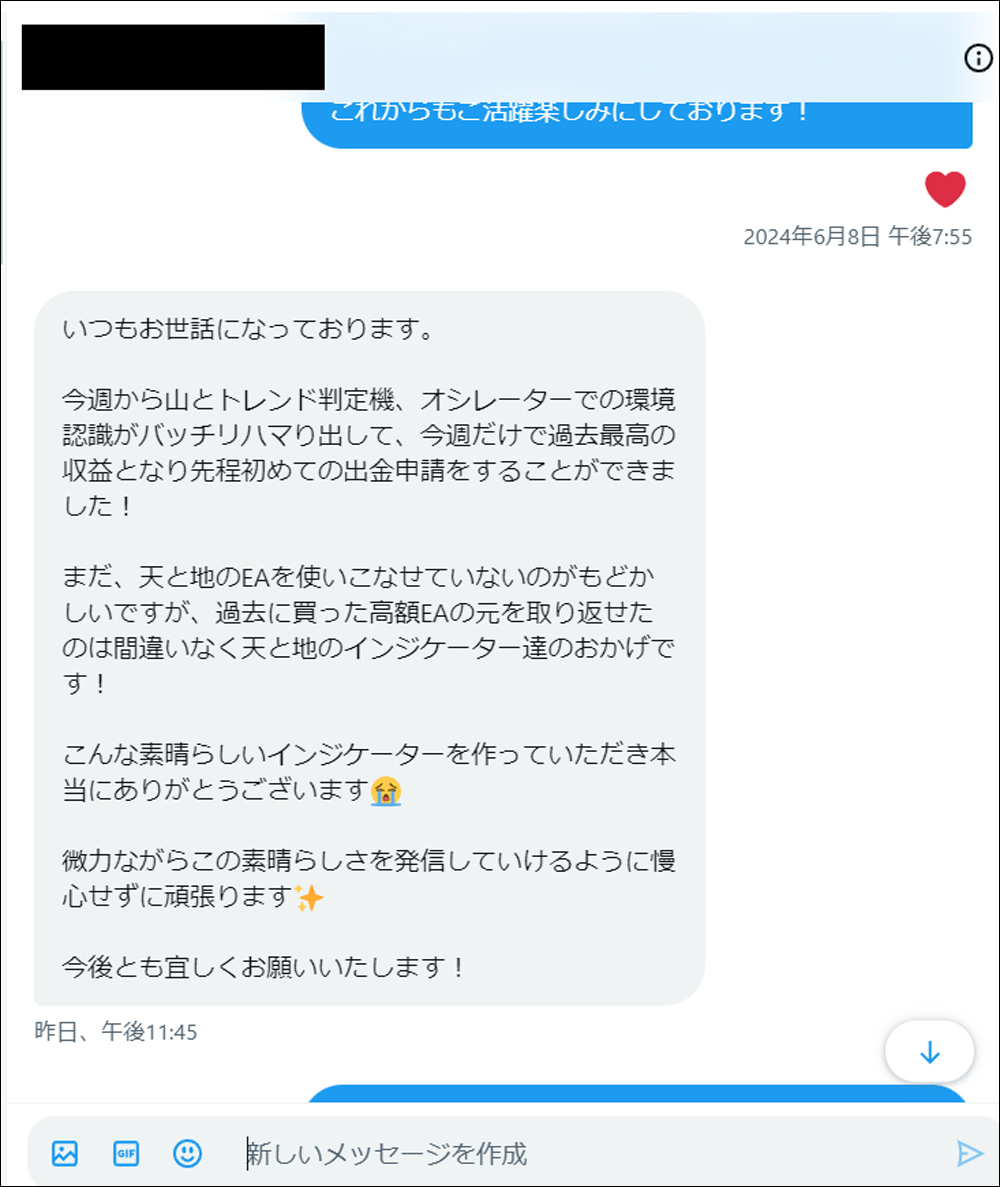
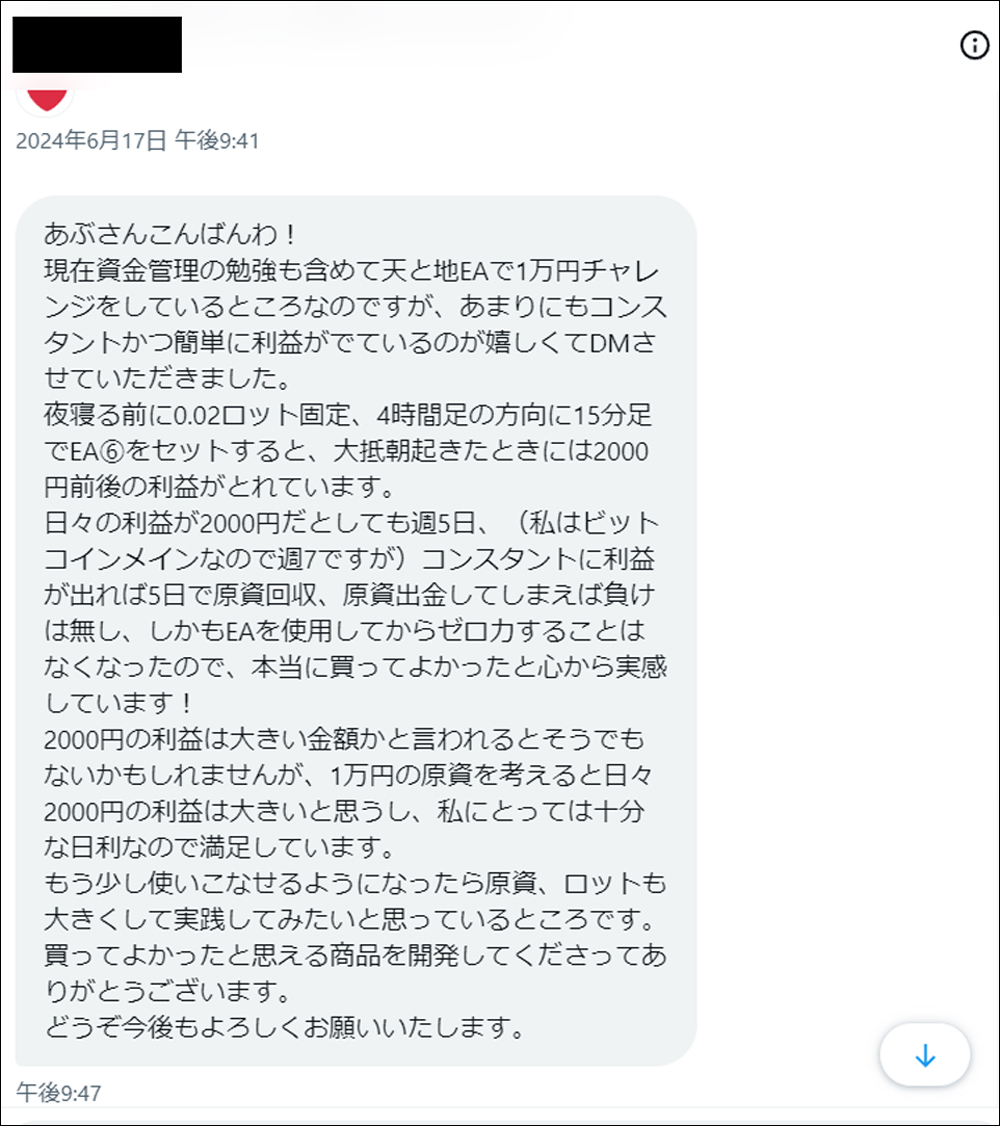
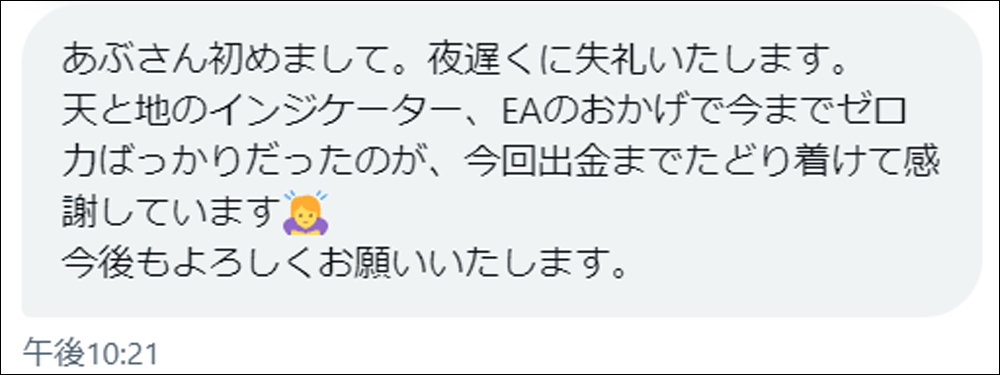
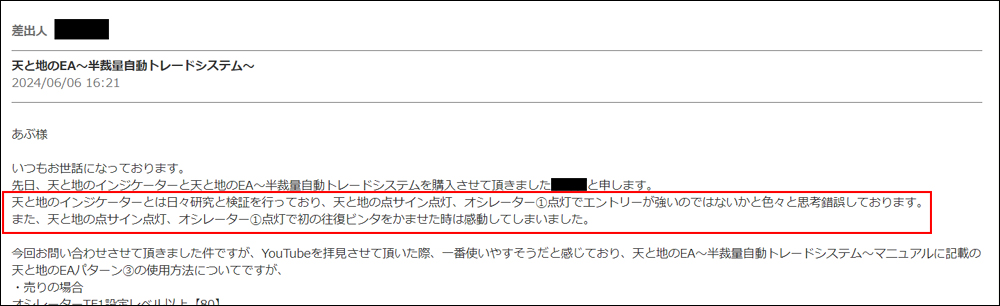
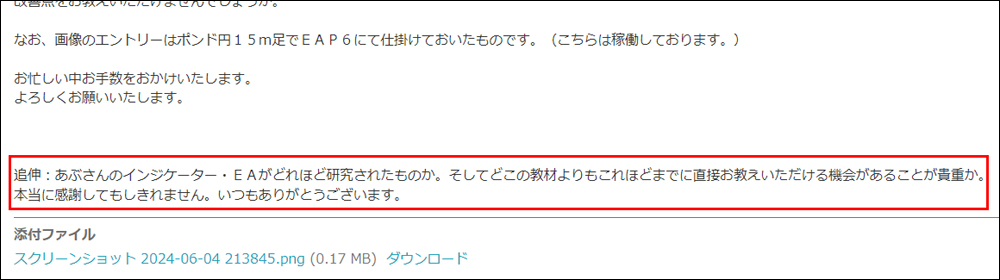
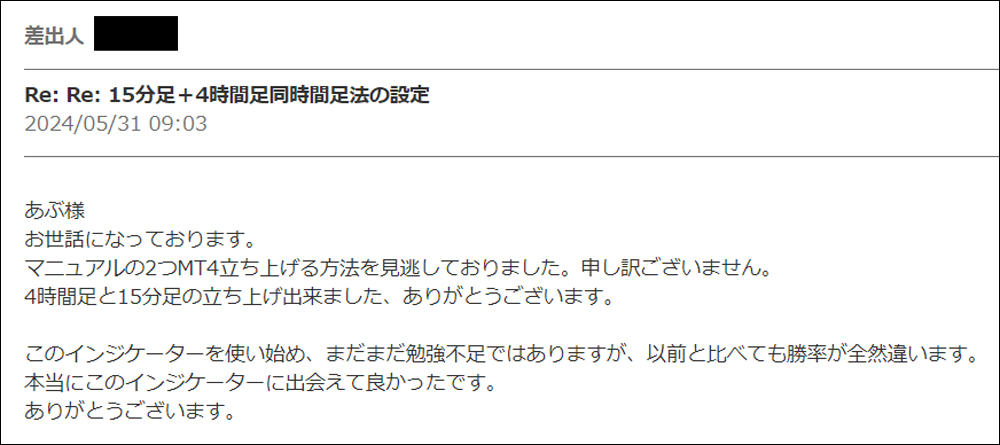
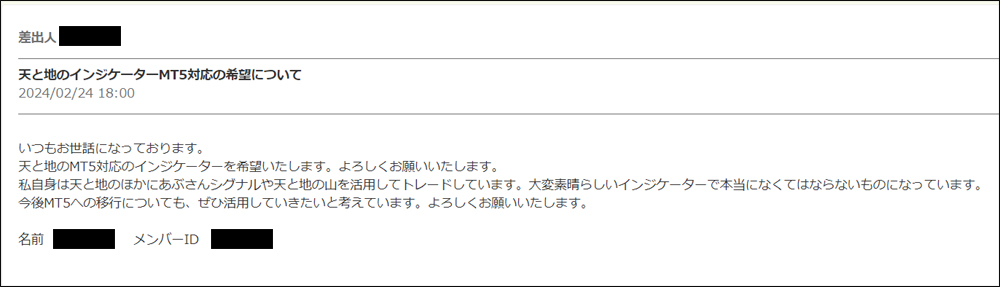
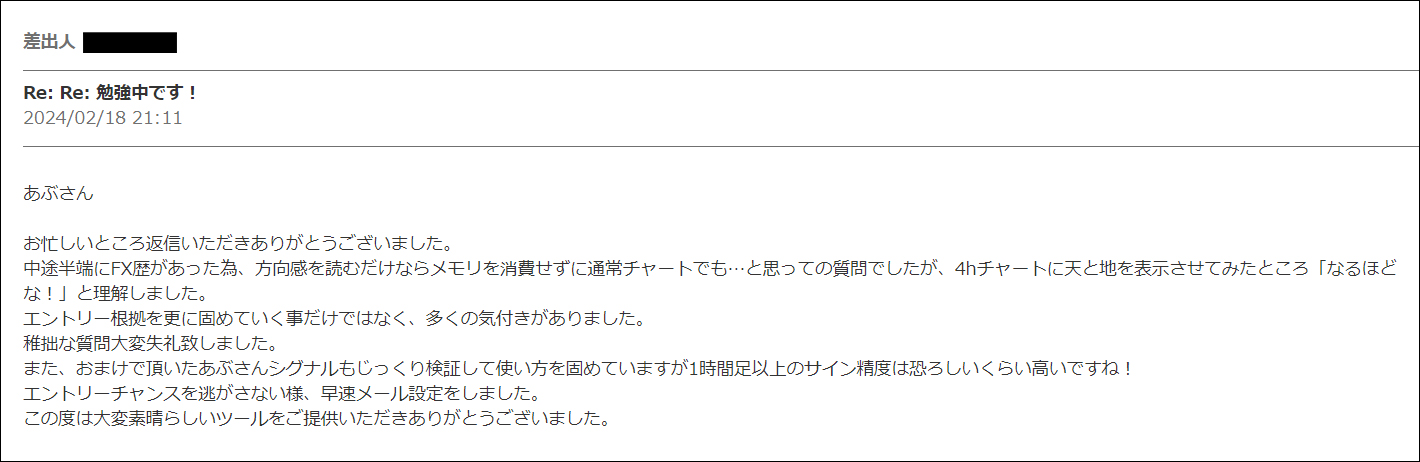
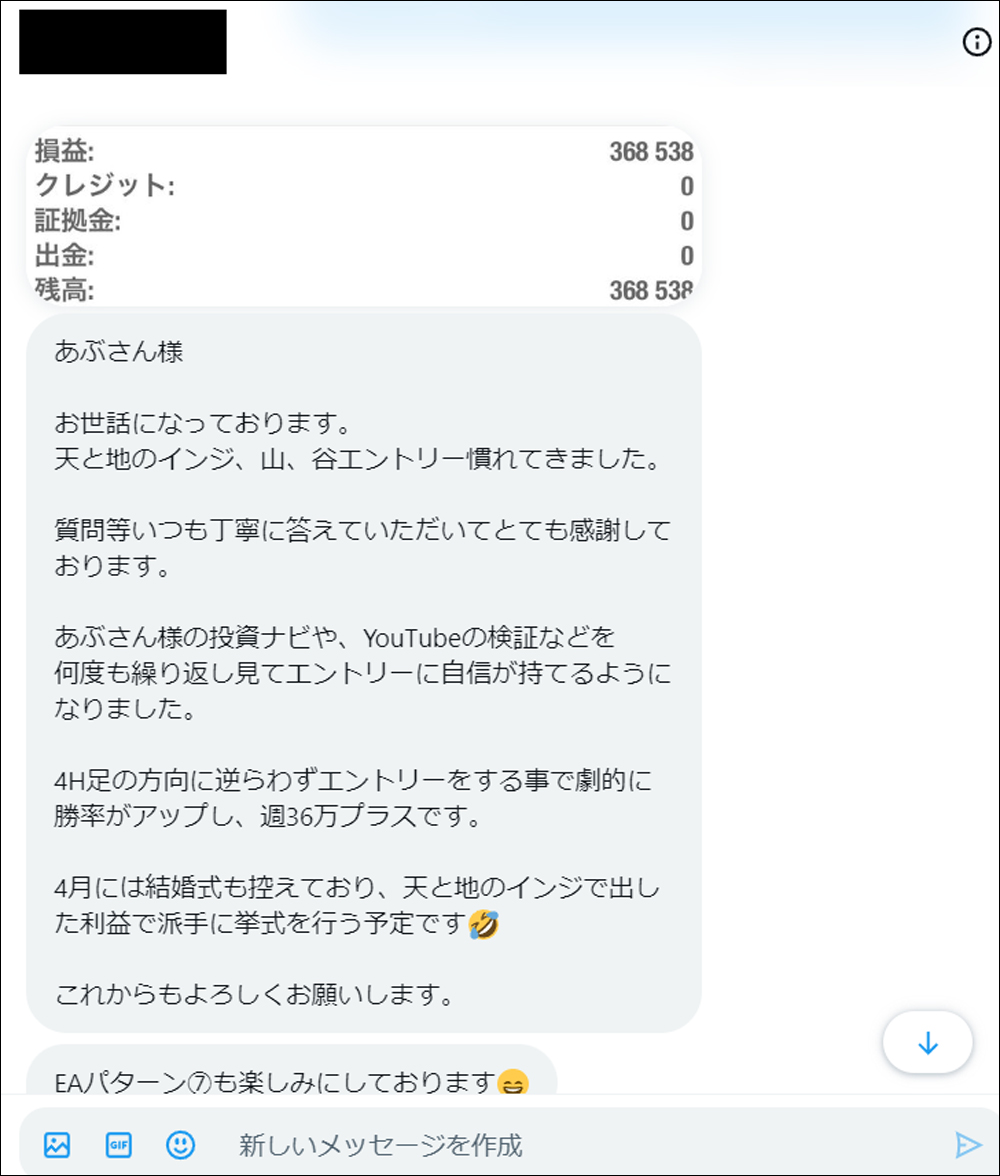
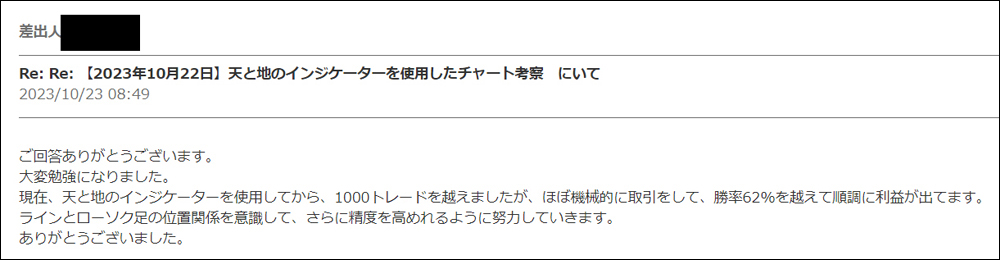
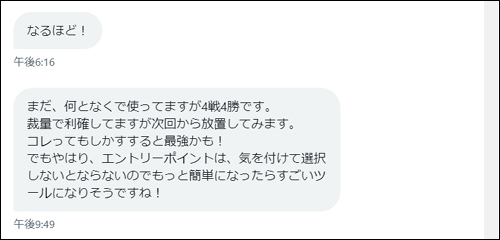
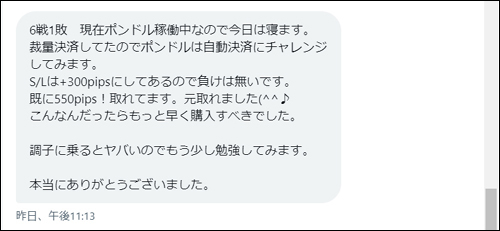
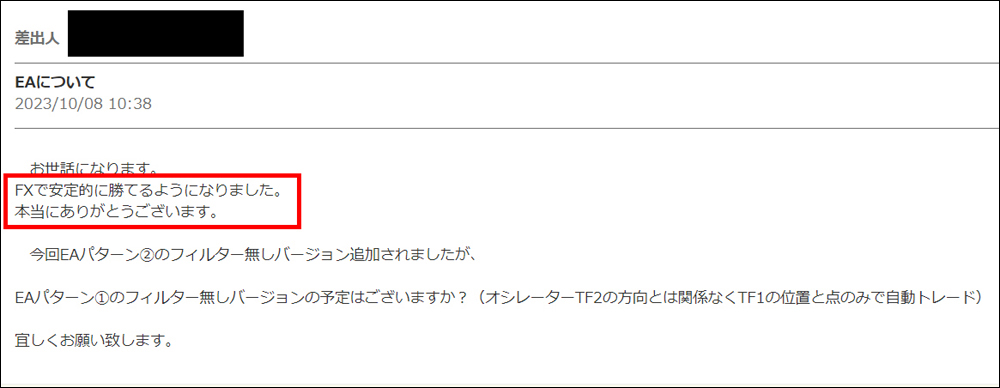
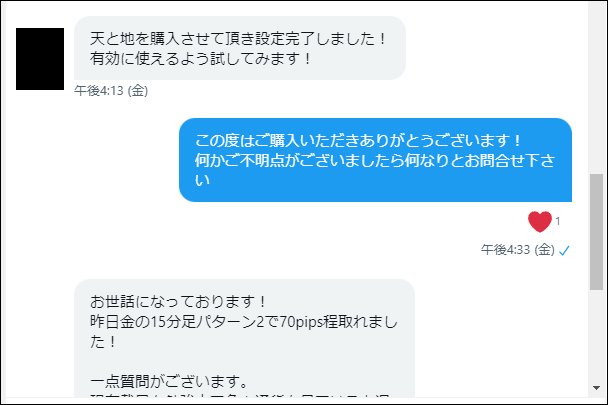
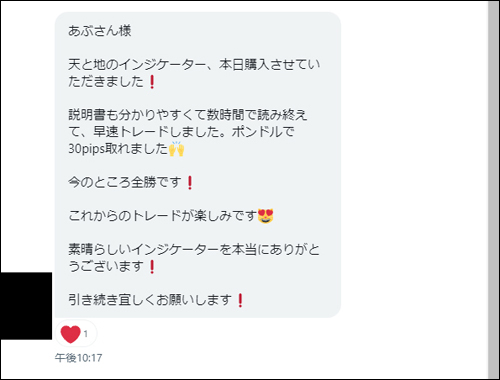
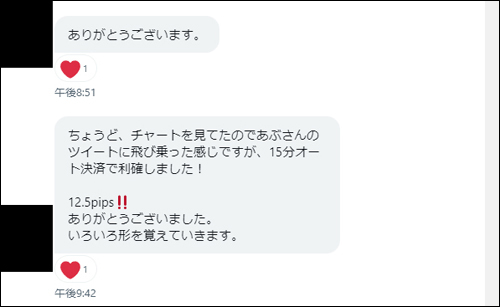
・Impressions (review version) from users who actually used Ten to Chi Indicators
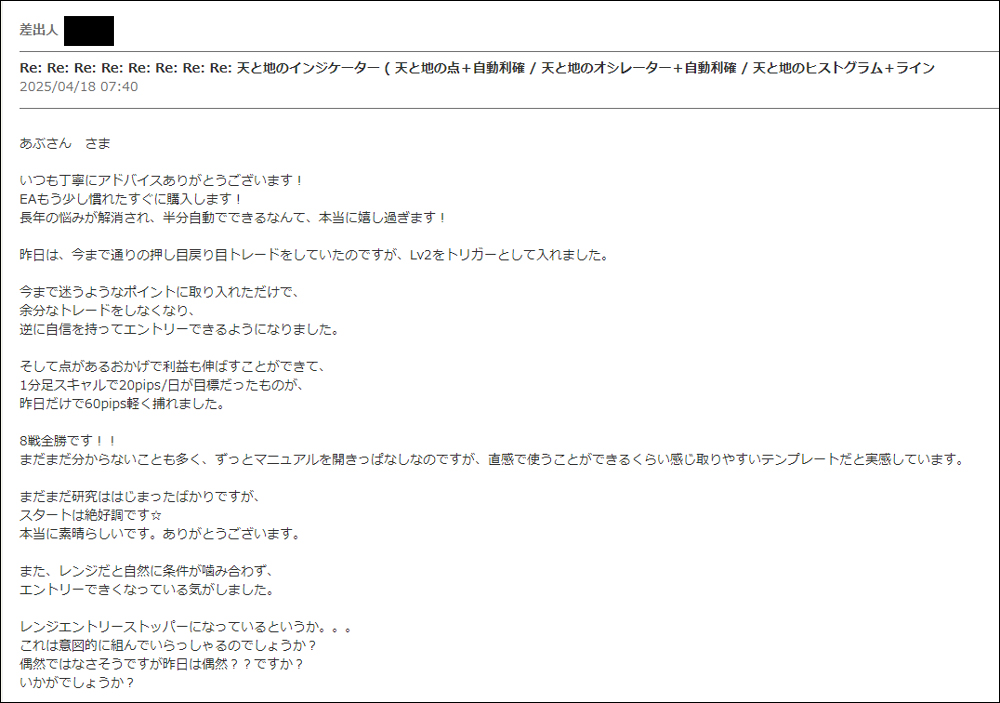
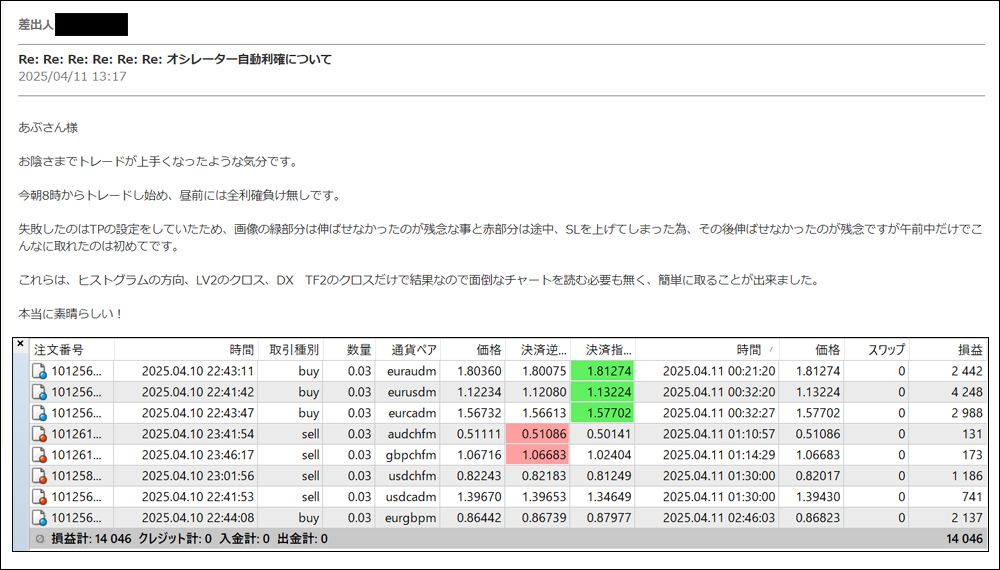
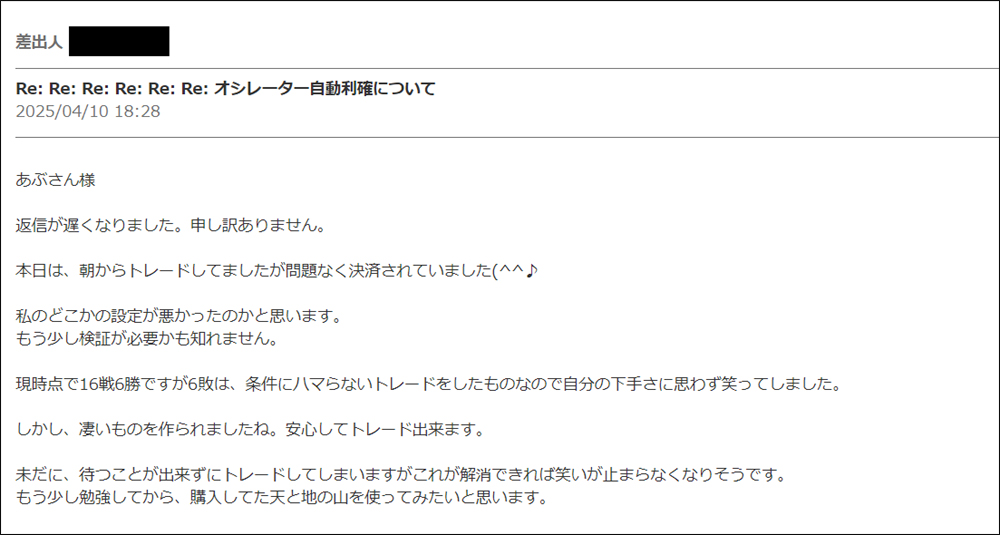
・Impressions (DM version) from users who actually used Ten to Chi Indicators
・“I searched for #Ten to Chi Indicator”
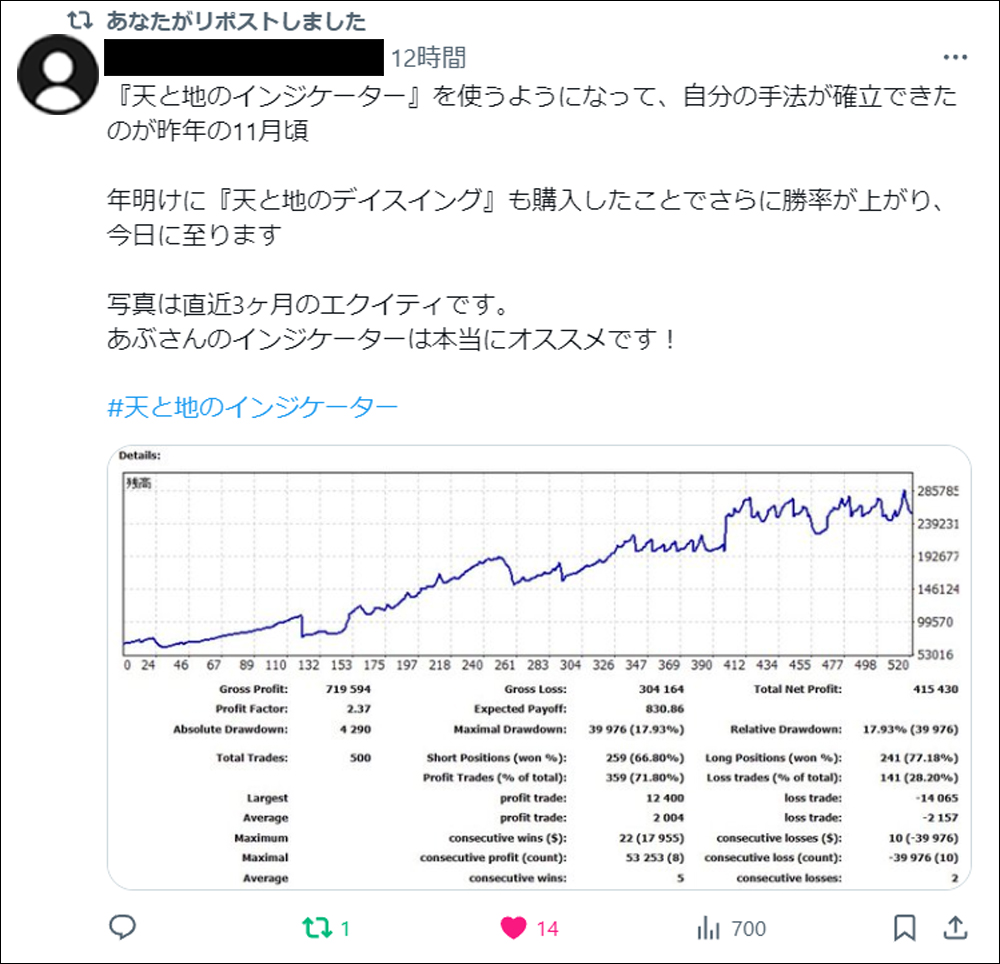
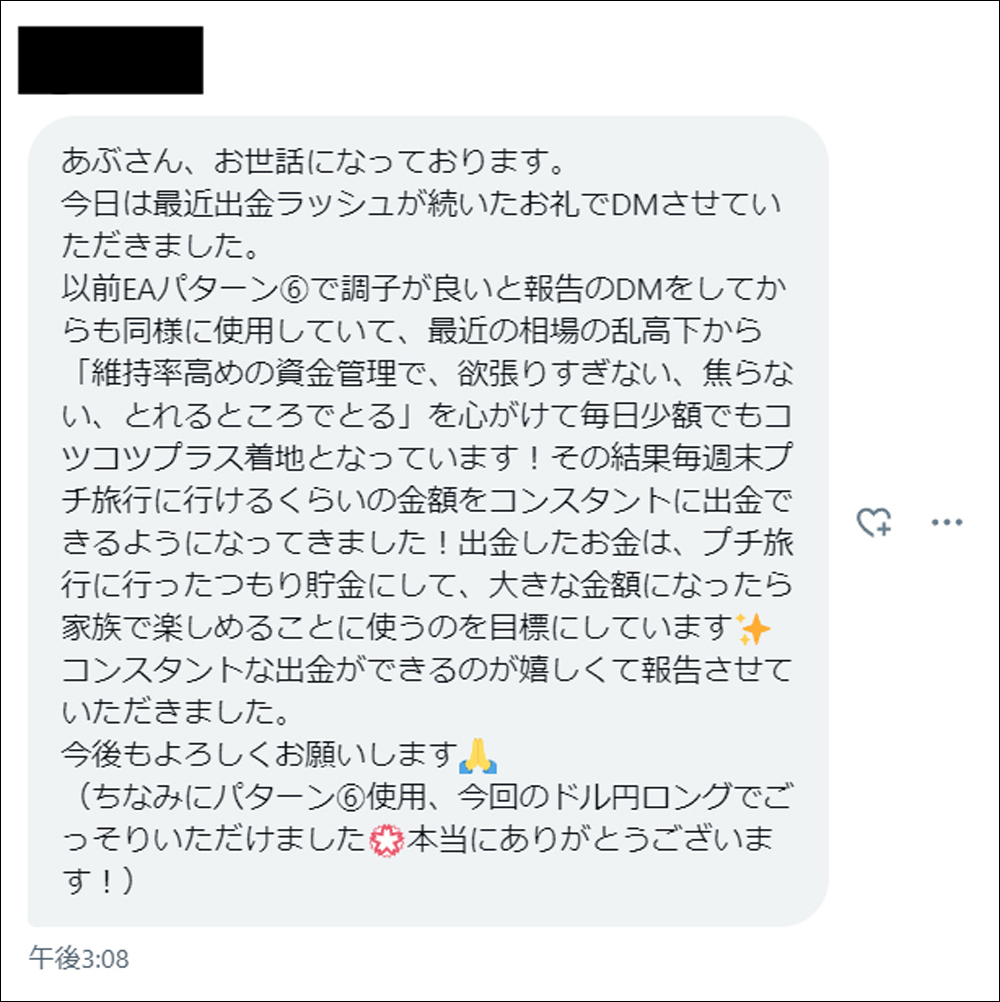
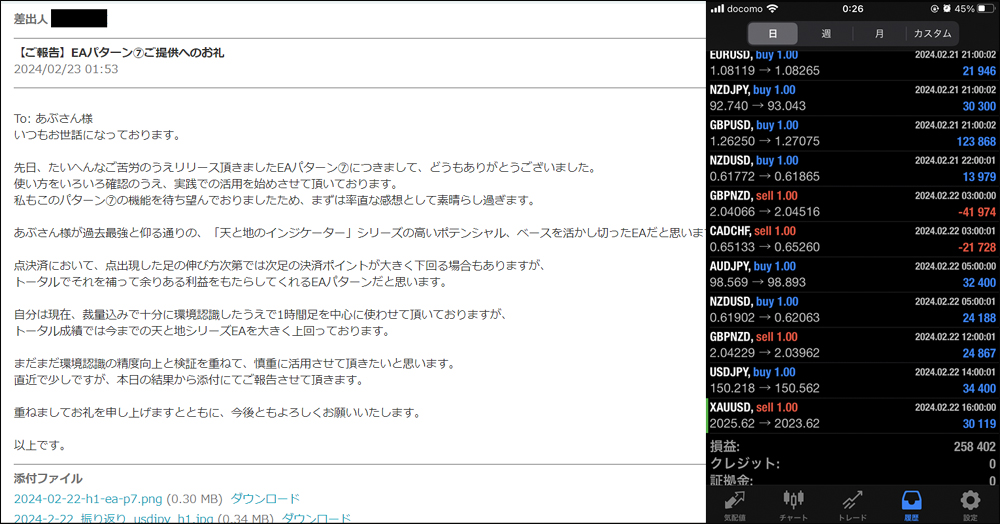
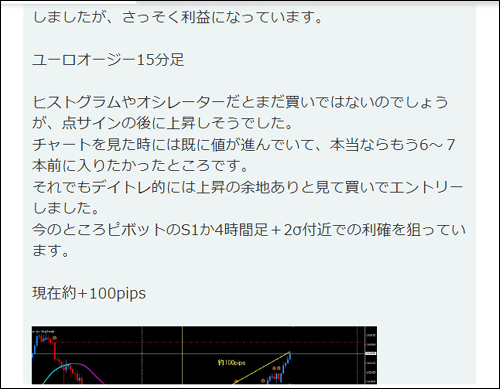
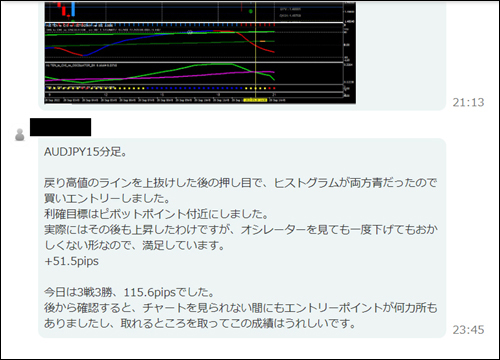
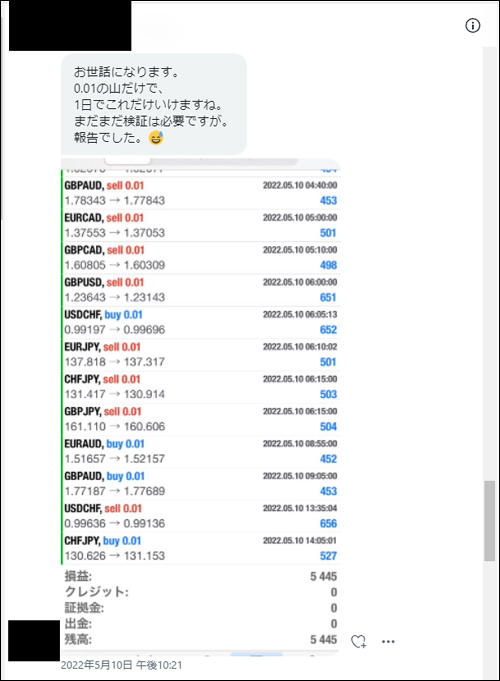
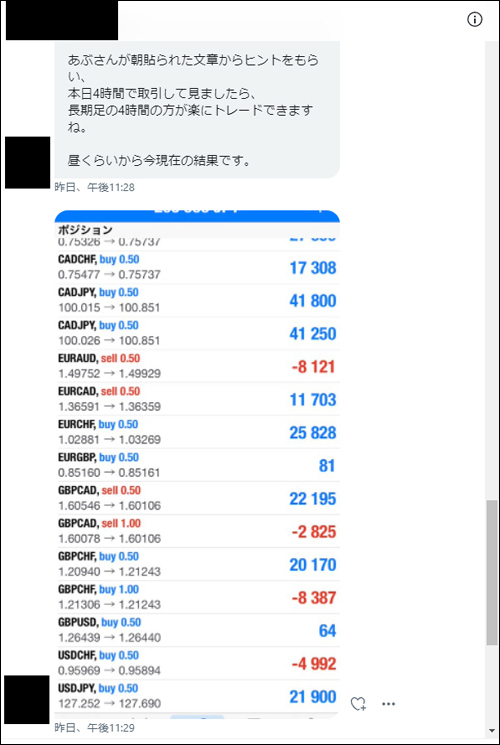
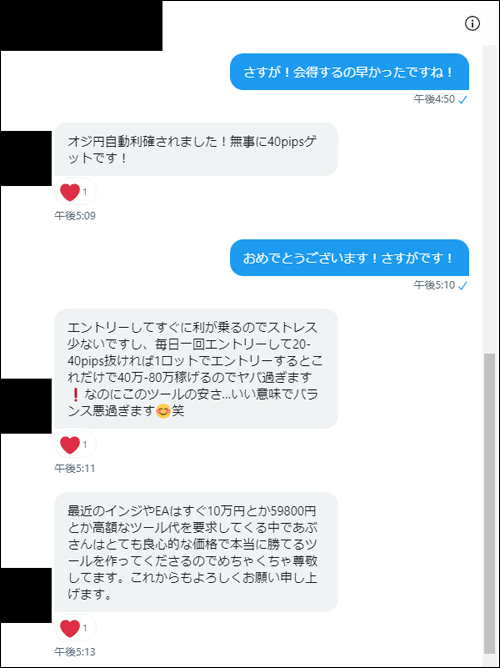
・Introducing posts from monitors who actually used Ten to Chi Deisuing
・Impressions, etc., from users who actually used Ten to Chi Deisuing
・“I searched for #Ten to Chi Deisuing”

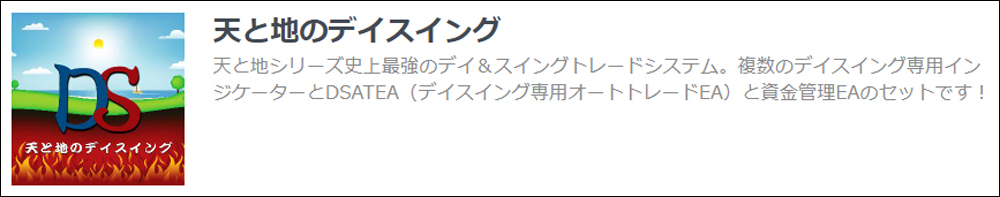
・ Ten to Chi Indicator is a trading method using the original indicator I, Abusan, released in February 2022. Thanks to everyone's support,「GogoJungle Award 2022, 2023, 2024, 2025 has been awarded for four consecutive years.
・In this article,“Ten to Chi Indicator” is used to examine and discussthe method calledTen to Chi Deisuing. In addition, we will also explain the entry trigger, “Prime Combo Signal.”
For the basic trading method of Ten to Chi Indicator, please refer toarticles before August 2024.
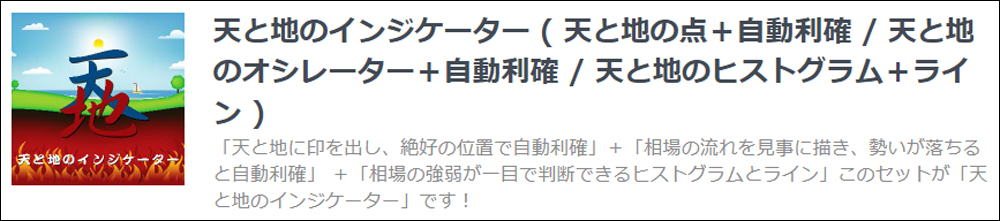
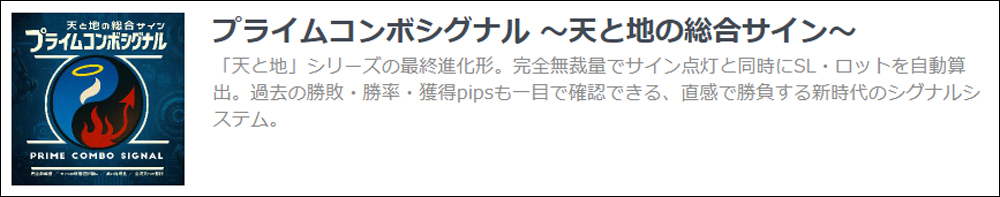
The two systems I actually operate, “Ten to Chi Deisuing” and “Prime Combo Signal,” are a complete full set of tools assembled without any compromise. It is not a collection of separate indicators. It is a single, fully developed strategy. This is all of my trading.
【Abu-san / Special Video Vol.1】 Users exceed 3,200! Are you still trading FX without Ten to Chi? Why not earn while taking it easy?
【Abu-san / Special Video Vol.2】 Skill gap? No, gear gap. If you don’t use this, the gap is huge.

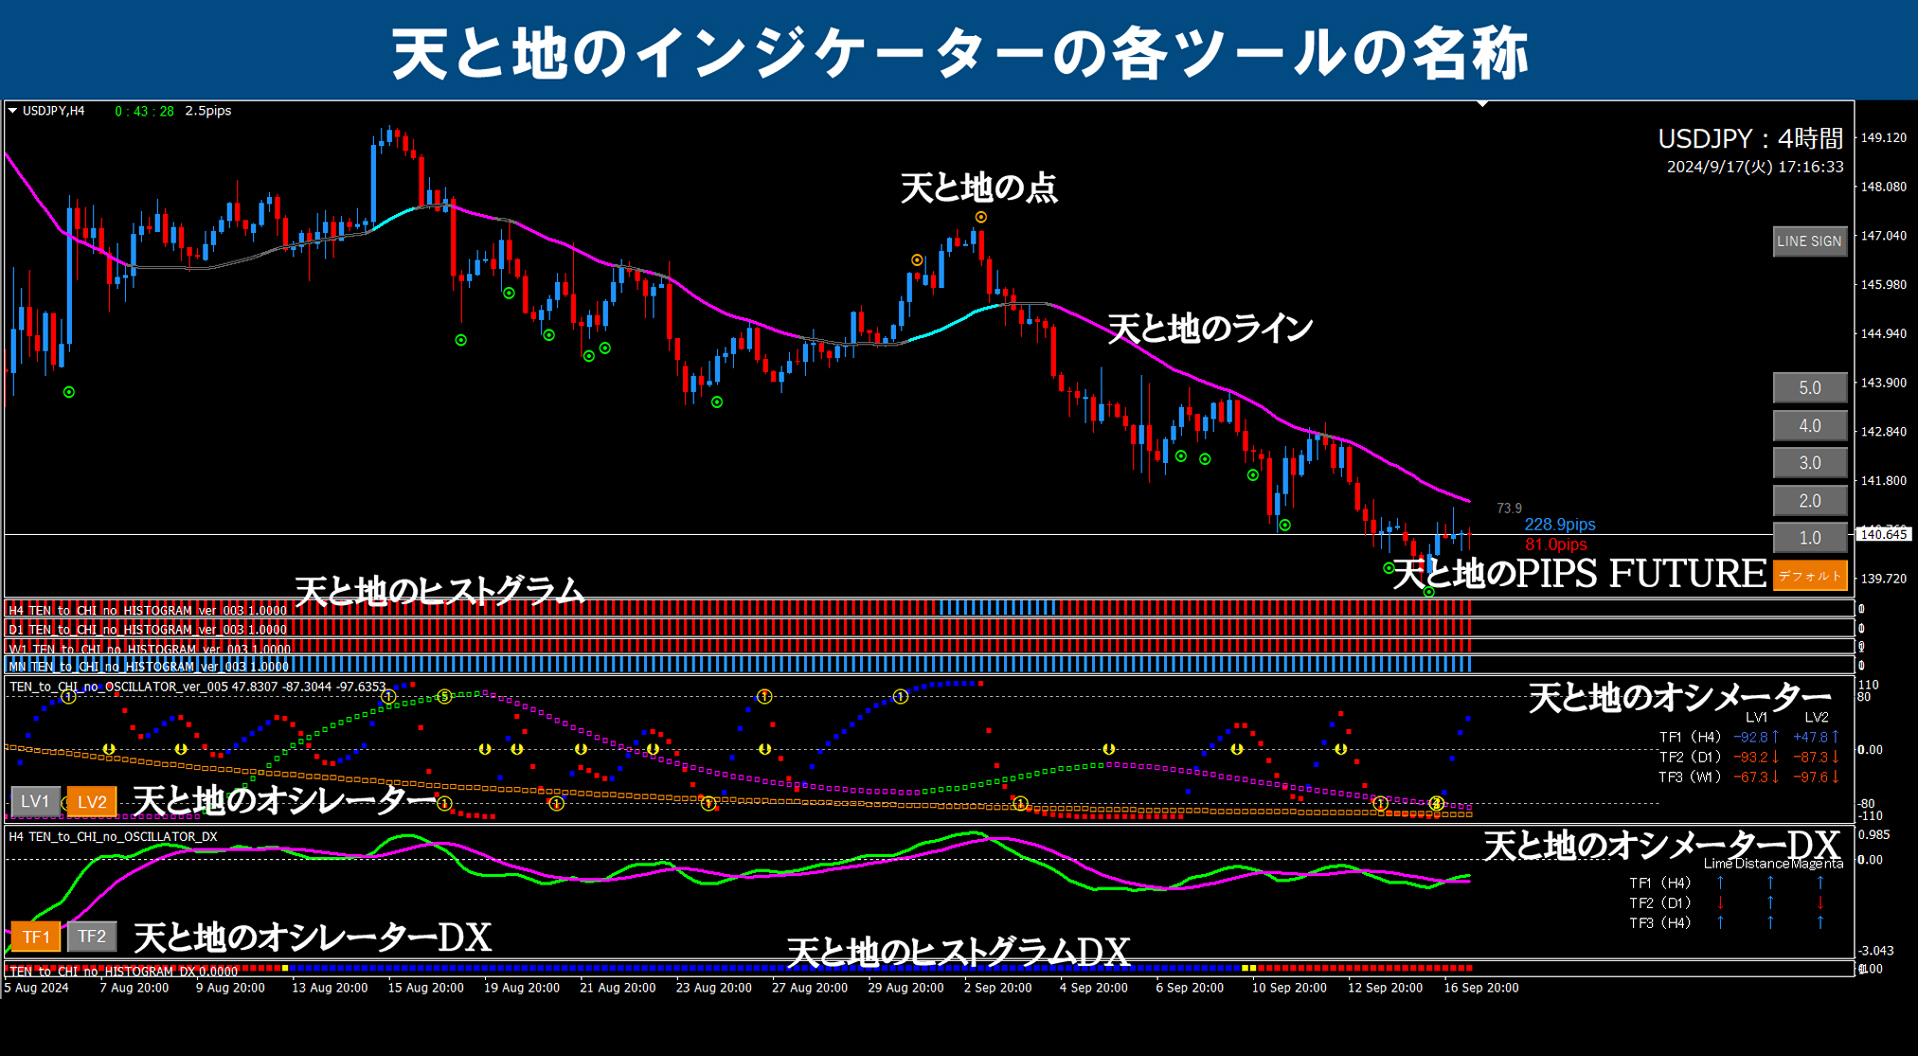
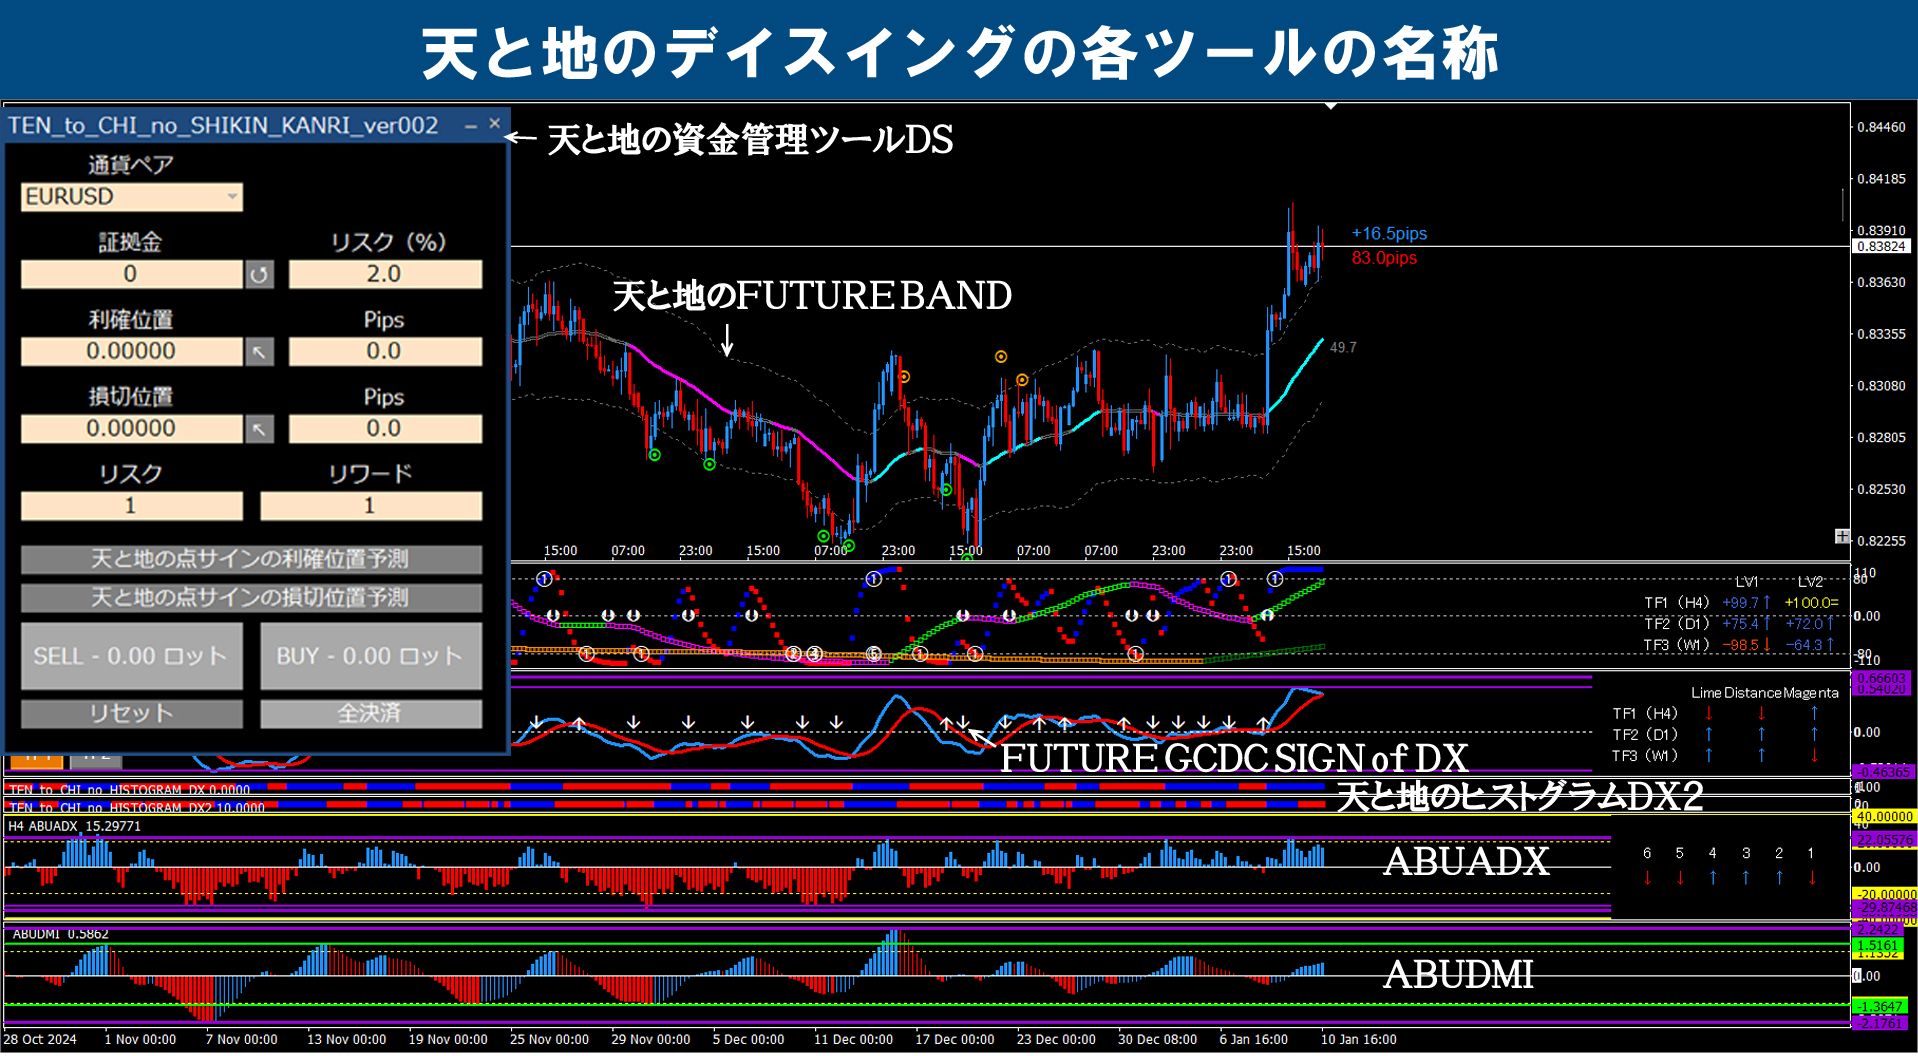
※ For terms used on this blog, please refer to the images below. (All images enlarge when clicked)


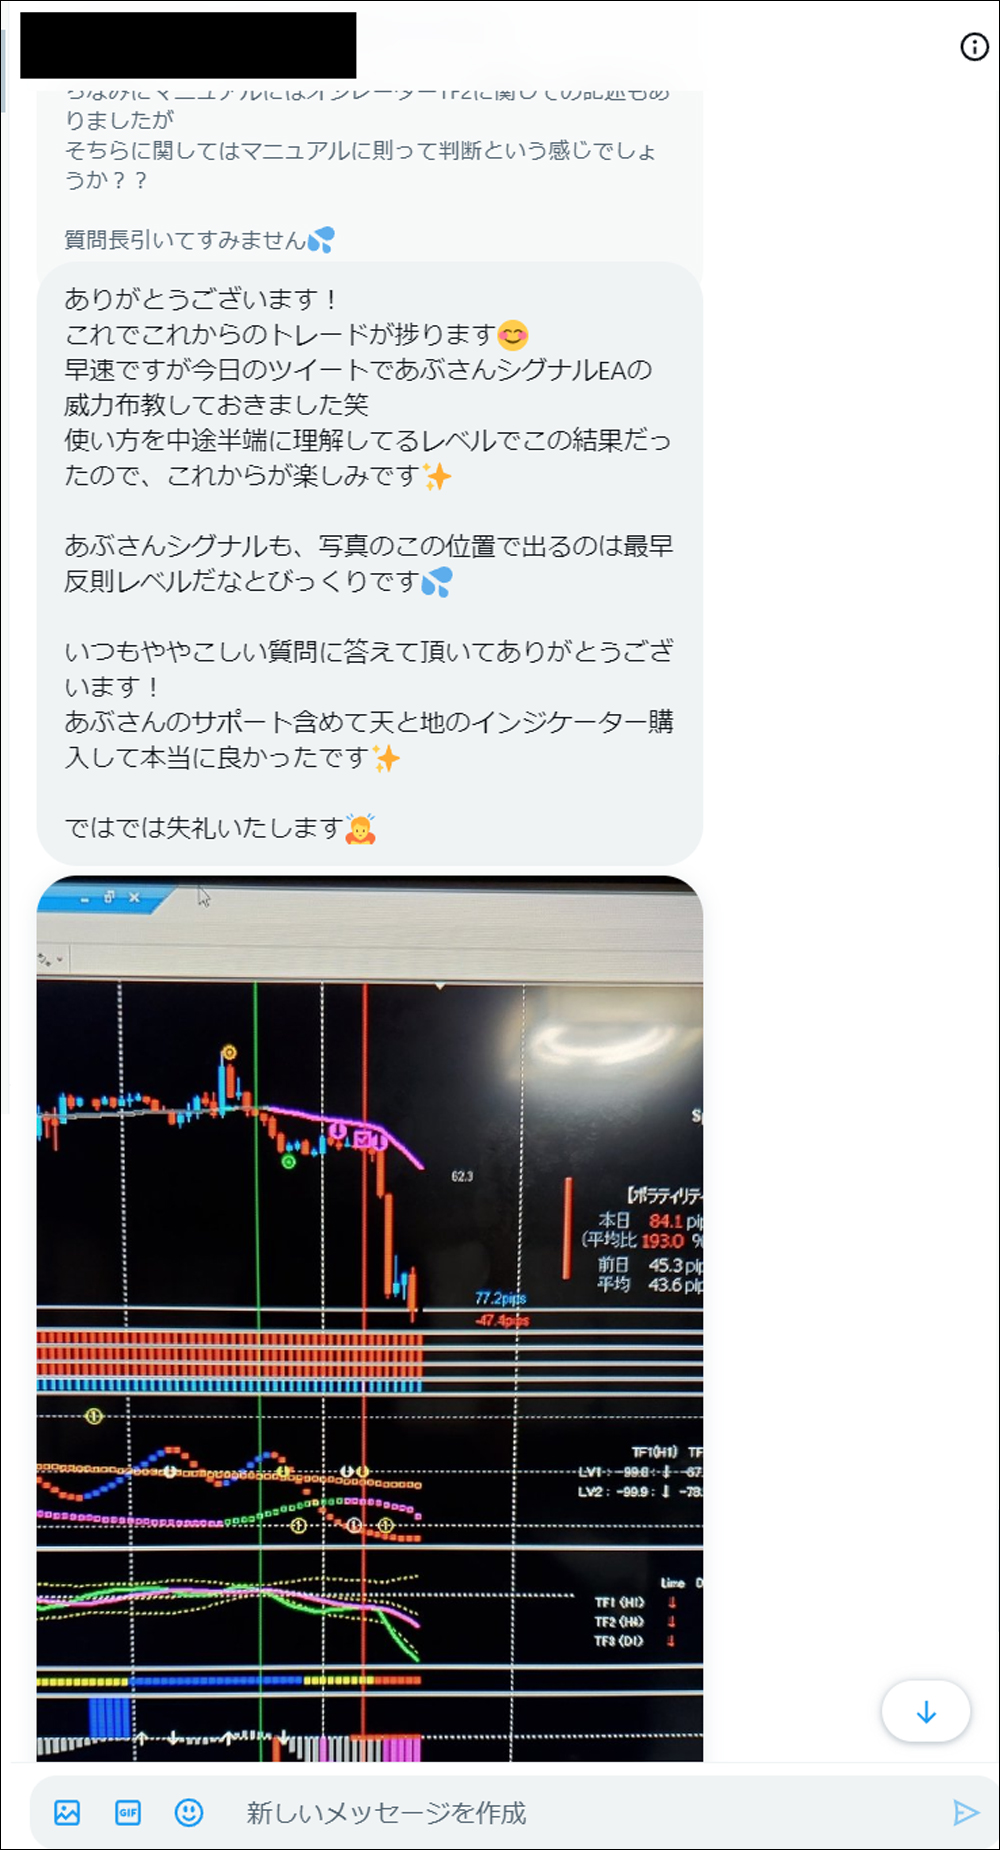
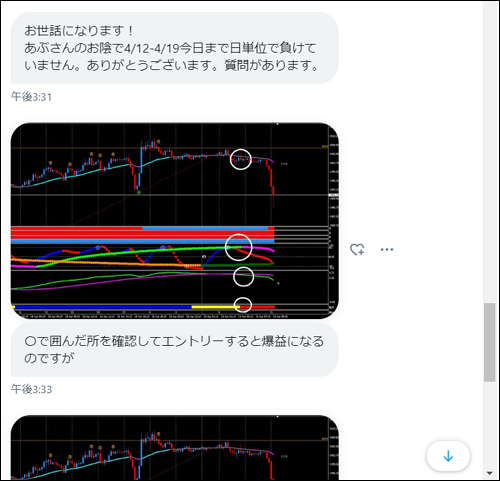
EURUSD / 1-hour + 4-hour + daily historical verification
※ Yellow dotted lines are drawn on all timeframes and at the same places.
※ The yellow circles indicate important points.
Note: Clicking the chart will enlarge it.
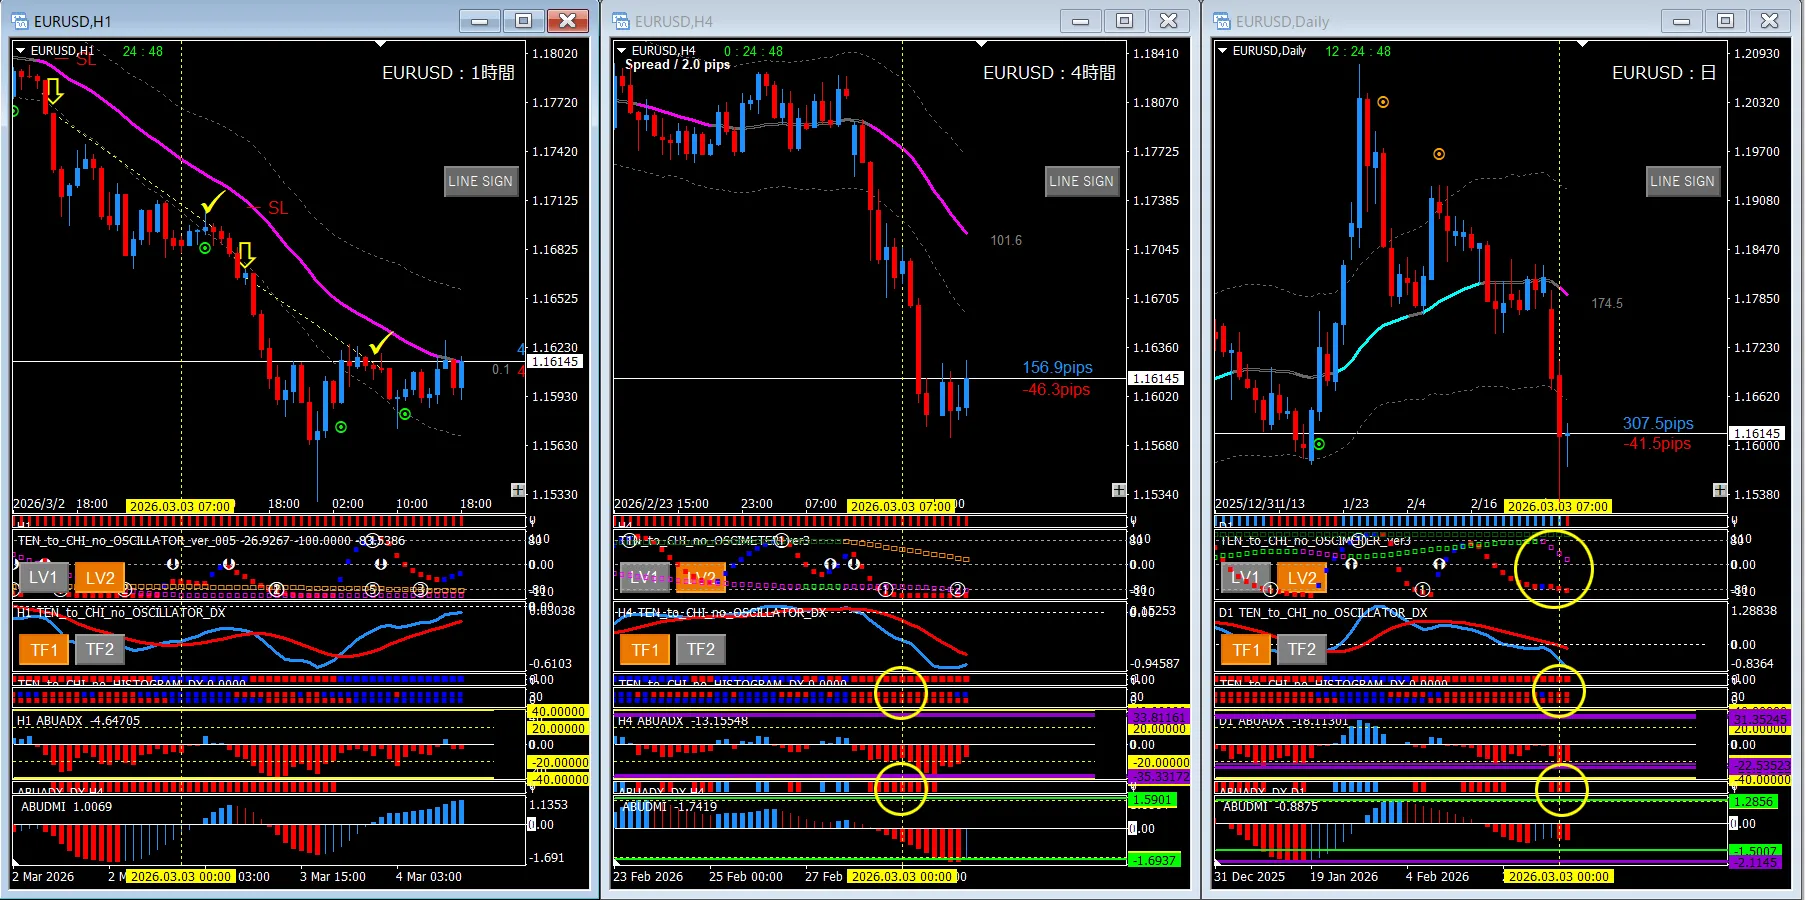
■ 1-hour chart (left: entry chart)
・ Prime Combo Signal
※ The parameter settings for this Pura Con are described below
■ 4-hour chart (center: environment recognition chart)
・ Histogram DX, DX2 (all red)
・ ABUADX_DX (lit: confirmed)
■ Daily chart (right: environment recognition chart)
・ Oscillator TF1, TF2 (TF1 reaches -80, TF2 declines from +80)
・ Histogram DX, DX2 (all red)
・ ABUADX_DX (lit: confirmed)
■ Summary
The momentum for environmental recognition written in the previous article continues. When ABUADX_DX on the daily and 4-hour charts overlap, it is strong. Wait for the daily ABUADX_DX to turn off, or as a safety measure, reset the downward view by color change of Oscillator TF1.
■ If you use DSATEA
Since I determined a downtrend at the yellow dotted lines, I will enter the 1-hour chart with DSATEA set to short-only at this point.
■ Prime Combo Signal ~ Ten to Chi Comprehensive Signal ~ Parameter settings
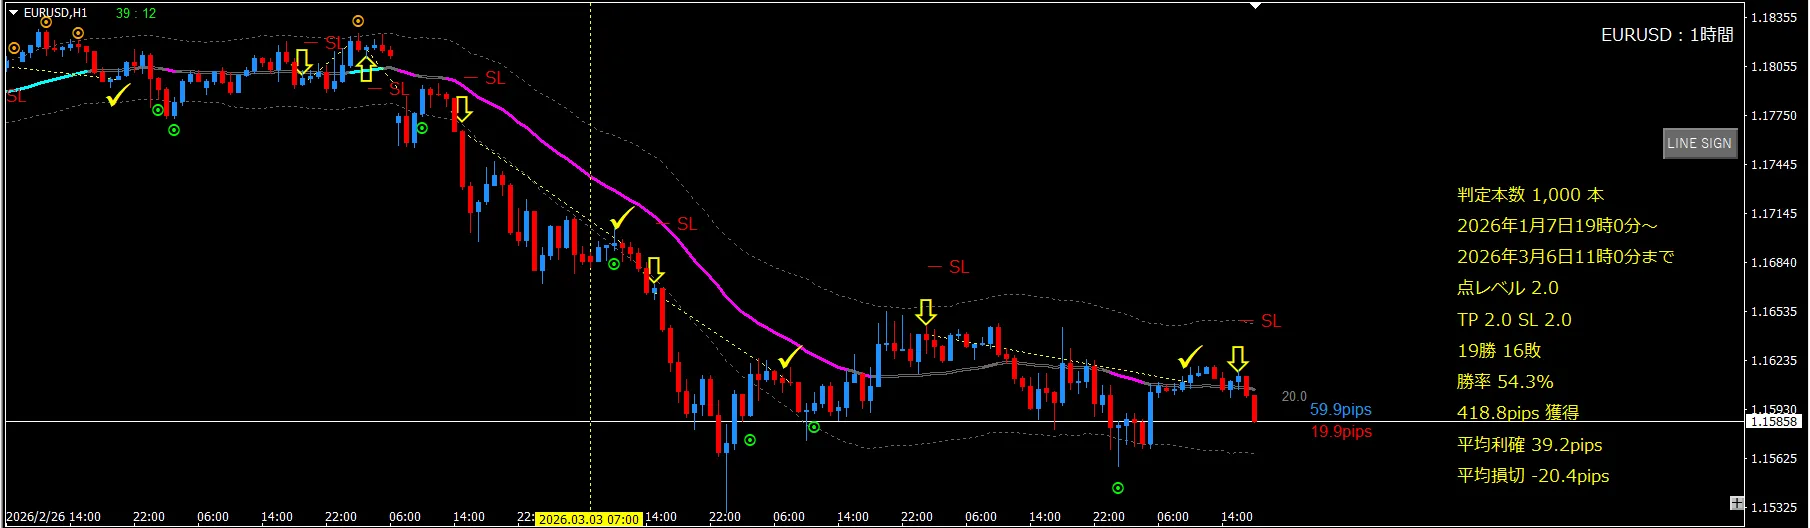
| Number of judgments | Entry | Filter (MTF type / Confirmed) | Take profit | Stop loss |
| 1000 | ABUDMI (color change) | Ten to Chi Line | ABUDMI (Zero Line Cross) | ABUATR (2.0) |

We hope this is helpful to everyone, even if only a little.
If you could press the GOOD mark, it would give us energy for future work. We would appreciate your support for further motivation.
