

Gold Analysis on 2026/03/05
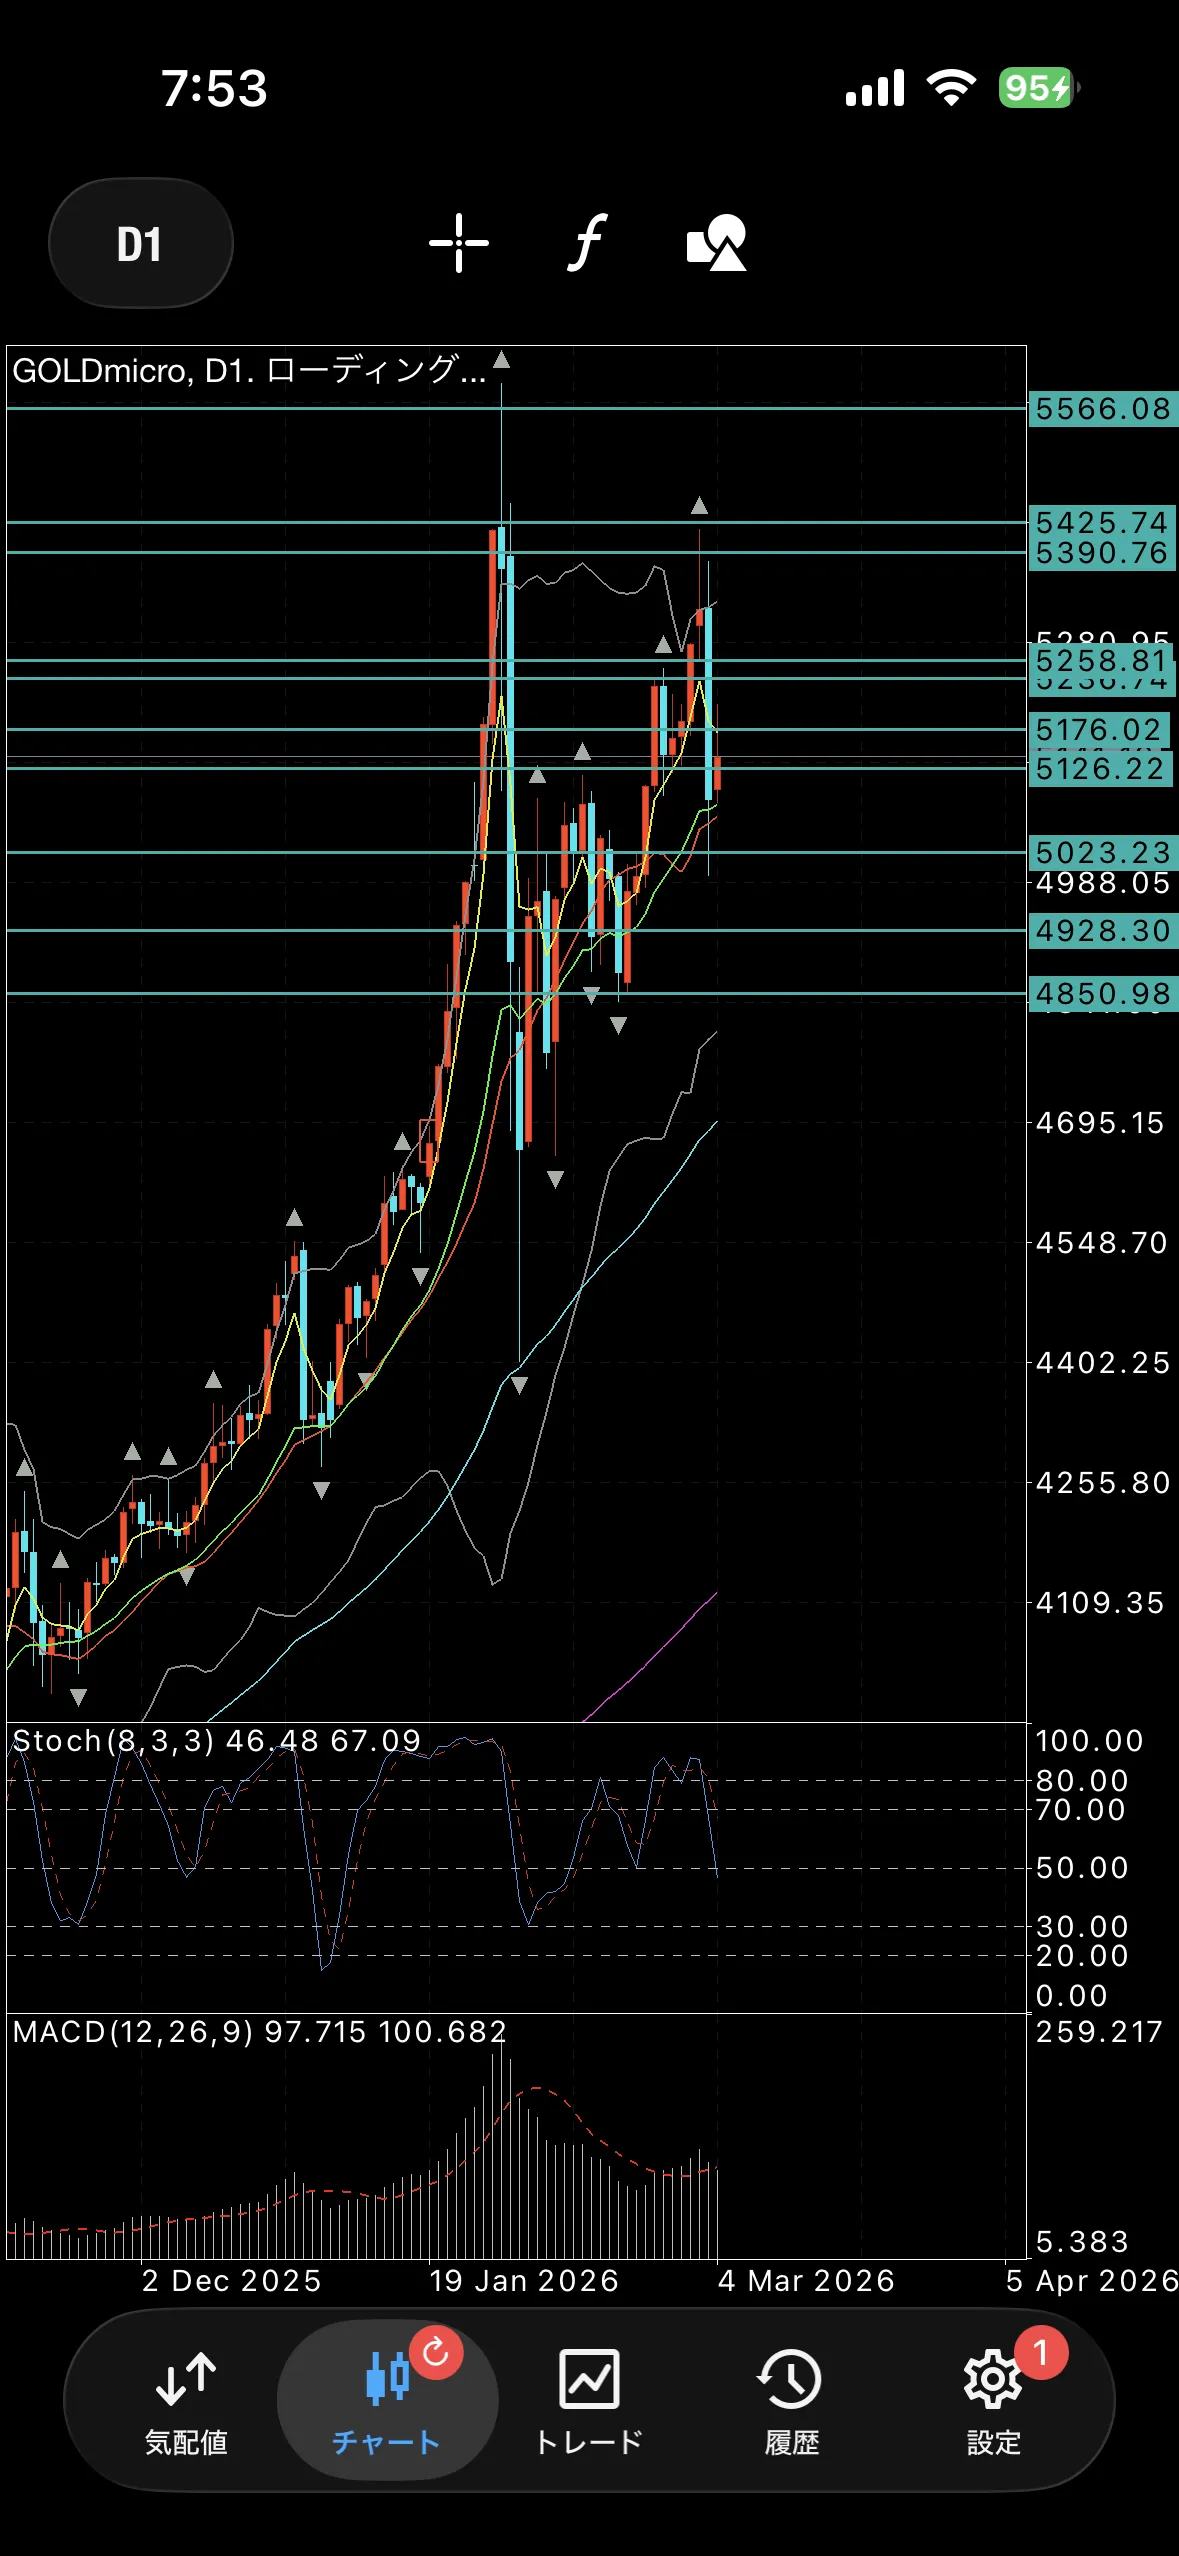
Yesterday's gold daily chart was bullish.
The bullish candle indicates an upswing within a shadow, but it leaves a top wick above the 5MA.
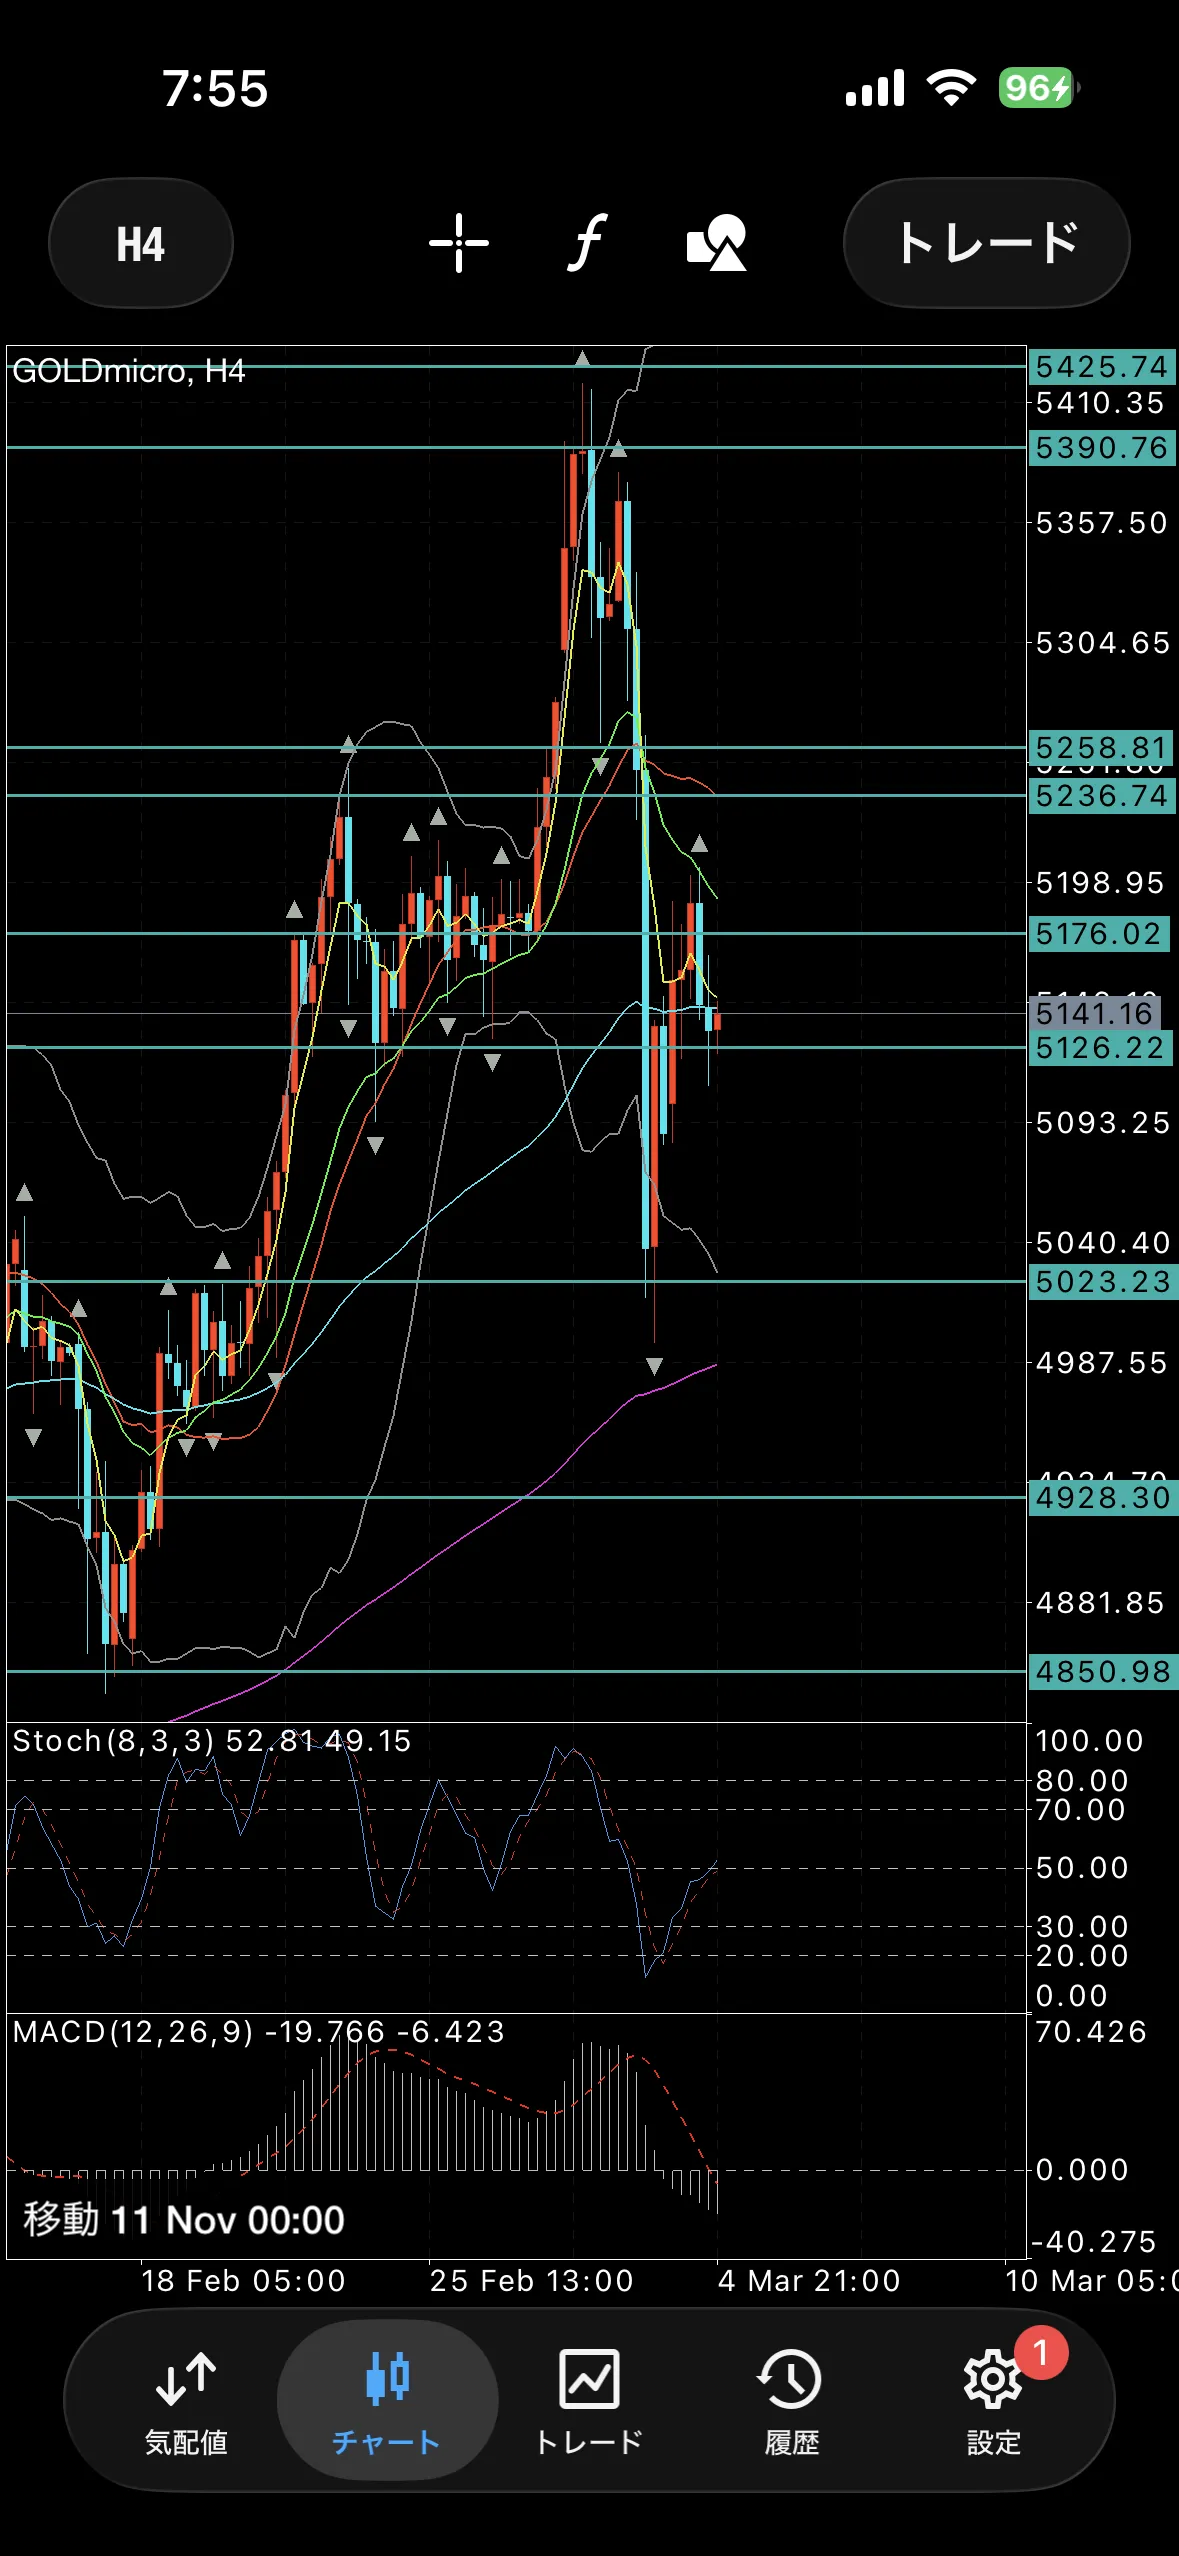
On the 4-hour chart, there are noticeable outsides from near the 20MA.
Until the starting point around 5190 is broken upward, the short-term impression is still bearish-dominant.
However, given the sequence of bearish small candles and bullish candles, it may be difficult to continue shorting aggressively.
Still, when the starting point of the bullish candle around 5126 is broken downward, the decline accelerates.
Buying defense line
Around 5126
Around 5090
Around 5023
Selling defense line
Around 5189
Around 5236–58
× ![]()