Dollar/Yen Forecast March 21
■ USD/JPY Daily Chart Forecast for Today
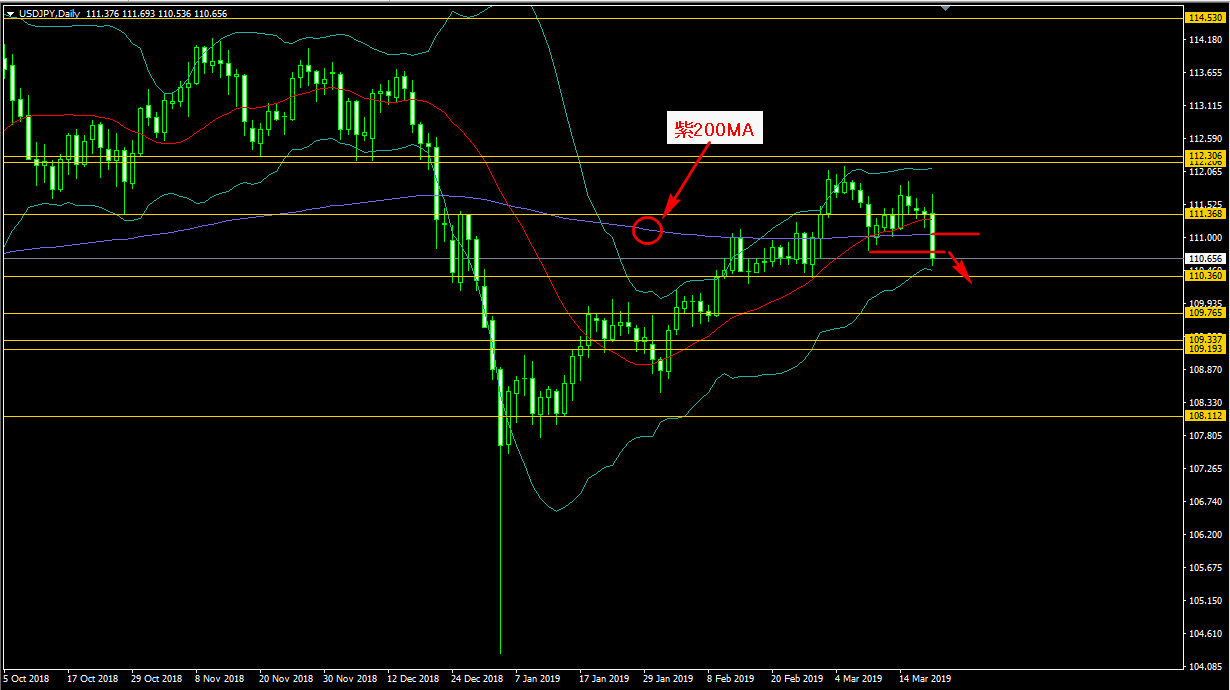
From the daily chart of USD/JPY, the impact of the indicator release “FOMC” that occurred a few hours ago has caused the recent low to be broken, and as I’ve been mentioning since the other day, the uptrend paused for a moment. It took time, but institutional investors finally broke above, and the 200-day moving average (purple), which is considered the strongest resistance from above, has also been broken from the top, returning to the previous situation. The middle band of the Bollinger Bands, the red line 20MA, shows signs of turning slightly downward, so there is a higher likelihood of turning to a decline from here.
× ![]()