

Gold Analysis 2026/03/04
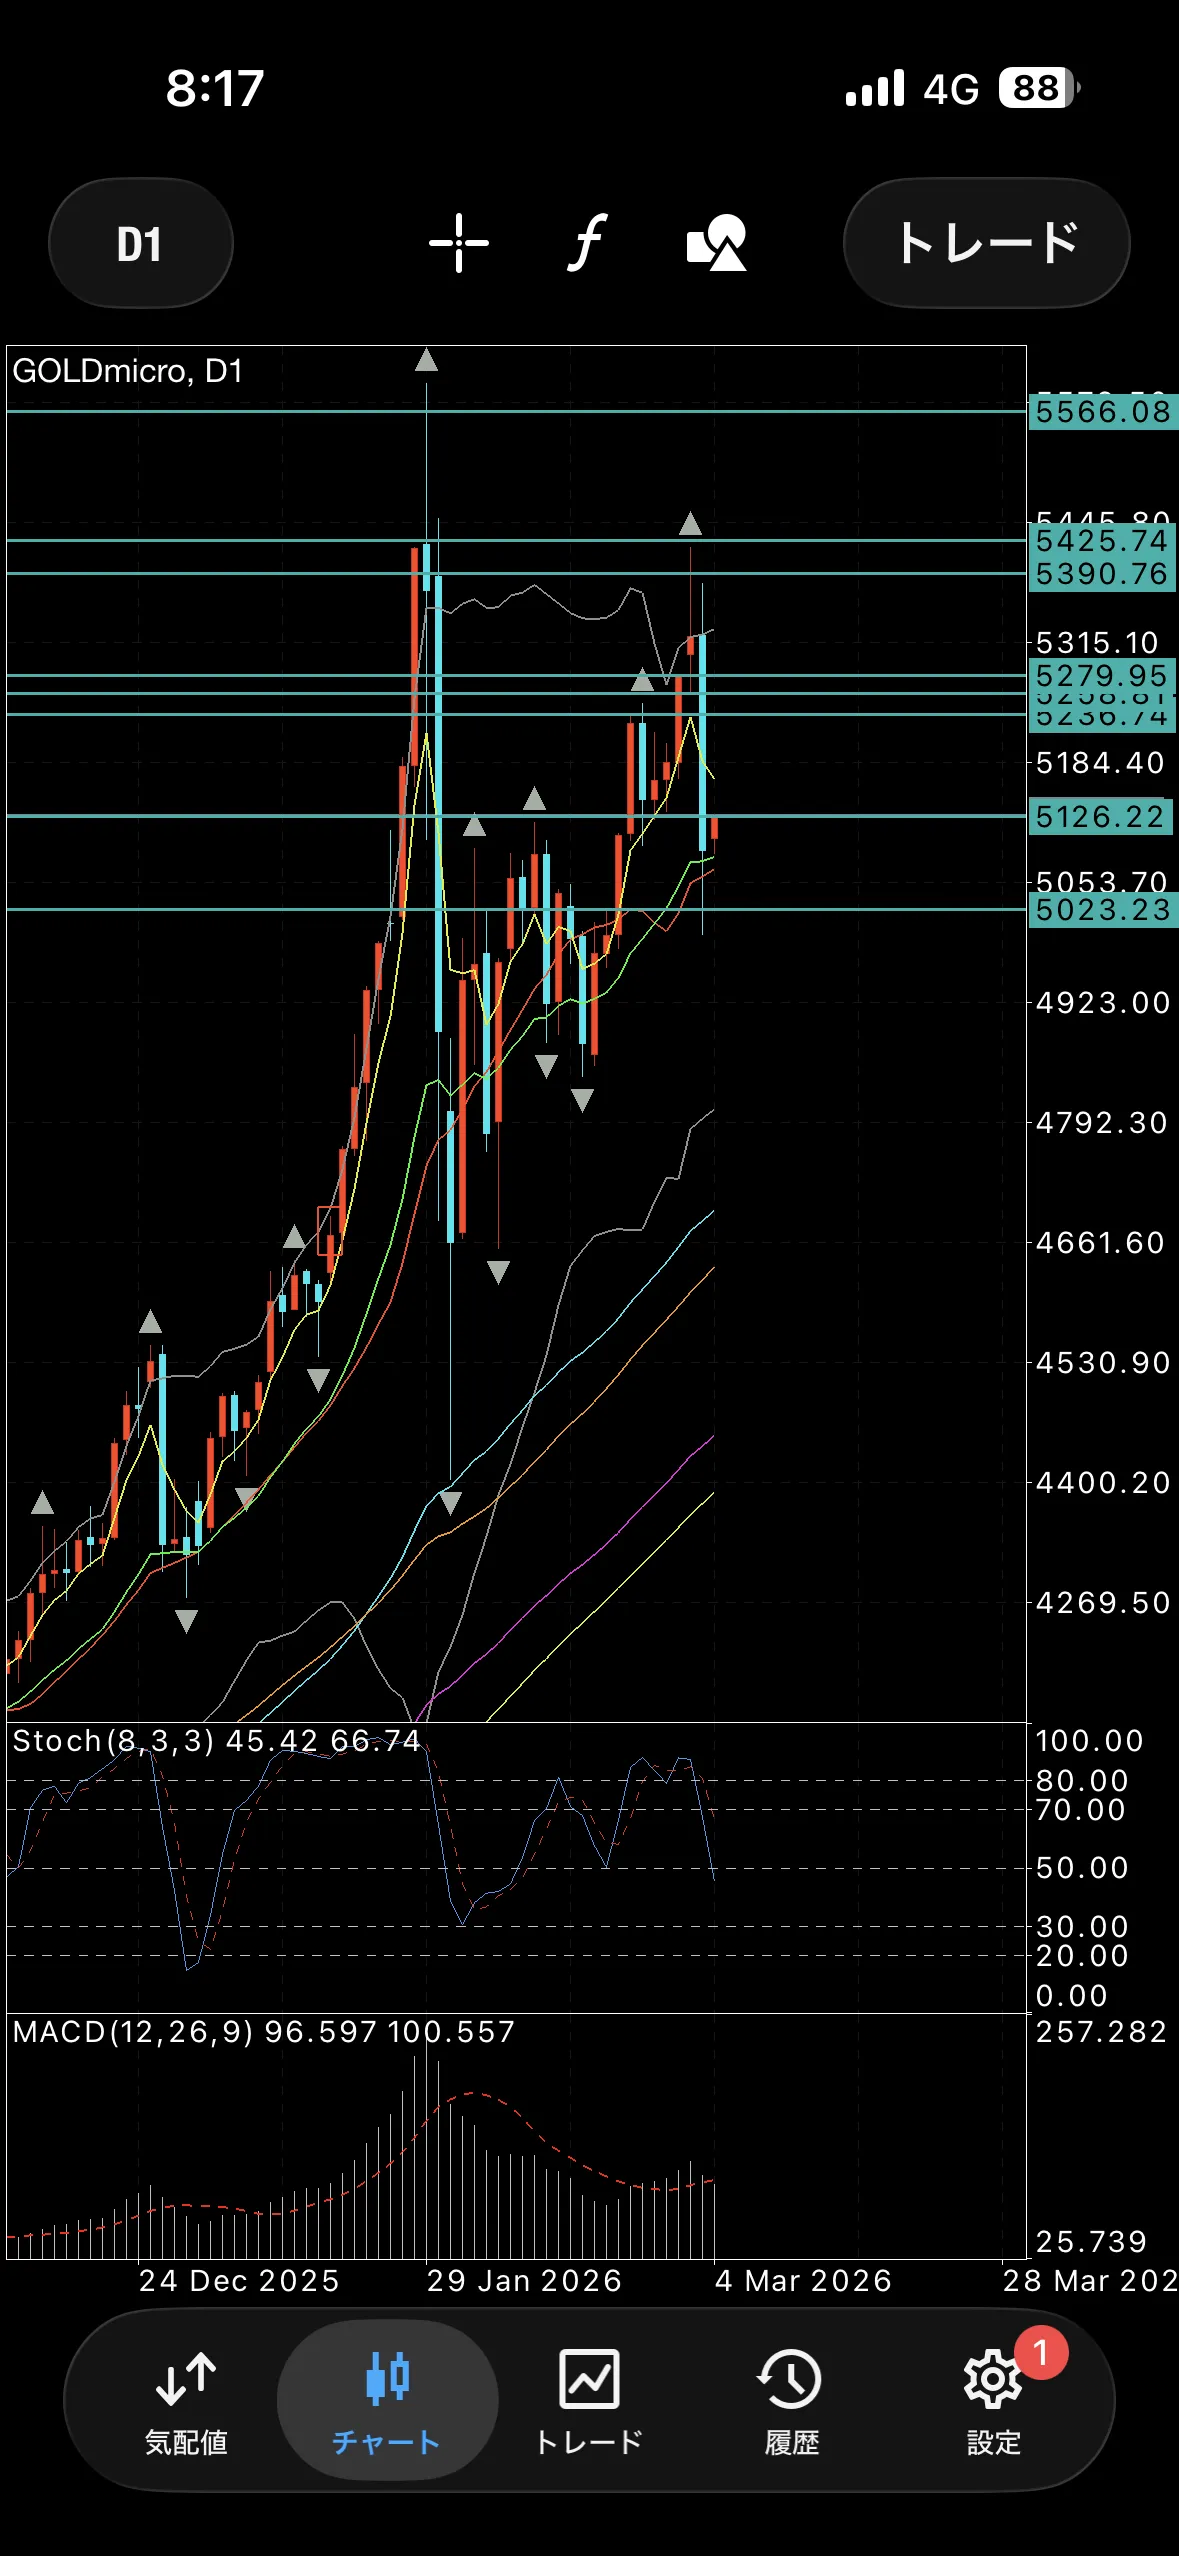
Yesterday's gold daily chart formed a long bearish candle from 2σ.
Until we break above the starting point of the decline around 90 to the 26 area where there is a real body, the outlook remains bearish, but since it is hitting the middle, it cannot be stated categorically.
Additionally, in the long term, the condition to be bought remains as long as it declines.
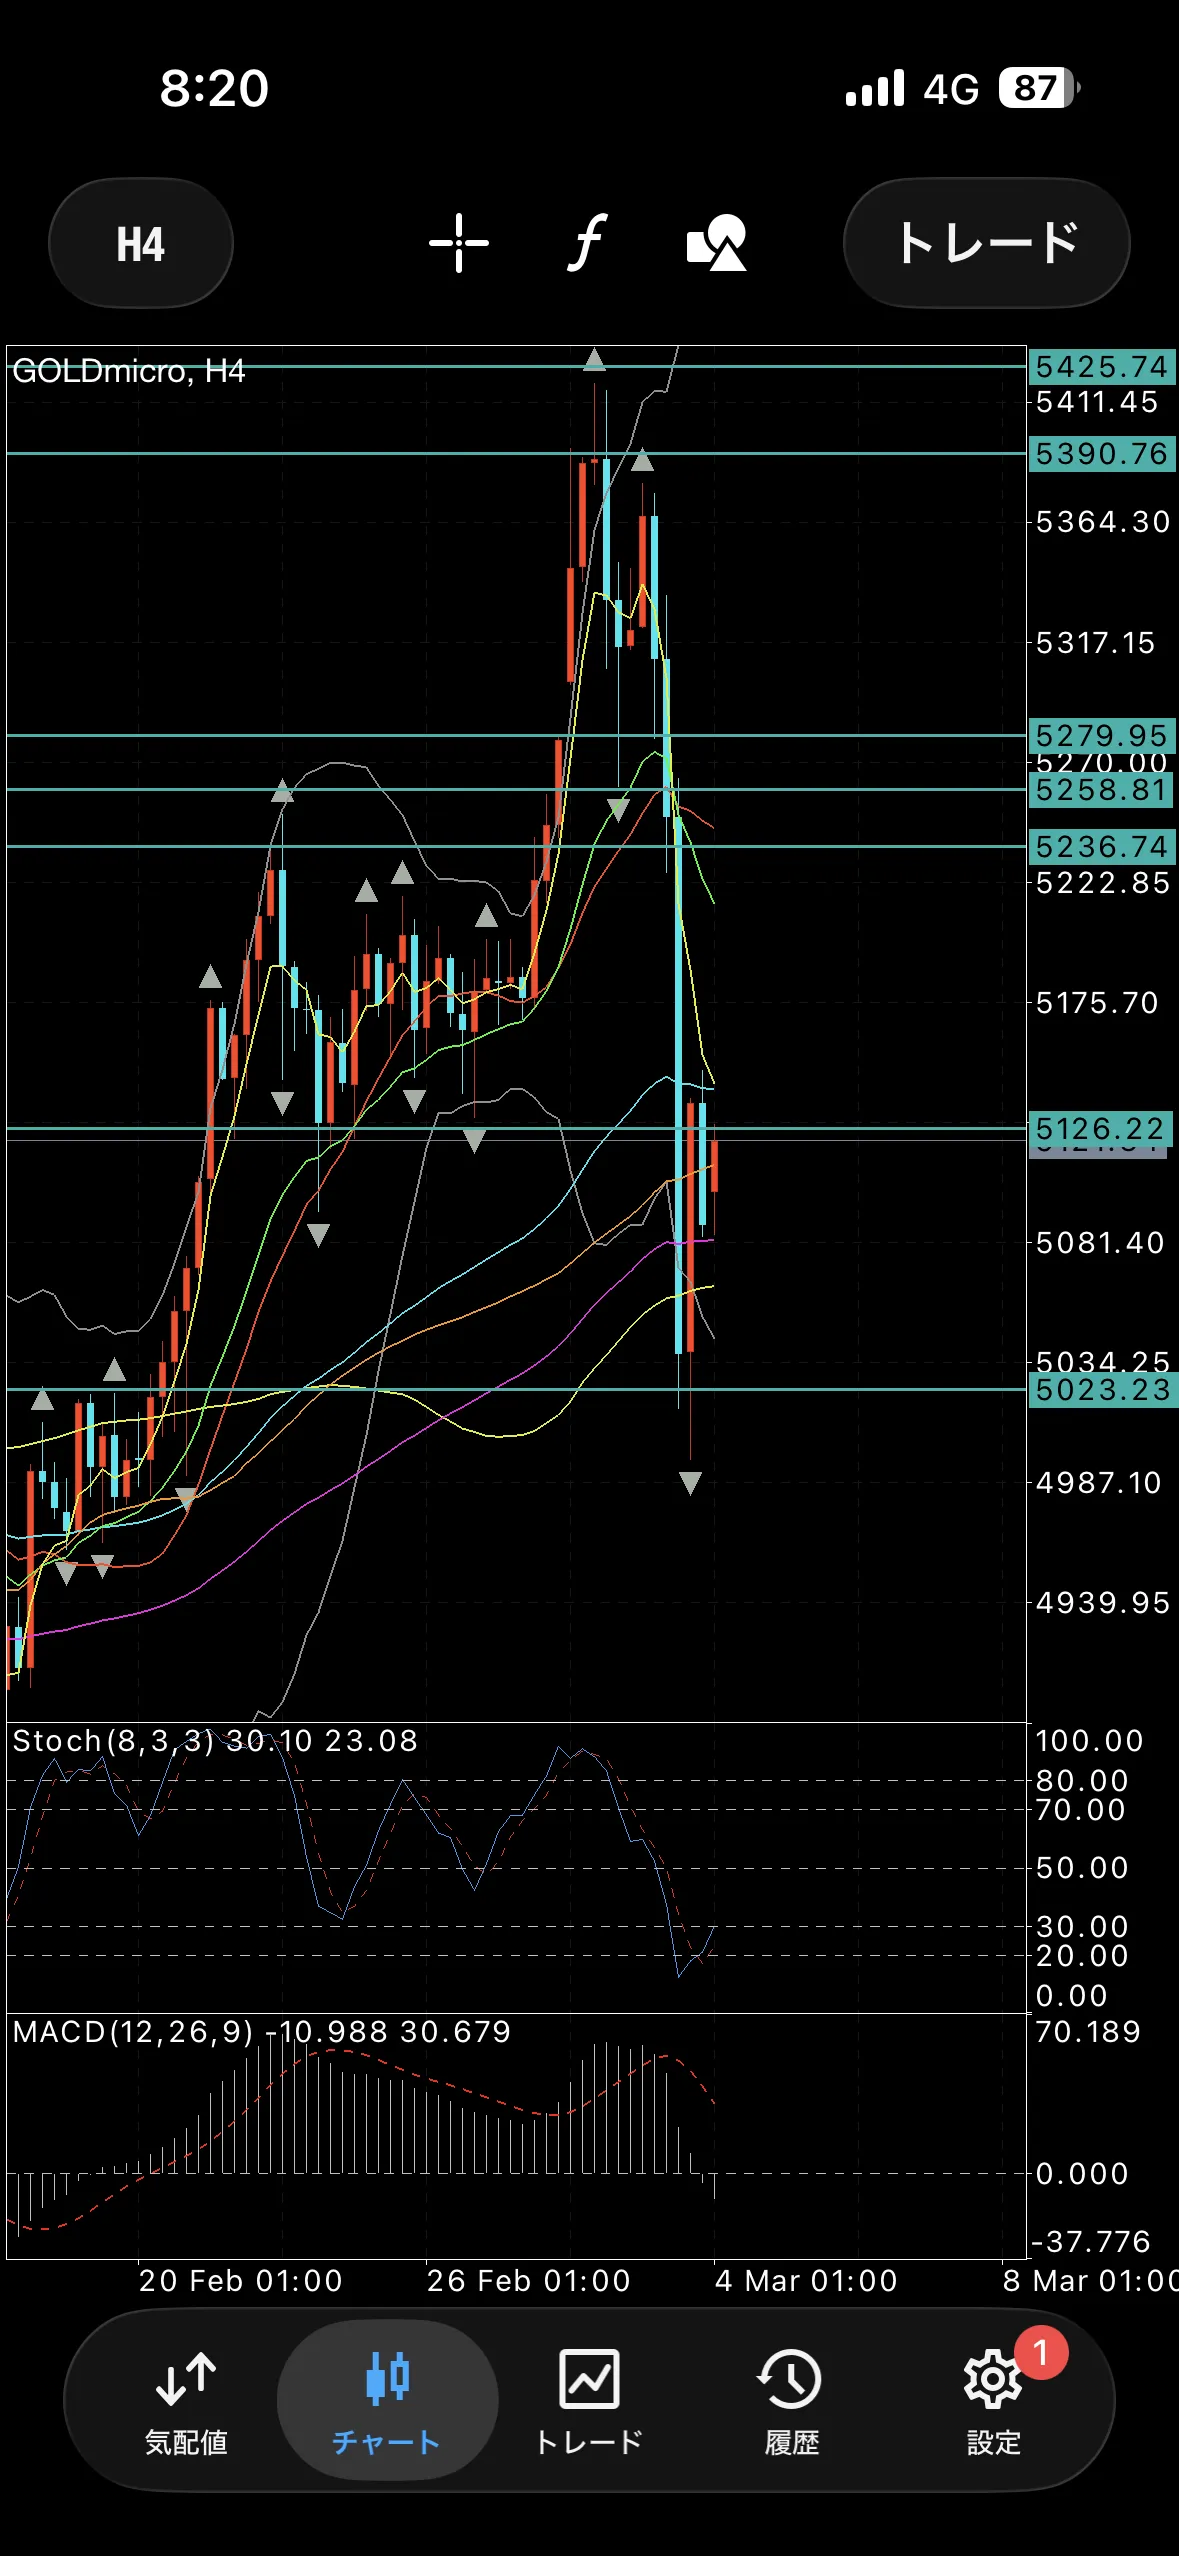
The 4-hour chart fell with an outside-type WT before the right shoulder of the inverse head and shoulders formation.
If measured at the same scale, a decline to around 4953 to 4856 is also conceivable.
Stochastics are at the lower limit, but MACD is DC, so in the short term it leaves a bearish impression.
Defense line for buying
5023
4928
4850
Defense line for selling
5126
Around 5236–5279
5177 (the center line of the range that was formed when prices were rising and the line that recently betrayed selling) may also function.