

Gold Analysis 2026/03/03
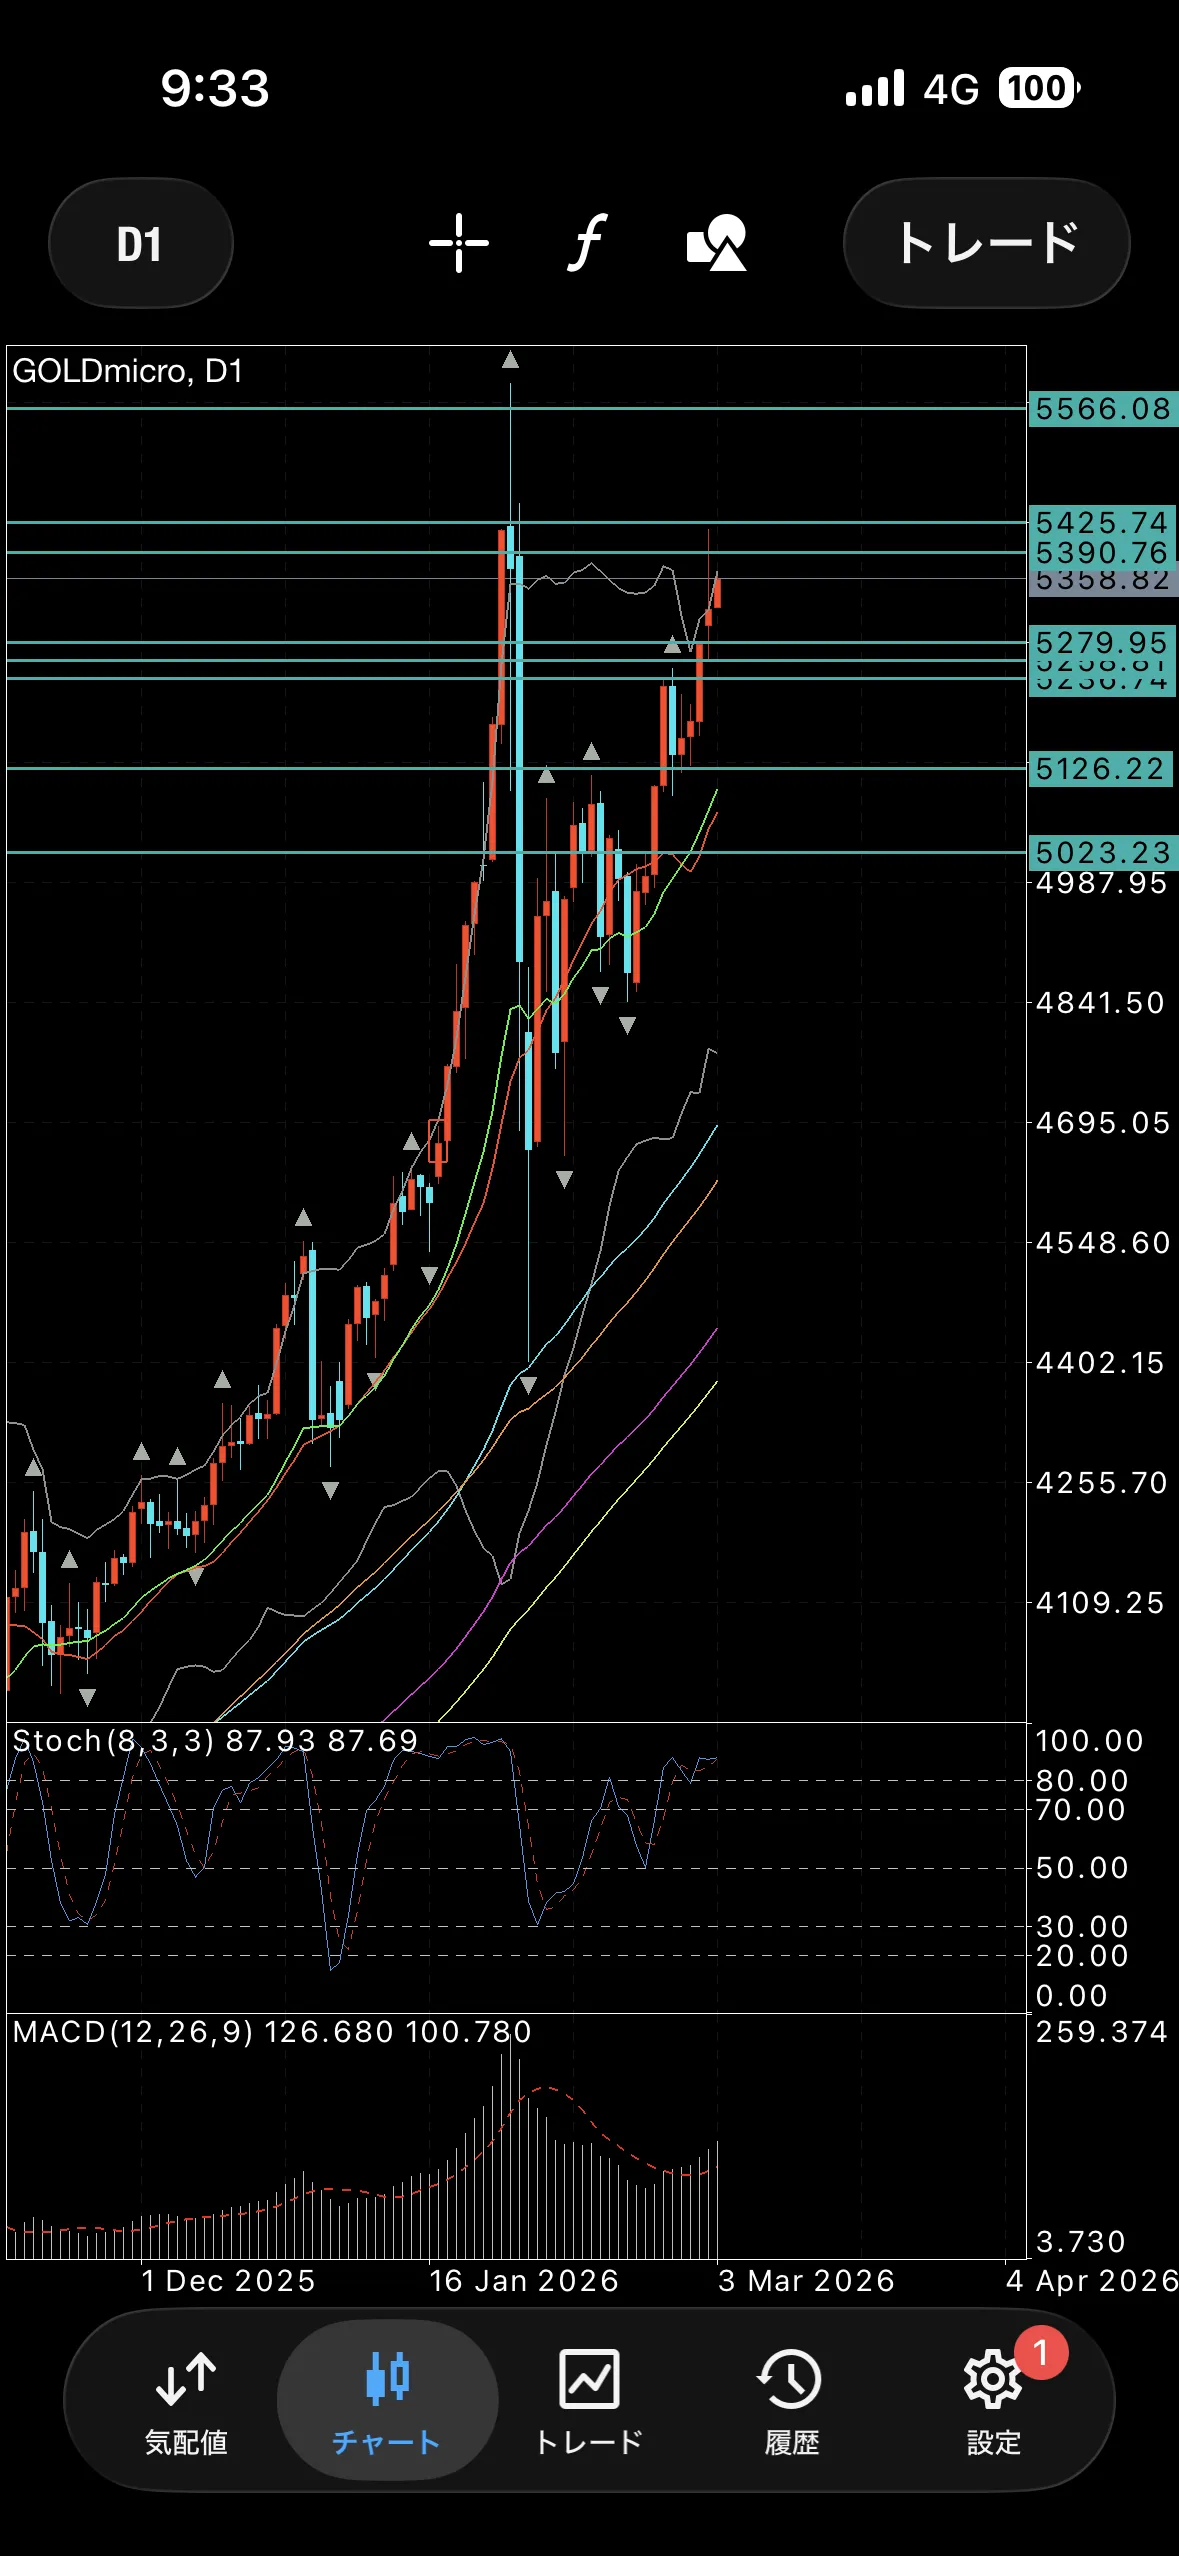
Yesterday's daily chart showed an upside shadow bullish candlestick.
Since it appeared at the 2σ band, if a leg emerges that tests this low, there is a possibility of a range breakout or a pullback forming, so it may move down once.
However, because it has broken the starting point of the recent bearish candle, it is generally expected to be bought.
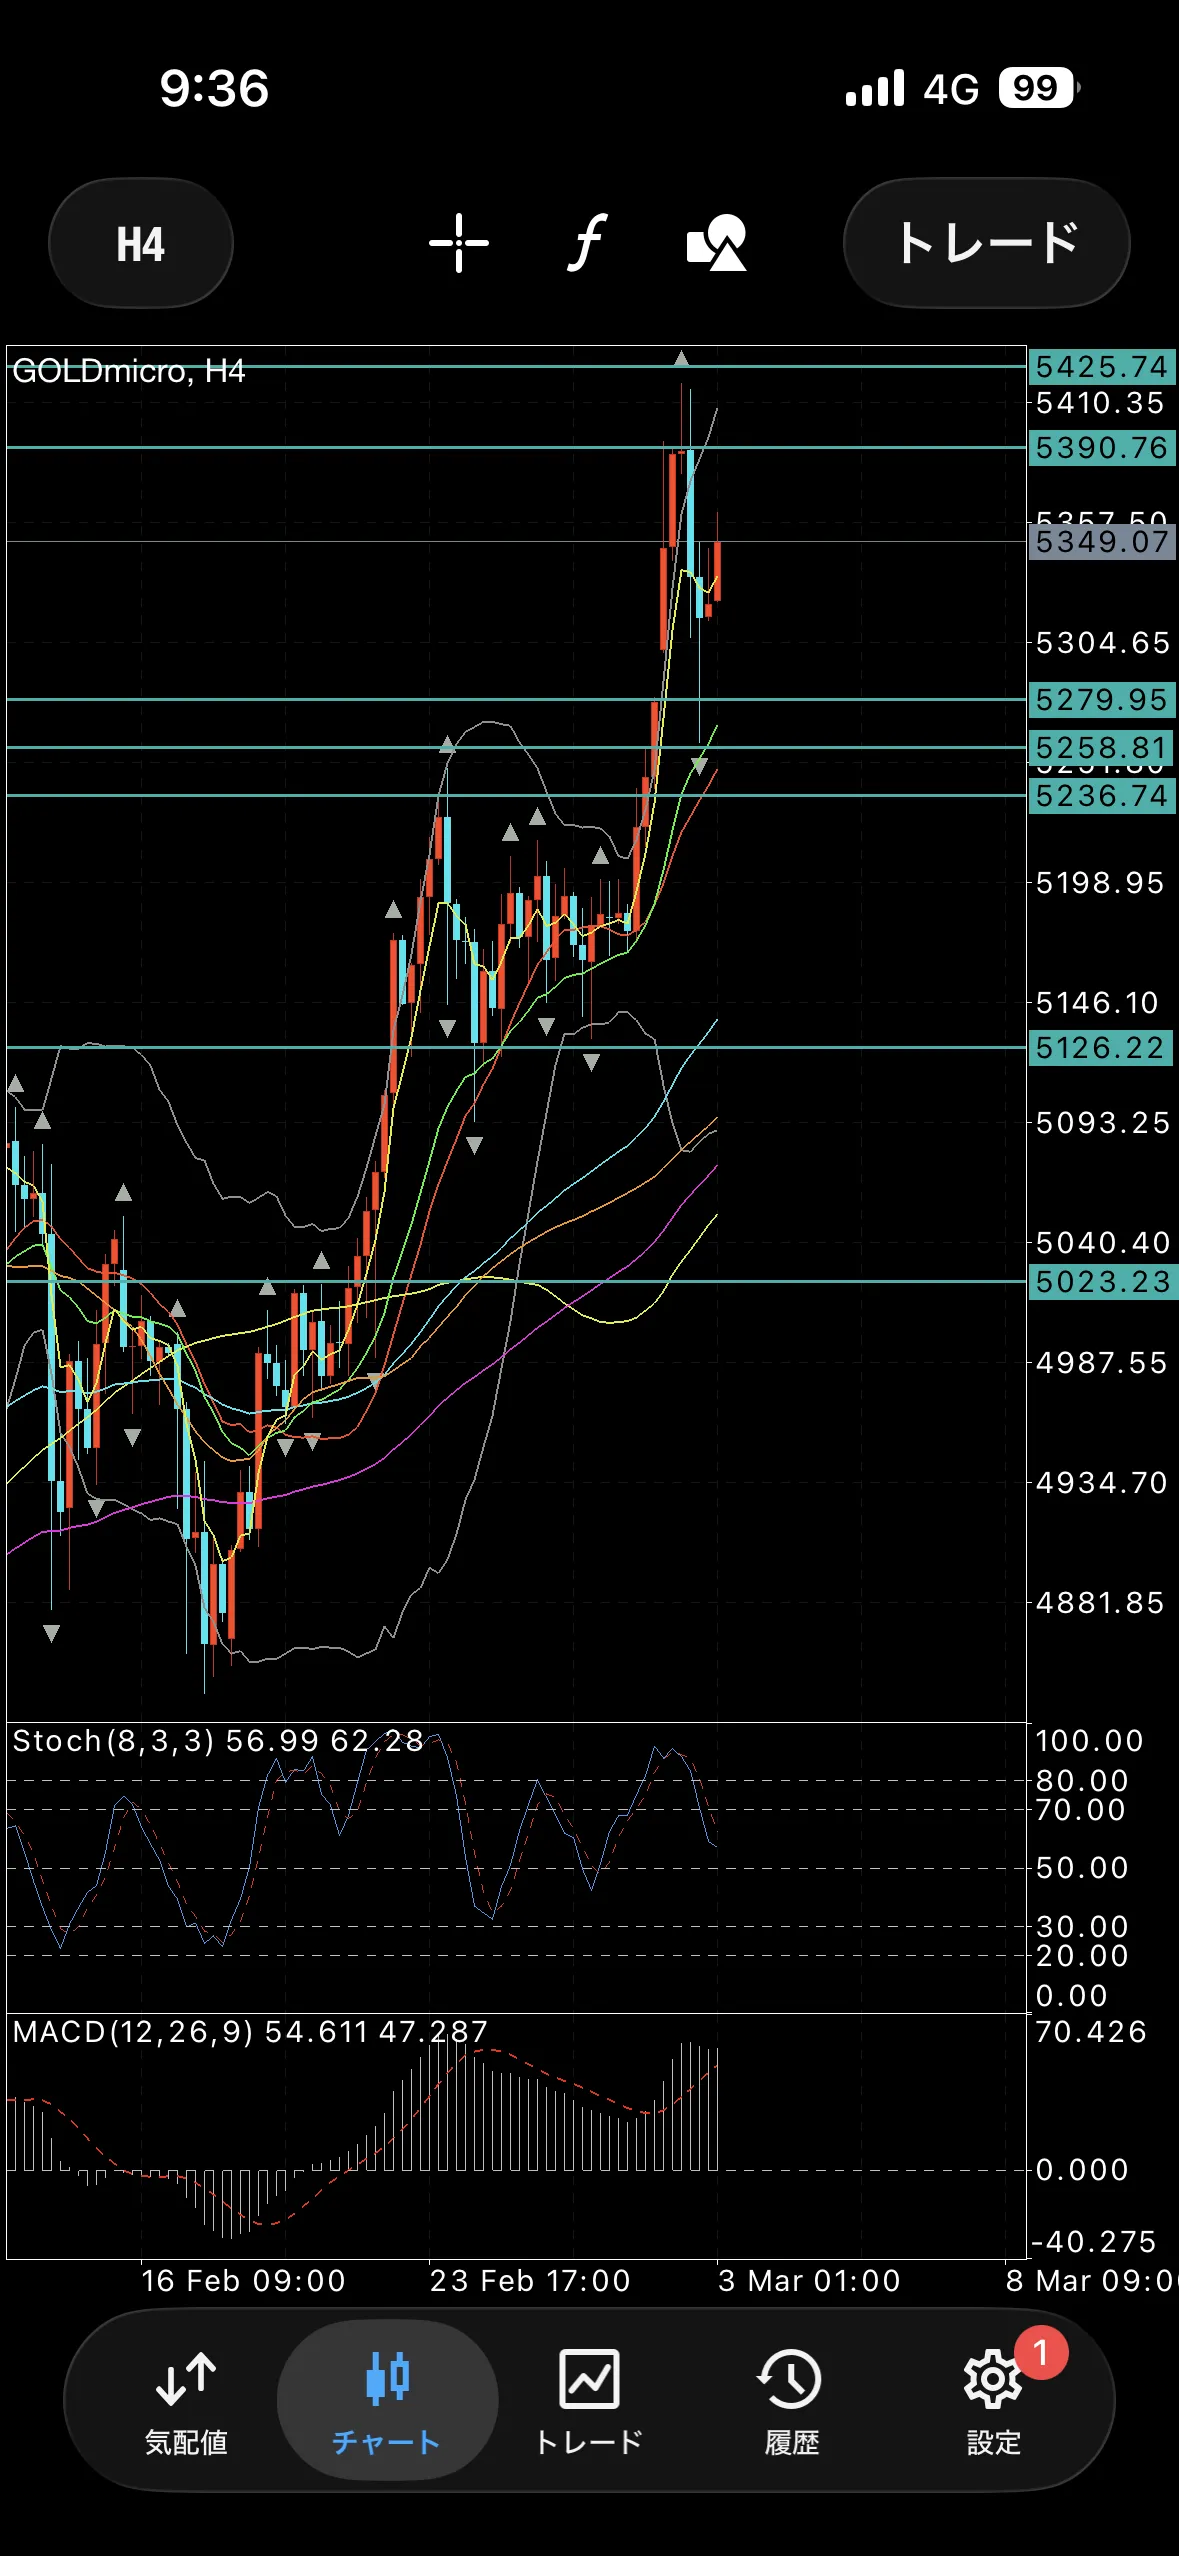
The 4-hour chart is in an uptrend, so the bias is bullish.
Since a long lower shadow bearish candle appeared, it gives the impression of very strong buying pressure.
If it decisively clears and closes beyond the starting point of the upper shadow bullish candle, there is a possibility of further upside from here.
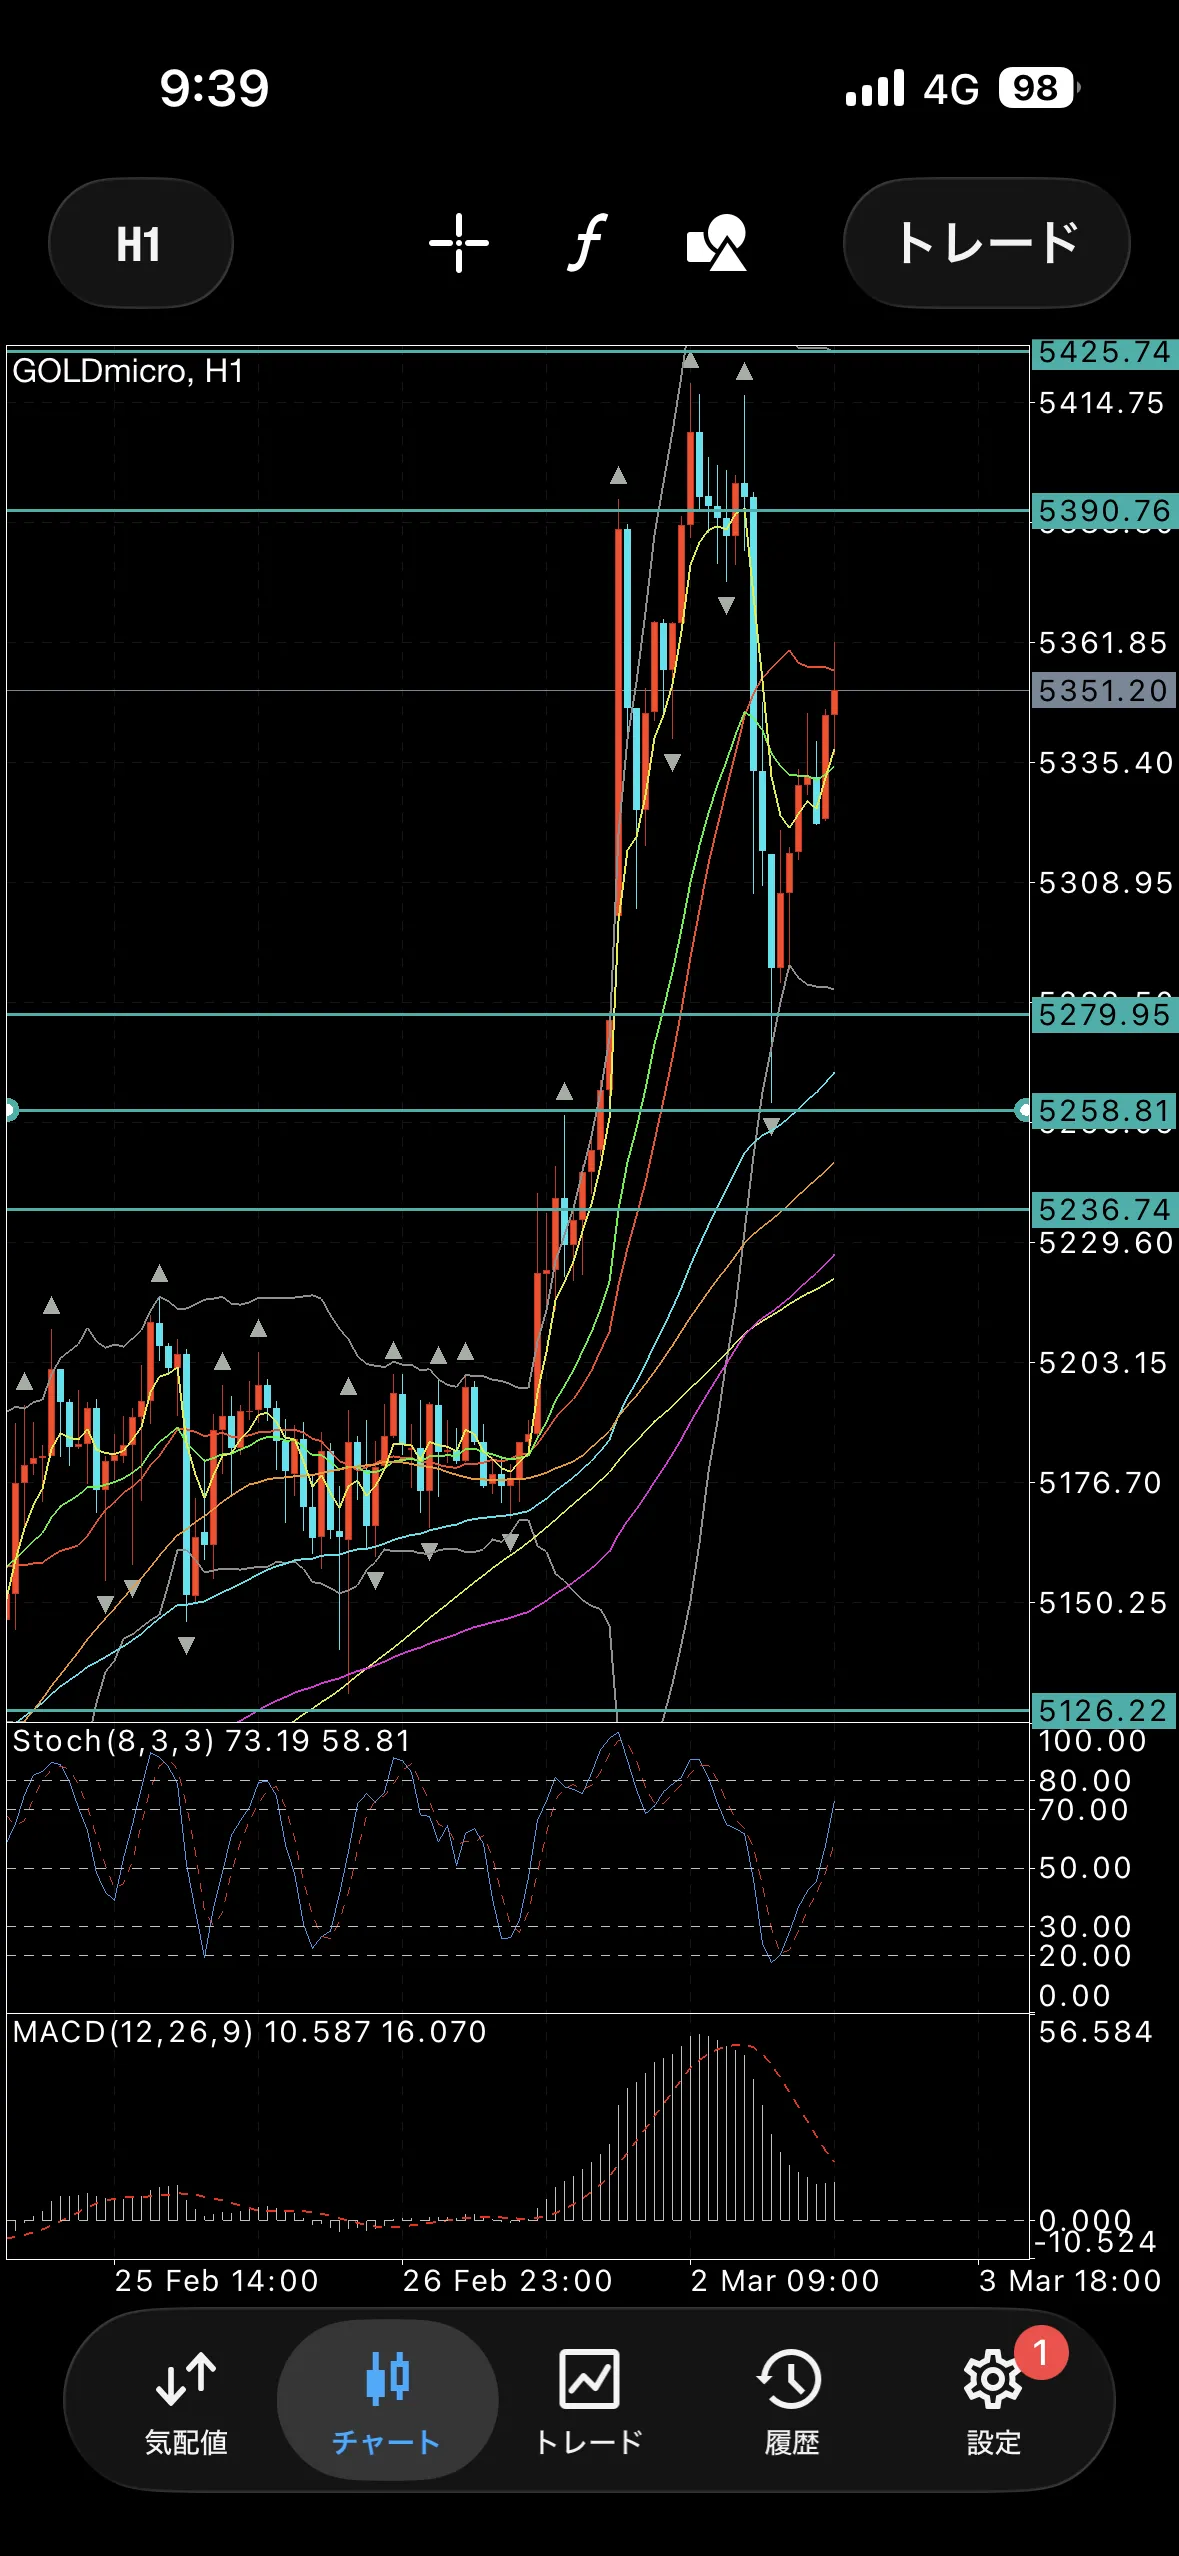
The 1-hour chart is around the middle parallel and shows a -2σ reversal.
There is a possibility of a range, so the impression is that it would be favorable to buy again around the second point and near the 75MA as the starting point.
Defense line for buying
5279
5258
5236
Defense line for selling
5390
5425