“GOTO-san FX” Trade Commentary Vol.1
Nice to meet you, my name is Gotou.
Today I would like to explain the FX trades I am conducting.
I know there are plenty of points to criticize, but I hope you will read with a generous mindset.
“GOTOさんFX”
Now, without further ado..
Before starting trading, I make a certain strategy in advance, gather data, and try to take positions accordingly.
Why decide on a strategy first? Because,
if you start with data collection, the amount of information becomes overwhelming, it takes time to reach conclusions, and this is not ideal for a part-time trader like me.
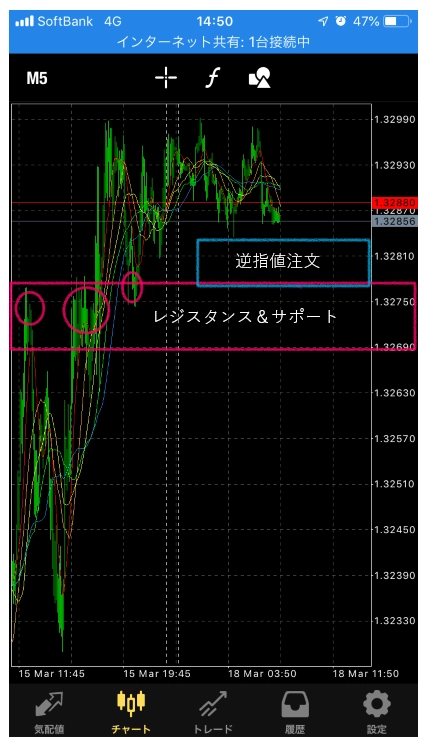
The chart below is a 5-minute chart of GBP/USD for Monday.
Looking at this chart, I formed a short strategy for GBP/USD.
Why did I choose a short strategy?
First, as you can see on the 5-minute chart of GBP/USD, Friday’s price action was an uptrend toward the weekend.And Monday in Tokyo time was a range-bound market.
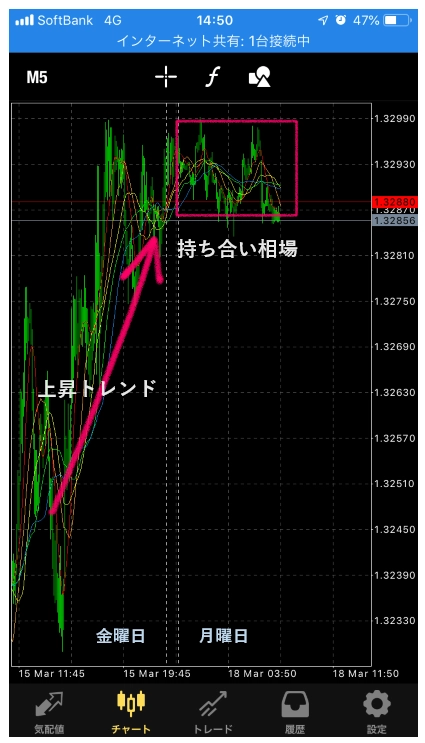
Therefore, I decided to make the trading strategy for GBP/USD a “breakdown of the Tokyo-time range-bound market.”
There are two reasons.
① Resistance & support (res+sup) created during the weekend uptrend are relatively easy to identify.
② When the market continues to range, stop orders tend to accumulate near resistance & support (res+sup).
In the forex market, there are many cases where price moves toward accumulated stop orders.
There are various theories about this, but in my experience, the expected value is quite high.
With a certain strategy decided, next I will collect data.
What kind of data do I collect?..
① Price ranges of resistance & support ② Accumulation of stop orders
These two items.
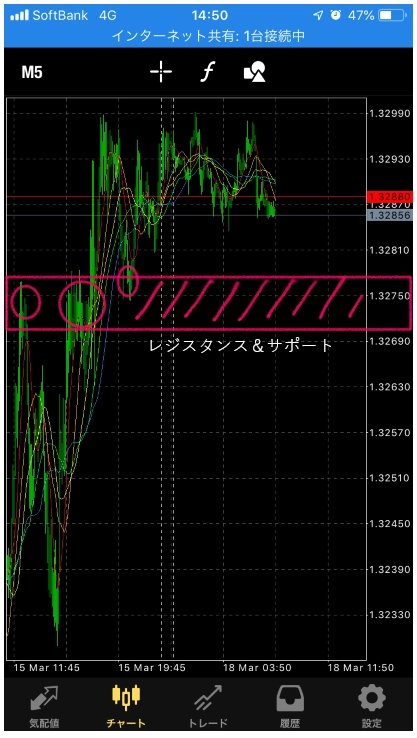
① Resistance & support are recognized as price ranges where there are overlapping bounce points or consolidation points.
As shown in the chart below, on the GBP/USD 5-minute chart, you can recognize resistance & support centered around 1.32750.
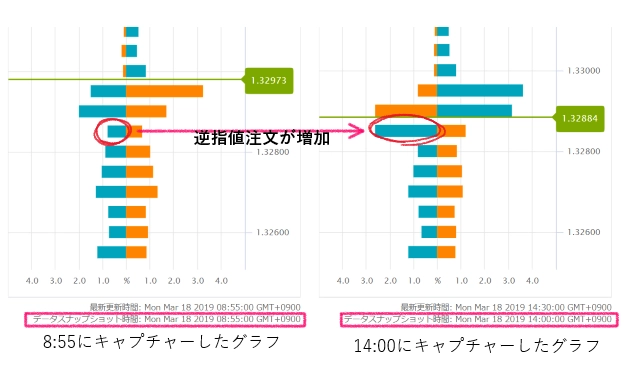
② Accumulation of stop orders is based on the OANDA order book.
I check the increases and decreases of stop orders by looking at graphs from 5–6 hours earlier.
As you can see from the order book below, between 8:55 and 14:00,
stop orders around 1.32801–1.32850 have piled up.
Summarizing collected ① and ② data,
as in the chart below, you can see stop orders accumulating near the upper bound of the resistance & support price range.
In other words, these stop orders can be recognized as the loss-cut lines for players who participated in the Tokyo-time range-bound market (long positions).
In this case, when the price falls to the loss-cut line, stop orders cascade, causing a rapid price move.
Afterwards, as expected, stop orders cascaded and the price broke downward in one fell swoop.
And then, the price stalled at the resistance & support price range.
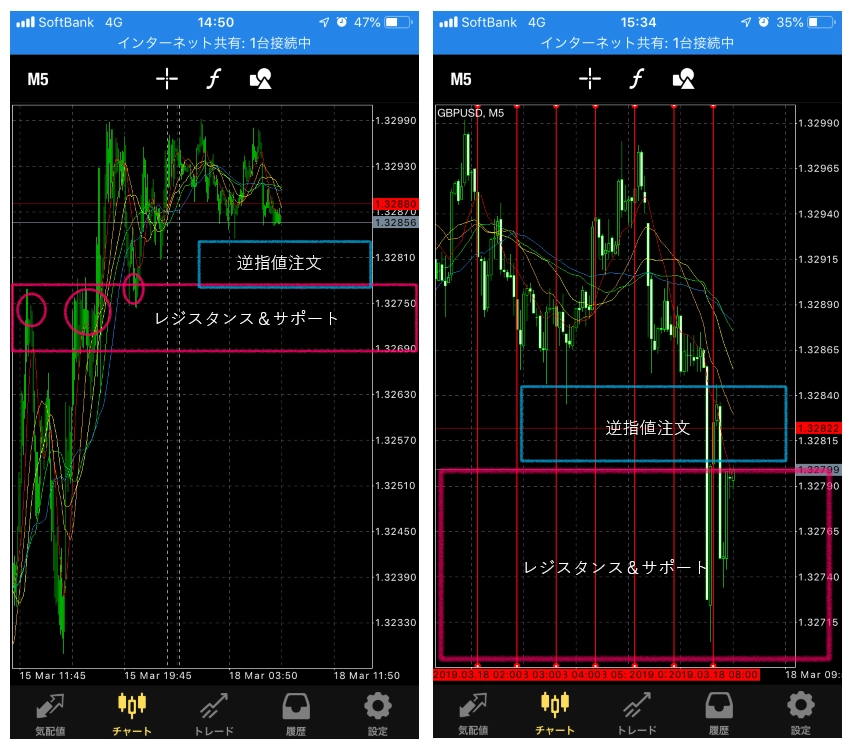
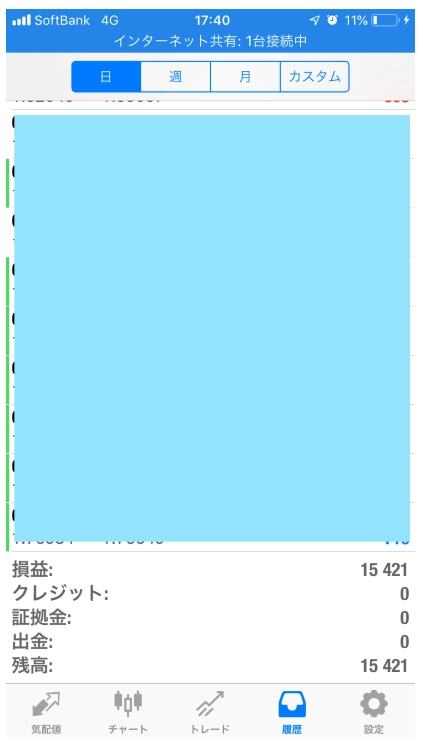
In this trade I was able to take about 8,000 yen in profit.
When you can trade according to your own strategy, you gain confidence and your trading skills improve, I think.
I would be glad if, even a little, I could be a reference for everyone’s trading.
This time it was a winning pattern, but of course there are losing patterns as well.
I’m not too keen on it, but I would like to publish the losing patterns as well.
Above all, this was “GOTOさんFX” by Gotō.
※ The total is said to be 15,420 yen, but this includes profits from automated trading as well.
GOTO